Special Report
How Maryland's Job Market Has Fared Since Trump Was Elected

Published:
Last Updated:
Of course, if history is any guide, much of the economy is subject to boom and bust cycles — and the job market is no exception. In the last seven years — a period that spanned three presidential administrations and included a global pandemic — the average annual unemployment rate in the U.S. has fluctuated between 3.6% and 8.1%, according to the Bureau of Labor Statistics.
These same cyclical patterns are also evident in Maryland, where the job market is supported largely by the professional and scientific and public administration industries. The annual unemployment rate in the state was 3.2% in 2022, a multi-decade low. However, conditions for job seekers have not always been so favorable.
According to BLS data going back to 2016, the year Donald Trump was elected president, the annual jobless rate has been as high as 6.8% in Maryland.
This is how Maryland’s job market has changed since 2016.


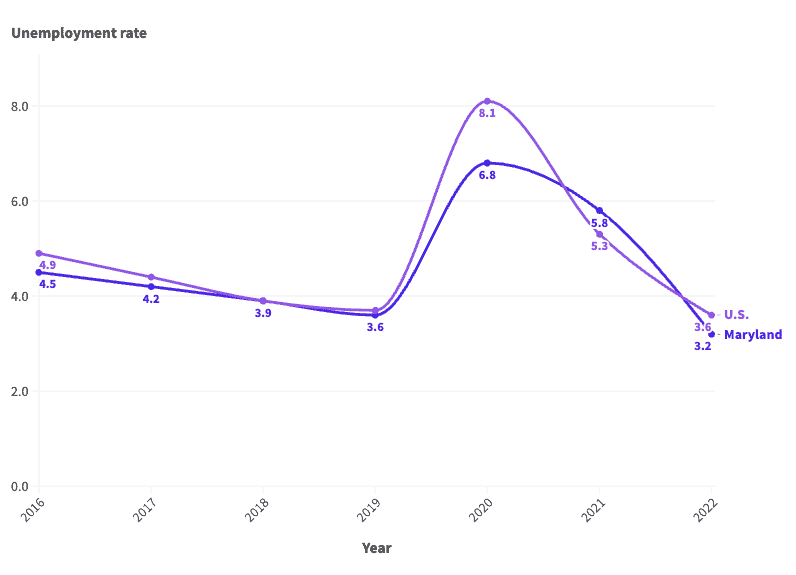
| Year | Maryland unemployment rate (%) | U.S. unemployment rate (%) | Unemployed population in Maryland |
|---|---|---|---|
| 2016 | 4.5 | 4.9 | 135,091 |
| 2017 | 4.2 | 4.4 | 129,316 |
| 2018 | 3.9 | 3.9 | 124,150 |
| 2019 | 3.6 | 3.7 | 113,048 |
| 2020 | 6.8 | 8.1 | 210,055 |
| 2021 | 5.8 | 5.3 | 168,222 |
| 2022 | 3.2 | 3.6 | 102,813 |
After two decades of reviewing financial products I haven’t seen anything like this. Credit card companies are at war, handing out free rewards and benefits to win the best customers.
A good cash back card can be worth thousands of dollars a year in free money, not to mention other perks like travel, insurance, and access to fancy lounges.
Our top pick today pays up to 5% cash back, a $200 bonus on top, and $0 annual fee. Click here to apply before they stop offering rewards this generous.
Flywheel Publishing has partnered with CardRatings for our coverage of credit card products. Flywheel Publishing and CardRatings may receive a commission from card issuers.
Thank you for reading! Have some feedback for us?
Contact the 24/7 Wall St. editorial team.


Our expert who first called NVIDIA in 2009 is predicting 2025 will see a historic AI breakthrough.
You can follow him investing $500,000 of his own money on our top AI stocks for free.