
There are many jobs in the world that we might think of as being especially dangerous – from law enforcement agents and firefighters to members of the military. While these professions are dangerous and come with high risks, it may come as a shock that they are not the most dangerous jobs in the United States. According to data from the U.S. Bureau of Labor Statistics, the national average fatality rate across all professions tracked by the U.S. Department of Labor is a mere 3.3 deaths per 100,000 workers. But frighteningly, there are roughly two dozen occupations where that rate is many times higher than that, including one with a fatality rate of a staggering 530 fatal injuries per 100,000 workers.
24/7 Wall St. reviewed the 2021 Census of Fatal Occupational Injuries from the BLS to determine the most dangerous jobs in the United States. Occupations are ranked according to the most annual fatal injuries per 100,000 workers. Employment data used to calculate fatalities and injuries per worker came from the BLS Employment Projections program for 2021. We excluded broad categories of occupations and occupations with fewer than five reported fatalities in 2021.
Some high-risk professions listed here may be unexpected, such as athletes and taxi drivers, while others come as no surprise, such as loggers, commercial divers, industrial fishers, and virtually any blue-collar role within the nation’s oil and gas fields. The list also encompasses lower-paying positions such as taxi drivers, tree pruners, and roofers, as well as jobs in various mechanical trades like farm equipment mechanics, power-line installers, and elevator repairers. (Also read, 18 hazardous jobs the US military pays extra for.)
Here are the most dangerous jobs in the United States
See below to read our detailed methodology.
23. Crane and tower operators

- Fatal work injury rate (2021): 20.0 per 100,000
- Fatal work injuries (2021): 9
- Common cause of fatal injury: Contact with objects and equipment
- Non-fatal injuries (2020): 390 (864.7 per 100,000)
- Total employed (2021): 45,100
22. Farmworkers, farm, ranch, and aquacultural animals

- Fatal work injury rate (2021): 20.1 per 100,000
- Fatal work injuries (2021): 46
- Common cause of fatal injury: Transportation incidents
- Non-fatal injuries (2020): 4,950 (2,166.3 per 100,000)
- Total employed (2021): 228,500
21. Structural iron and steel workers
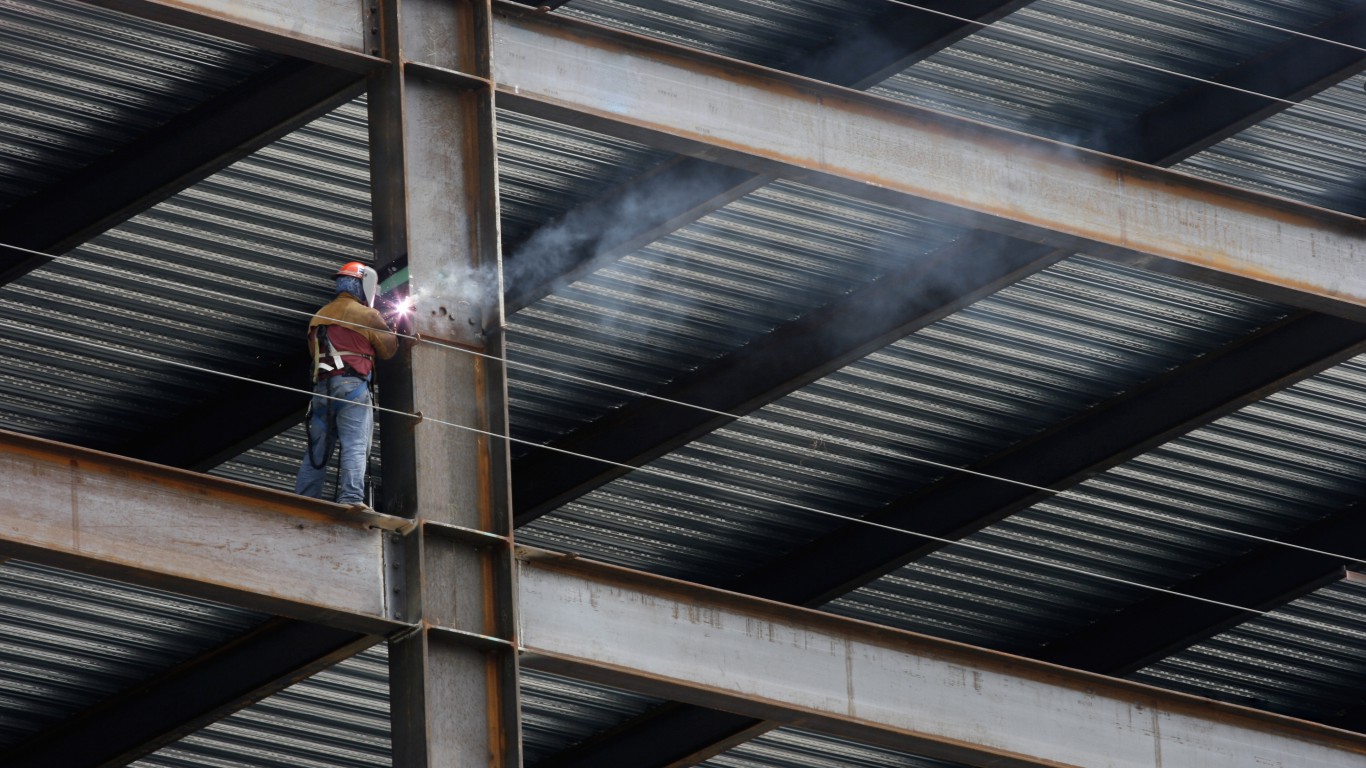
- Fatal work injury rate (2021): 20.3 per 100,000
- Fatal work injuries (2021): 14
- Common cause of fatal injury: Falls, slips, trips
- Non-fatal injuries (2020): 780 (1,130.4 per 100,000)
- Total employed (2021): 69,000
20. Roustabouts, oil and gas

- Fatal work injury rate (2021): 21.4 per 100,000
- Fatal work injuries (2021): 8
- Common cause of fatal injury: Transportation incidents
- Non-fatal injuries (2020): 520 (1,394.1 per 100,000)
- Total employed (2021): 37,300
19. Elevator and escalator installers and repairers

- Fatal work injury rate (2021): 21.6 per 100,000
- Fatal work injuries (2021): 5
- Common cause of fatal injury: Falls
- Non-fatal injuries (2020): 400 (1,724.1 per 100,000)
- Total employed (2021): 23,200
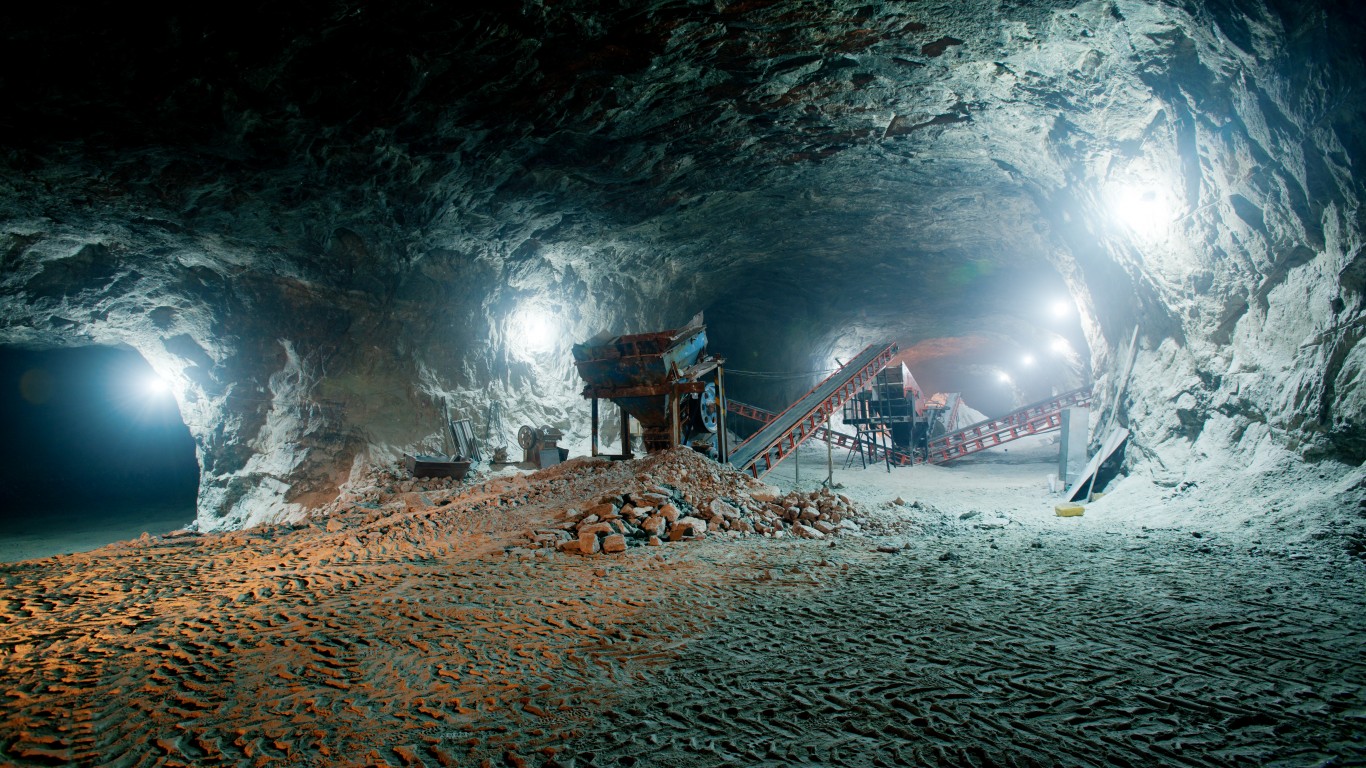
18. Excavating and loading machine and dragline operators, surface mining
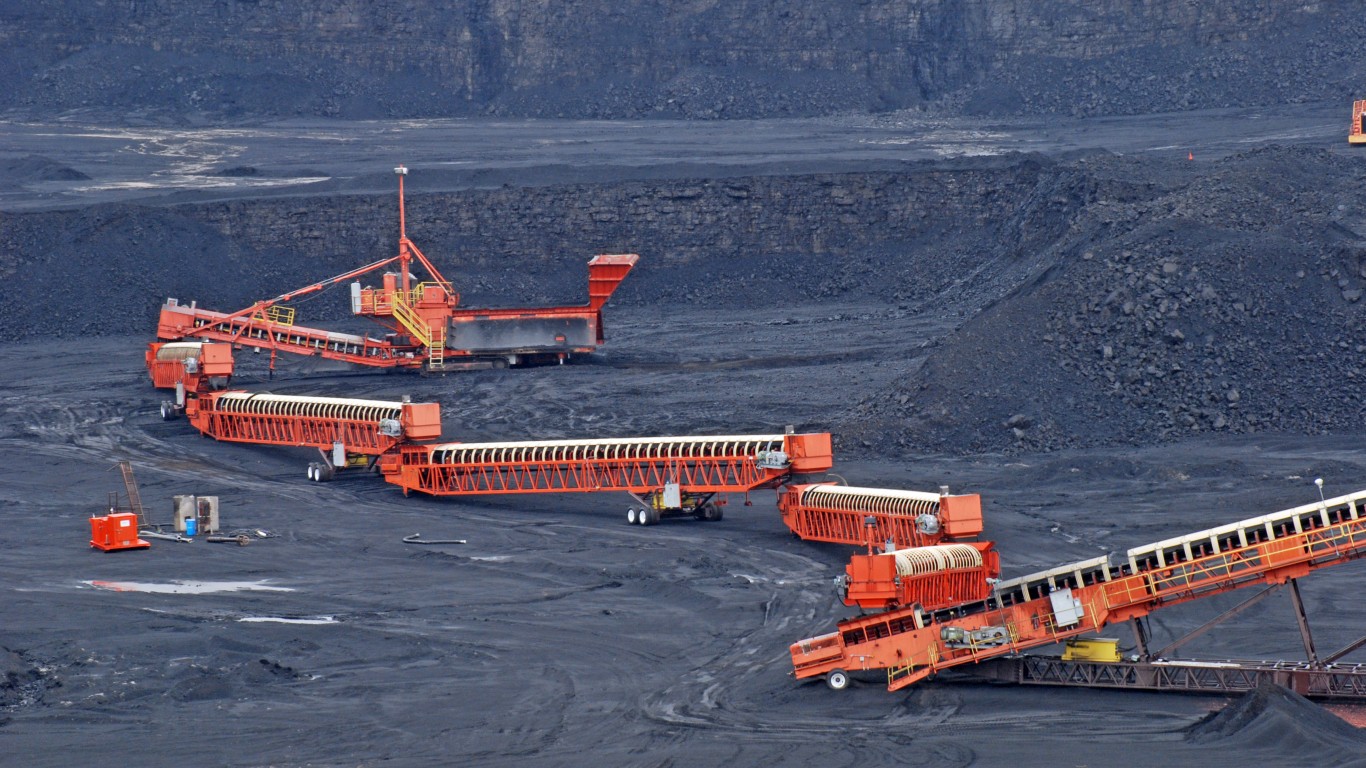
- Fatal work injury rate (2021): 21.9 per 100,000
- Fatal work injuries (2021): 8
- Common cause of fatal injury: Contact with objects and equipment
- Non-fatal injuries (2020): 40 (109.6 per 100,000)
- Total employed (2021): 36,500
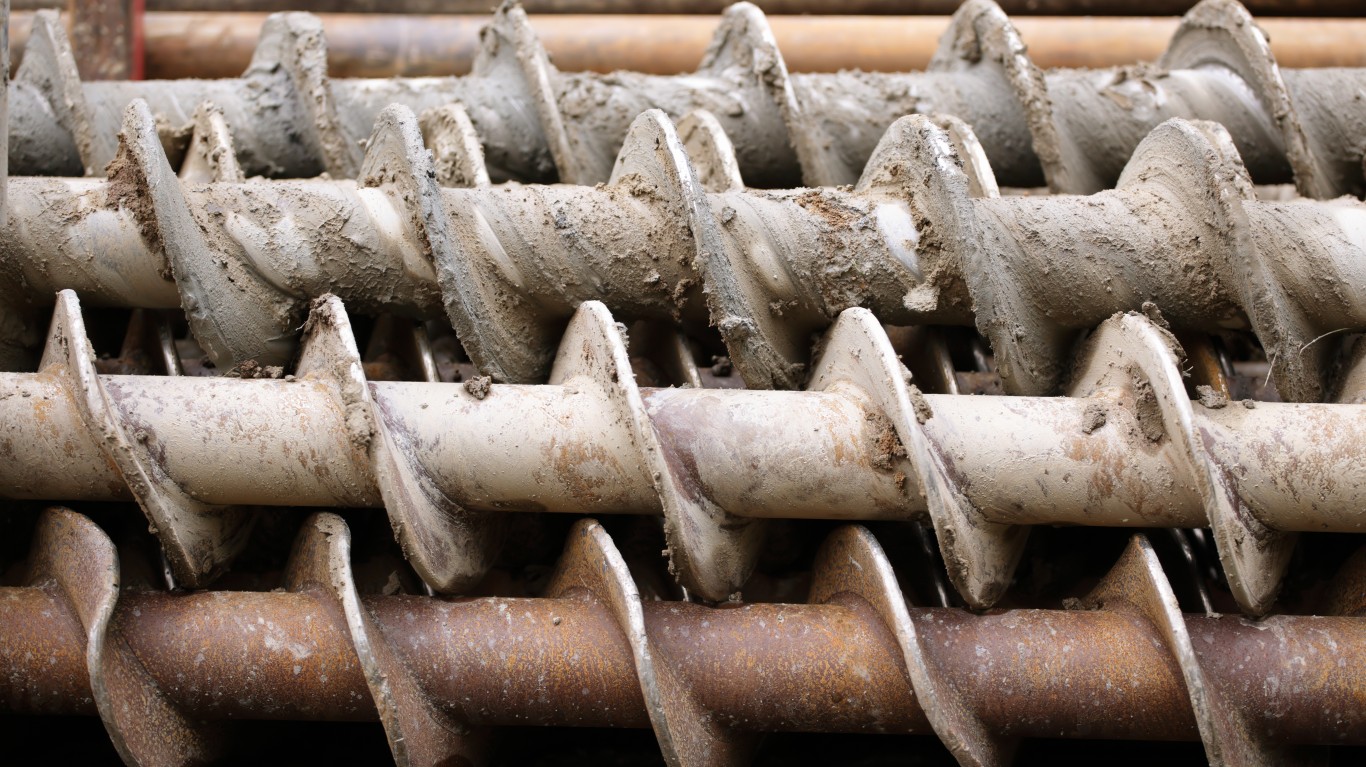
17. Maintenance workers, machinery
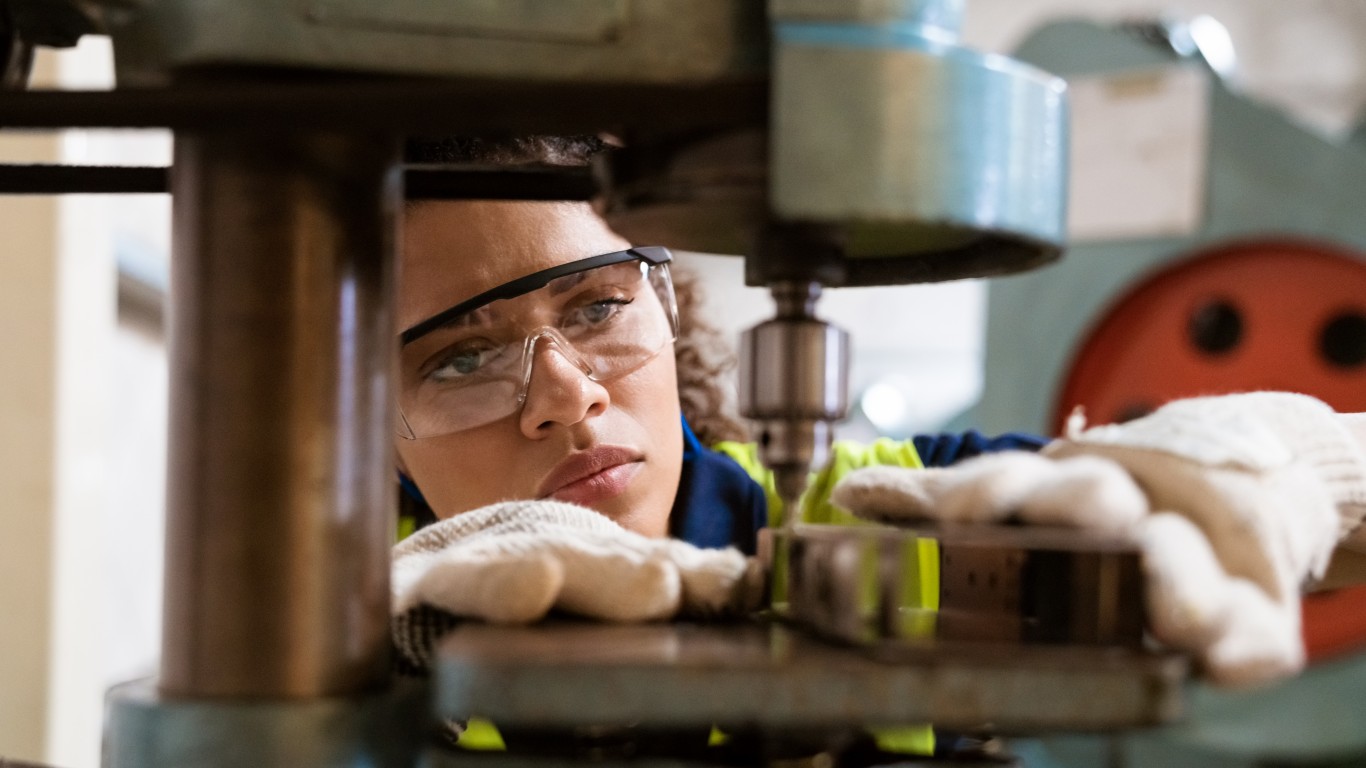
- Fatal work injury rate (2021): 22.2 per 100,000
- Fatal work injuries (2021): 13
- Common cause of fatal injury: Falls, slips, trips
- Non-fatal injuries (2020): 720 (1,230.8 per 100,000)
- Total employed (2021): 58,500
16. Audiovisual equipment installers and repairers
- Fatal work injury rate (2021): 22.6 per 100,000
- Fatal work injuries (2021): 6
- Common cause of fatal injury: N/A
- Non-fatal injuries (2020): 340 (1,278.2 per 100,000)
- Total employed (2021): 26,600
15. Taxi drivers

- Fatal work injury rate (2021): 23.3 per 100,000
- Fatal work injuries (2021): 30
- Common cause of fatal injury: Murder
- Non-fatal injuries (2020): 260 (202.3 per 100,000)
- Total employed (2021): 128,500
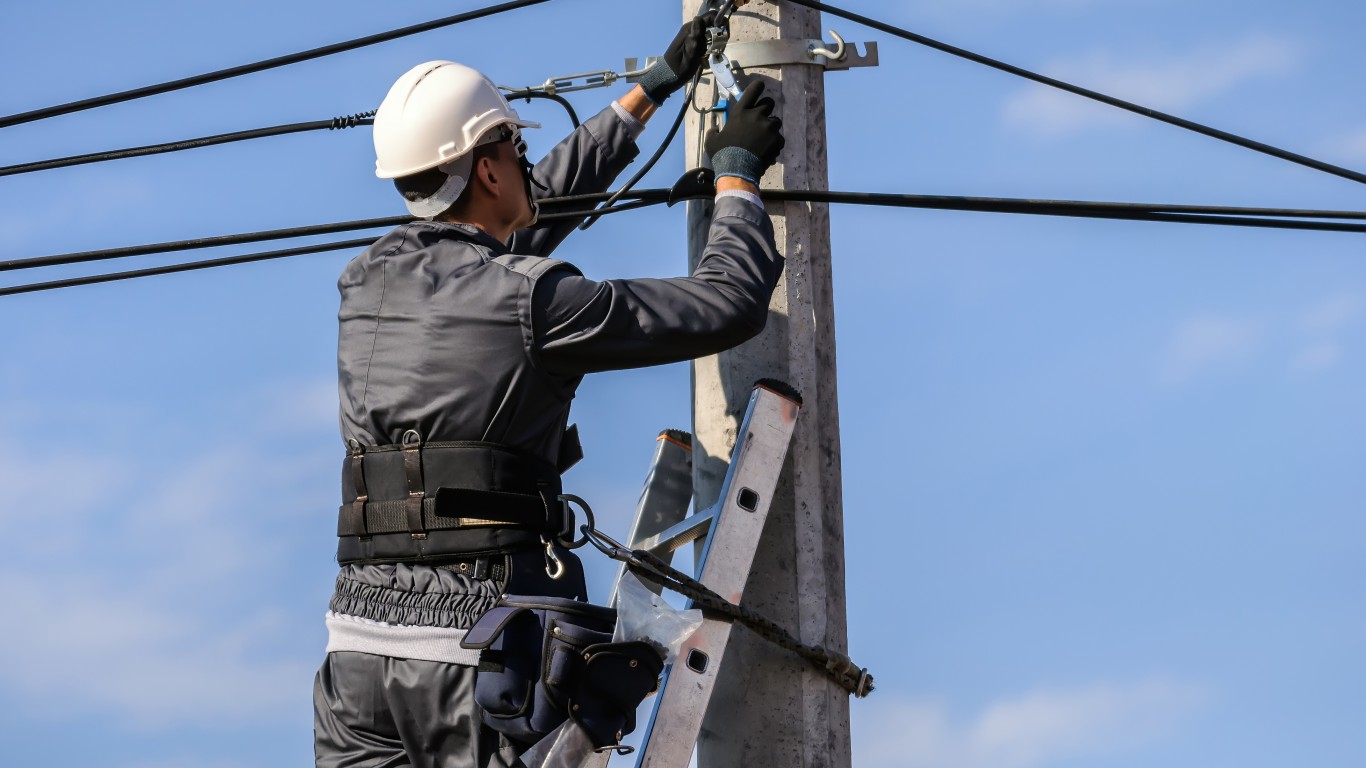
14. Electrical power-line installers and repairers
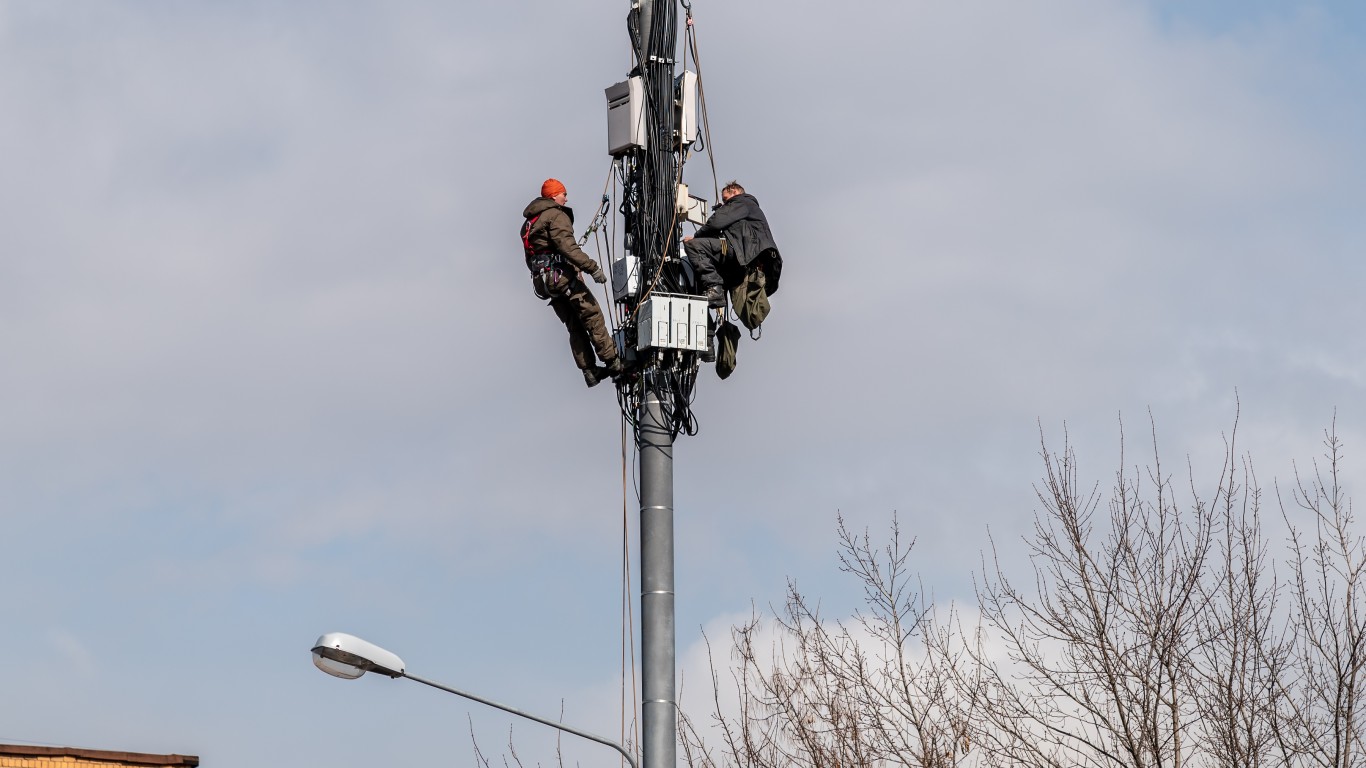
- Fatal work injury rate (2021): 23.7 per 100,000
- Fatal work injuries (2021): 30
- Common cause of fatal injury: Exposure to harmful substances or environments
- Non-fatal injuries (2020): 1,910 (1,508.7 per 100,000)
- Total employed (2021): 126,600
13. Wellhead pumpers

- Fatal work injury rate (2021): 27.8 per 100,000
- Fatal work injuries (2021): 5
- Common cause of fatal injury: Electrocution, explosion
- Non-fatal injuries (2020): 20 (111.1 per 100,000)
- Total employed (2021): 18,000
12. Farm equipment mechanics and service technicians

- Fatal work injury rate (2021): 28.3 per 100,000
- Fatal work injuries (2021): 14
- Common cause of fatal injury: Contact with objects and equipment
- Non-fatal injuries (2020): 660 (1,333.3 per 100,000)
- Total employed (2021): 49,500
11. First-line supervisors of farming, fishing, and forestry workers
- Fatal work injury rate (2021): 30.0 per 100,000
- Fatal work injuries (2021): 16
- Common cause of fatal injury: Transportation incidents
- Non-fatal injuries (2020): 460 (863.0 per 100,000)
- Total employed (2021): 53,300
10. Sailors and marine oilers
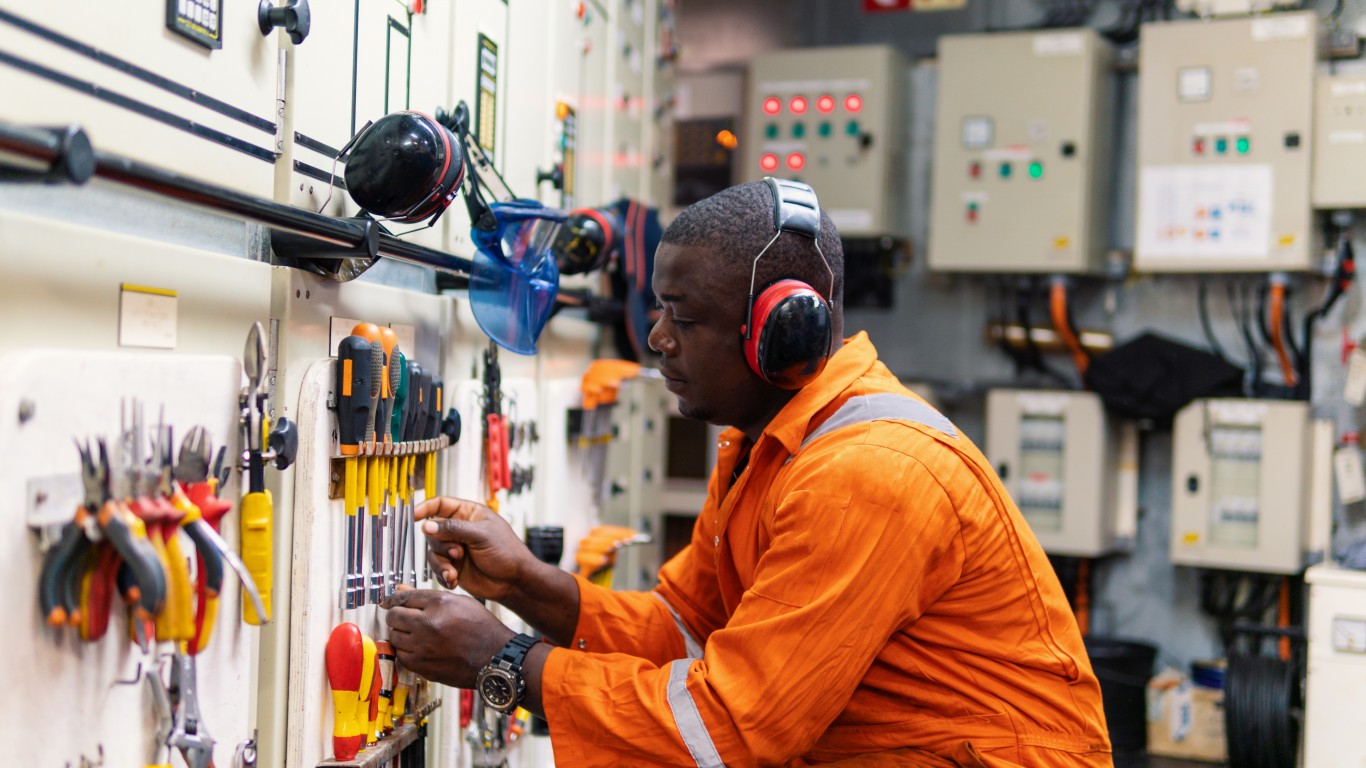
- Fatal work injury rate (2021): 36.2 per 100,000
- Fatal work injuries (2021): 10
- Common cause of fatal injury: Transportation incidents
- Non-fatal injuries (2020): 380 (1,376.8 per 100,000)
- Total employed (2021): 27,600
9. Athletes and sports competitors

- Fatal work injury rate (2021): 38.0 per 100,000
- Fatal work injuries (2021): 6
- Common cause of fatal injury: Sudden cardiac death
- Non-fatal injuries (2020): 920 (5,822.8 per 100,000)
- Total employed (2021): 15,800
8. Heavy and tractor-trailer truck drivers

- Fatal work injury rate (2021): 41.7 per 100,000
- Fatal work injuries (2021): 874
- Common cause of fatal injury: Transportation incidents
- Non-fatal injuries (2020): 43,500 (2,076.7 per 100,000)
- Total employed (2021): 2,094,700
7. Earth drillers, except oil and gas
- Fatal work injury rate (2021): 42.9 per 100,000
- Fatal work injuries (2021): 7
- Common cause of fatal injury: Contact with objects and equipment
- Non-fatal injuries (2020): 240 (1,472.4 per 100,000)
- Total employed (2021): 16,300
6. Roofers

- Fatal work injury rate (2021): 72.4 per 100,000
- Fatal work injuries (2021): 115
- Common cause of fatal injury: Falls, slips, trips
- Non-fatal injuries (2020): 1,960 (1,234.3 per 100,000)
- Total employed (2021): 158,800
5. Extraction worker helpers
- Fatal work injury rate (2021): 80.6 per 100,000
- Fatal work injuries (2021): 5
- Common cause of fatal injury: Transportation incidents
- Non-fatal injuries (2020): 20 (322.6 per 100,000)
- Total employed (2021): 6,200
4. Tree trimmers and pruners
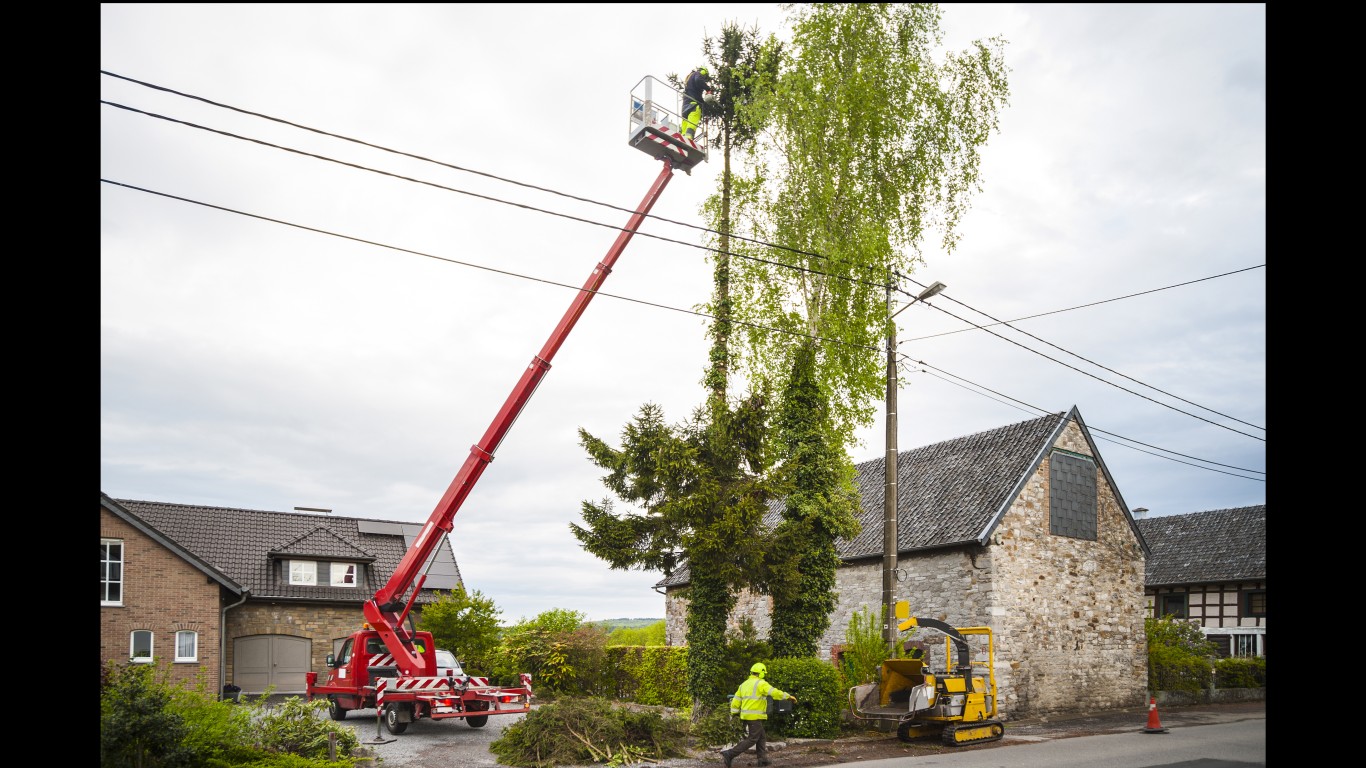
- Fatal work injury rate (2021): 122.4 per 100,000
- Fatal work injuries (2021): 78
- Common cause of fatal injury: Falls, slips, trips
- Non-fatal injuries (2020): 840 (1,318.7 per 100,000)
- Total employed (2021): 63,700
3. Commercial pilots

- Fatal work injury rate (2021): 123.7 per 100,000
- Fatal work injuries (2021): 59
- Common cause of fatal injury: Crashes
- Non-fatal injuries (2020): 190 (398.3 per 100,000)
- Total employed (2021): 47,700
2. Commercial divers

- Fatal work injury rate (2021): 233.3 per 100,000
- Fatal work injuries (2021): 7
- Common cause of fatal injury: Equipment failure
- Non-fatal injuries (2020): N/A
- Total employed (2021): 3,000
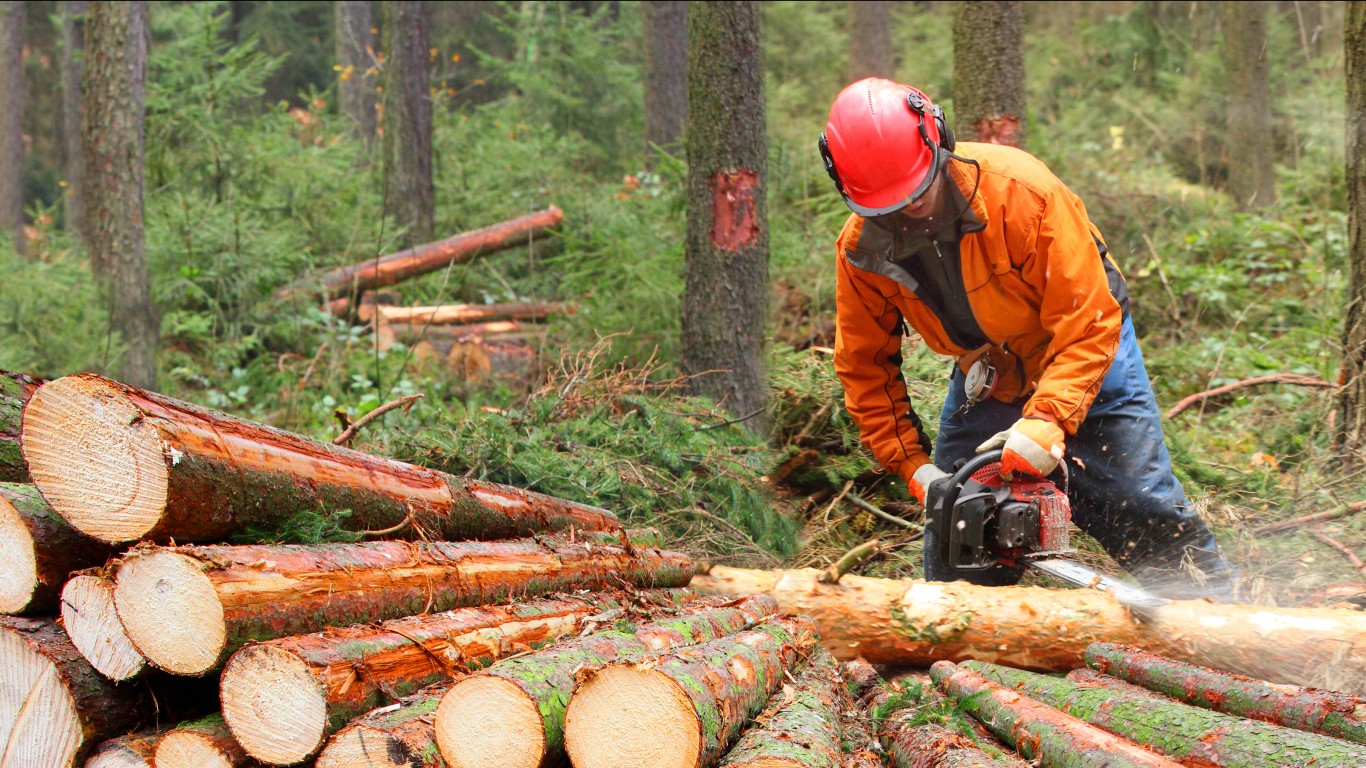
1. Fallers

- Fatal work injury rate (2021): 589.3 per 100,000
- Fatal work injuries (2021): 33
- Common cause of fatal injury: Contact with machine or object (such as a log)
- Non-fatal injuries (2020): 40 (714.3 per 100,000)
- Total employed (2021): 5,600
Methodology
24/7 Wall St. referenced the 2021 Census of Fatal Occupational Injuries from the Bureau of Labor Statistics. Occupations are ranked according to the most annual fatal injuries per 100,000 workers to determine the most dangerous jobs in the United States. Employment data used to calculate fatalities and injuries per worker came from the BLS Employment Projections program for 2021. Non-fatal injury data from the BLS Survey of Non-fatal Occupational Injuries and Illnesses from 2020.
Broad categories of occupations were excluded to avoid double counting fatalities. For example, we included commercial airline pilots on this list of most dangerous jobs but excluded the broader category of airline pilots and flight engineers. Occupations with fewer than five reported fatalities in 2021 were excluded.
Information about common causes of injury also came from the Census of Fatal Occupational Injuries report. The reported injuries are often only a fraction of the total number of fatalities, so the cause listed may not necessarily be the most common cause of 2021 deaths. In cases where causes of death were not reported to the BLS, such as with commercial pilots, fallers, commercial divers, athletes and sports competitors, wellhead pumpers, taxi drivers, elevator and escalator installers, and repairers, we conducted independent research. A clear common cause of death for audiovisual equipment installers and repairers could not be determined.
Take This Retirement Quiz To Get Matched With An Advisor Now (Sponsored)
Are you ready for retirement? Planning for retirement can be overwhelming, that’s why it could be a good idea to speak to a fiduciary financial advisor about your goals today.
Start by taking this retirement quiz right here from SmartAsset that will match you with up to 3 financial advisors that serve your area and beyond in 5 minutes. Smart Asset is now matching over 50,000 people a month.
Click here now to get started.
Thank you for reading! Have some feedback for us?
Contact the 24/7 Wall St. editorial team.
Latest from 24/7