24/7 Wall St. Insights
- In February 2025, the typical U.S. home sold for about 1% below its original listing price.
- In some major cities, buyers are getting huge discounts, with the typical home selling more than 5% below its listing price.
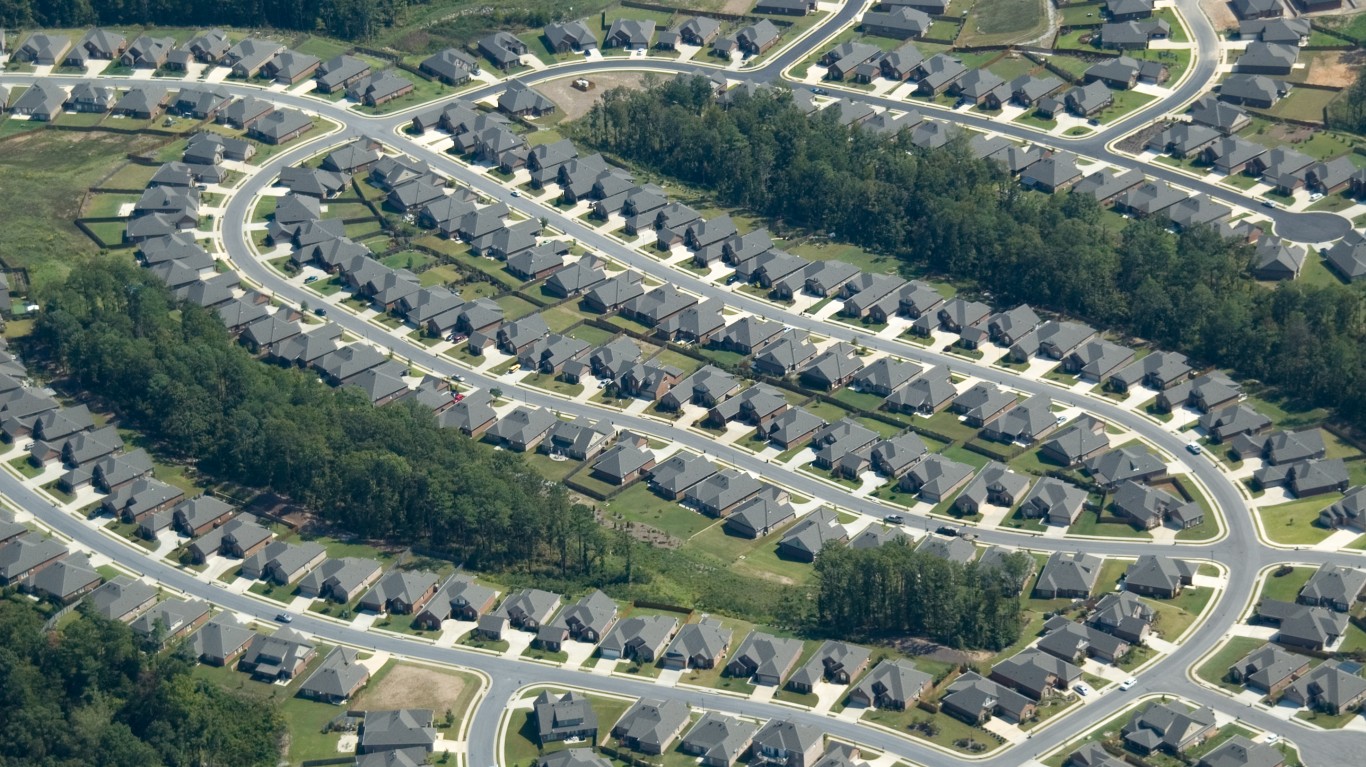
- Many of these buyer’s markets are in once-hot housing markets throughout the South where excess supply and population change have cooled demand.
- Also: Discover the next Nvidia
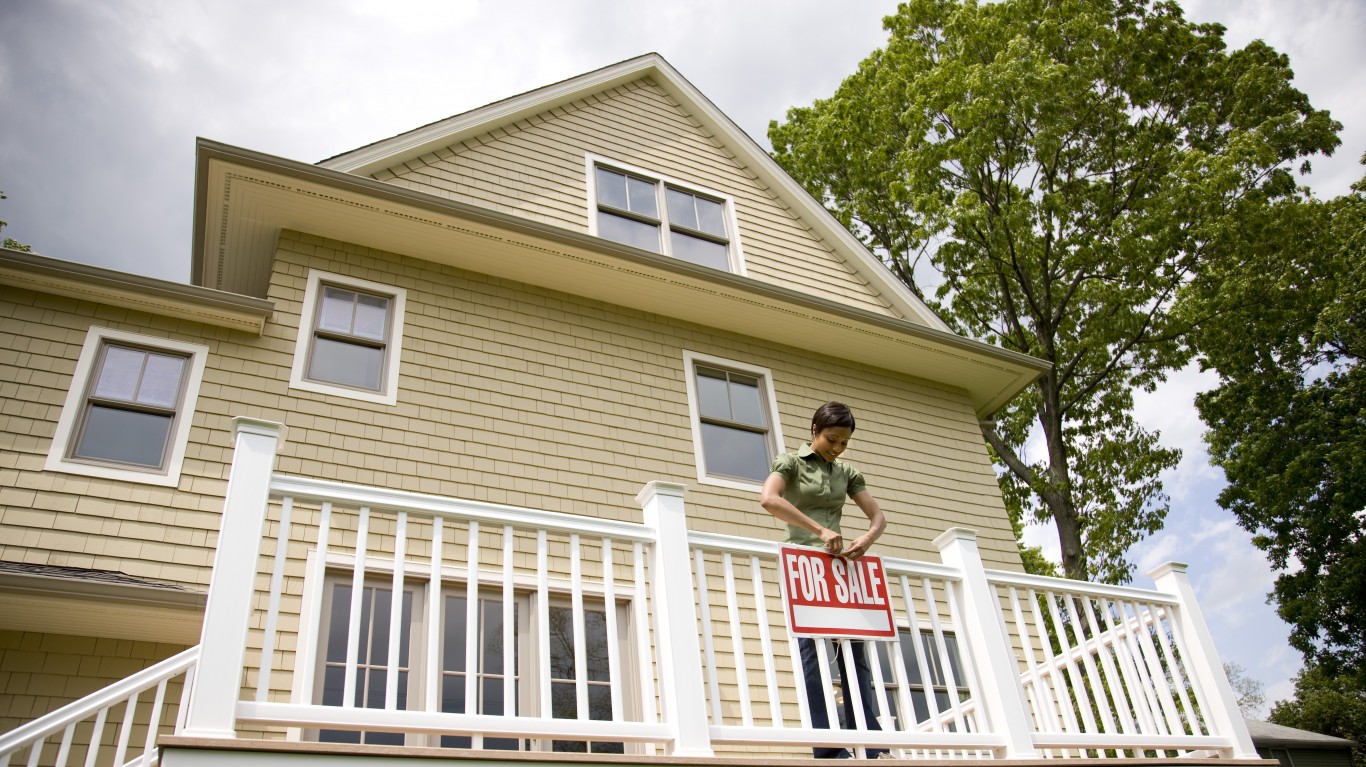
While the U.S. housing market is showing signs of stabilization, last year was one of the more tumultuous years for homebuyers. Mortgage rates spiked during the spring homebuying season, creating new affordability challenges and sidelining potential homebuyers. Home prices continued to rise, causing home sales to fall to their lowest level in over 25 years.
In April 2022, during the peak of the pandemic seller’s market, the typical U.S. home sold for 3% more than its original listing price. The average sale-to-list price ratio returned to its below-1.0 norm in July 2023, and has continued to fall since then. In some major cities, the typical home sells for more than 5% below its original listing price, indicating that home sellers are being forced to offer huge discounts to buyers. Many of these cities are in once-hot housing markets where excess supply and population change are causing demand to dwindle. A closer look at the data reveals the cities where homebuyers are getting the biggest discounts on homes.
To determine the cities where home sellers are being forced to offer huge discounts to buyers, 24/7 Wall St. reviewed data on home sales from Redfin. Metropolitan statistical areas were ranked based on average sale-to-list price ratio – the average of the ratio of each home sold divided by its list price – in February 2025. The average sale-to-list price ratio is a measurement of how close the typical home’s final sale price was to its original list price, and can be an indication of the relative strength of a housing market.
Supplemental data on the share of homes with a price drop – when a home seller reduces their listing price after the home is already on the market – median days on market, median list price, and median final sale price are also from Redfin and are for February 2025. Only metropolitan statistical areas with at least 500 home sales in February 2025 were considered. Data are for all residential homes.
50. Las Vegas, NV

- Average sale-to-list price ratio: 0.98
- Share of homes with price drop: 25.2%
- Typical time on market for homes: 59 days
- Median list price: $450,000
- Median sale price: $443,000
49. Charlotte, NC

- Average sale-to-list price ratio: 0.98
- Share of homes with price drop: 29.3%
- Typical time on market for homes: 70 days
- Median list price: $415,000
- Median sale price: $395,000
48. Cincinnati, OH

- Average sale-to-list price ratio: 0.98
- Share of homes with price drop: 20.7%
- Typical time on market for homes: 49 days
- Median list price: $299,900
- Median sale price: $290,000
47. Phoenix, AZ

- Average sale-to-list price ratio: 0.98
- Share of homes with price drop: 34.2%
- Typical time on market for homes: 65 days
- Median list price: $499,999
- Median sale price: $472,990
46. Cleveland, OH

- Average sale-to-list price ratio: 0.98
- Share of homes with price drop: 25.7%
- Typical time on market for homes: 40 days
- Median list price: $225,000
- Median sale price: $218,000
45. Fayetteville, AR
- Average sale-to-list price ratio: 0.98
- Share of homes with price drop: 19.7%
- Typical time on market for homes: 42 days
- Median list price: $399,000
- Median sale price: $356,000
44. Savannah, GA

- Average sale-to-list price ratio: 0.98
- Share of homes with price drop: 26.9%
- Typical time on market for homes: 70 days
- Median list price: $399,950
- Median sale price: $372,500
43. Oklahoma City, OK

- Average sale-to-list price ratio: 0.98
- Share of homes with price drop: 25.7%
- Typical time on market for homes: 58 days
- Median list price: $286,650
- Median sale price: $268,500
42. Louisville, KY

- Average sale-to-list price ratio: 0.98
- Share of homes with price drop: 26.1%
- Typical time on market for homes: 50 days
- Median list price: $270,000
- Median sale price: $260,000
41. Fort Worth, TX

- Average sale-to-list price ratio: 0.98
- Share of homes with price drop: 29.4%
- Typical time on market for homes: 73 days
- Median list price: $374,990
- Median sale price: $353,250
40. Dayton, OH

- Average sale-to-list price ratio: 0.98
- Share of homes with price drop: 28.6%
- Typical time on market for homes: 49 days
- Median list price: $225,450
- Median sale price: $227,675
39. Nashville, TN

- Average sale-to-list price ratio: 0.98
- Share of homes with price drop: 22.3%
- Typical time on market for homes: 83 days
- Median list price: $514,999
- Median sale price: $456,200
38. Atlanta, GA

- Average sale-to-list price ratio: 0.98
- Share of homes with price drop: 29.4%
- Typical time on market for homes: 68 days
- Median list price: $405,000
- Median sale price: $385,945
37. Winston-Salem, NC

- Average sale-to-list price ratio: 0.98
- Share of homes with price drop: 30.5%
- Typical time on market for homes: 63 days
- Median list price: $319,950
- Median sale price: $299,997
36. Greenville, SC

- Average sale-to-list price ratio: 0.98
- Share of homes with price drop: 28.4%
- Typical time on market for homes: 70 days
- Median list price: $339,900
- Median sale price: $328,400
35. Pensacola, FL

- Average sale-to-list price ratio: 0.98
- Share of homes with price drop: 31.0%
- Typical time on market for homes: 91 days
- Median list price: $350,000
- Median sale price: $324,450
34. Indianapolis, IN

- Average sale-to-list price ratio: 0.98
- Share of homes with price drop: 39.4%
- Typical time on market for homes: 48 days
- Median list price: $300,000
- Median sale price: $297,003
33. Birmingham, AL

- Average sale-to-list price ratio: 0.98
- Share of homes with price drop: 24.2%
- Typical time on market for homes: 76 days
- Median list price: $292,750
- Median sale price: $290,000
32. Philadelphia, PA

- Average sale-to-list price ratio: 0.98
- Share of homes with price drop: 25.0%
- Typical time on market for homes: 56 days
- Median list price: $295,000
- Median sale price: $275,000
31. Tulsa, OK

- Average sale-to-list price ratio: 0.98
- Share of homes with price drop: 28.1%
- Typical time on market for homes: 49 days
- Median list price: $295,000
- Median sale price: $260,000
30. Des Moines, IA

- Average sale-to-list price ratio: 0.98
- Share of homes with price drop: 29.0%
- Typical time on market for homes: 58 days
- Median list price: $300,000
- Median sale price: $285,000
29. Knoxville, TN

- Average sale-to-list price ratio: 0.98
- Share of homes with price drop: 23.1%
- Typical time on market for homes: 78 days
- Median list price: $409,170
- Median sale price: $390,000
28. Baton Rouge, LA

- Average sale-to-list price ratio: 0.98
- Share of homes with price drop: 41.6%
- Typical time on market for homes: 49 days
- Median list price: $275,843
- Median sale price: $260,480
27. Dallas, TX

- Average sale-to-list price ratio: 0.98
- Share of homes with price drop: 32.5%
- Typical time on market for homes: 68 days
- Median list price: $439,900
- Median sale price: $417,000
26. Greensboro, NC

- Average sale-to-list price ratio: 0.98
- Share of homes with price drop: 28.7%
- Typical time on market for homes: 56 days
- Median list price: $300,000
- Median sale price: $293,500
25. Lakeland, FL

- Average sale-to-list price ratio: 0.97
- Share of homes with price drop: 39.1%
- Typical time on market for homes: 71 days
- Median list price: $326,990
- Median sale price: $315,000
24. San Antonio, TX

- Average sale-to-list price ratio: 0.97
- Share of homes with price drop: 37.1%
- Typical time on market for homes: 78 days
- Median list price: $326,788
- Median sale price: $290,000
23. Austin, TX

- Average sale-to-list price ratio: 0.97
- Share of homes with price drop: 28.9%
- Typical time on market for homes: 91 days
- Median list price: $515,000
- Median sale price: $430,000
22. Orlando, FL

- Average sale-to-list price ratio: 0.97
- Share of homes with price drop: 33.2%
- Typical time on market for homes: 64 days
- Median list price: $409,000
- Median sale price: $400,000
21. Palm Bay, FL

- Average sale-to-list price ratio: 0.97
- Share of homes with price drop: 34.0%
- Typical time on market for homes: 79 days
- Median list price: $378,000
- Median sale price: $365,000
20. Little Rock, AR

- Average sale-to-list price ratio: 0.97
- Share of homes with price drop: 21.1%
- Typical time on market for homes: 75 days
- Median list price: $249,900
- Median sale price: $228,000
19. Jacksonville, FL

- Average sale-to-list price ratio: 0.97
- Share of homes with price drop: 34.4%
- Typical time on market for homes: 78 days
- Median list price: $399,900
- Median sale price: $368,995
18. Ocala, FL

- Average sale-to-list price ratio: 0.97
- Share of homes with price drop: 35.5%
- Typical time on market for homes: 78 days
- Median list price: $299,900
- Median sale price: $275,000
17. Detroit, MI

- Average sale-to-list price ratio: 0.97
- Share of homes with price drop: 22.1%
- Typical time on market for homes: 40 days
- Median list price: $175,000
- Median sale price: $180,000
16. Myrtle Beach, SC

- Average sale-to-list price ratio: 0.97
- Share of homes with price drop: 22.5%
- Typical time on market for homes: 107 days
- Median list price: $363,740
- Median sale price: $328,900
15. Gary, IN

- Average sale-to-list price ratio: 0.97
- Share of homes with price drop: 29.1%
- Typical time on market for homes: 71 days
- Median list price: $288,971
- Median sale price: $272,000
14. Crestview, FL

- Average sale-to-list price ratio: 0.97
- Share of homes with price drop: 21.3%
- Typical time on market for homes: 116 days
- Median list price: $550,000
- Median sale price: $429,750
13. Memphis, TN

- Average sale-to-list price ratio: 0.97
- Share of homes with price drop: 23.6%
- Typical time on market for homes: 59 days
- Median list price: $295,000
- Median sale price: $275,000
12. Pittsburgh, PA

- Average sale-to-list price ratio: 0.97
- Share of homes with price drop: 19.7%
- Typical time on market for homes: 85 days
- Median list price: $239,000
- Median sale price: $230,750
11. Tampa, FL

- Average sale-to-list price ratio: 0.97
- Share of homes with price drop: 39.7%
- Typical time on market for homes: 53 days
- Median list price: $399,000
- Median sale price: $365,000
10. Deltona, FL

- Average sale-to-list price ratio: 0.96
- Share of homes with price drop: 35.5%
- Typical time on market for homes: 75 days
- Median list price: $382,063
- Median sale price: $339,990
9. Port St. Lucie, FL

- Average sale-to-list price ratio: 0.96
- Share of homes with price drop: 33.0%
- Typical time on market for homes: 87 days
- Median list price: $439,250
- Median sale price: $415,000
8. Houston, TX

- Average sale-to-list price ratio: 0.96
- Share of homes with price drop: 34.8%
- Typical time on market for homes: 61 days
- Median list price: $359,900
- Median sale price: $325,000
7. North Port, FL

- Average sale-to-list price ratio: 0.96
- Share of homes with price drop: 41.7%
- Typical time on market for homes: 61 days
- Median list price: $459,000
- Median sale price: $410,000
6. New Orleans, LA

- Average sale-to-list price ratio: 0.96
- Share of homes with price drop: 30.8%
- Typical time on market for homes: 95 days
- Median list price: $315,000
- Median sale price: $285,000
5. Miami, FL
- Average sale-to-list price ratio: 0.96
- Share of homes with price drop: 21.2%
- Typical time on market for homes: 94 days
- Median list price: $599,900
- Median sale price: $575,000
4. Cape Coral, FL

- Average sale-to-list price ratio: 0.96
- Share of homes with price drop: 40.9%
- Typical time on market for homes: 67 days
- Median list price: $430,000
- Median sale price: $390,000
3. Fort Lauderdale, FL
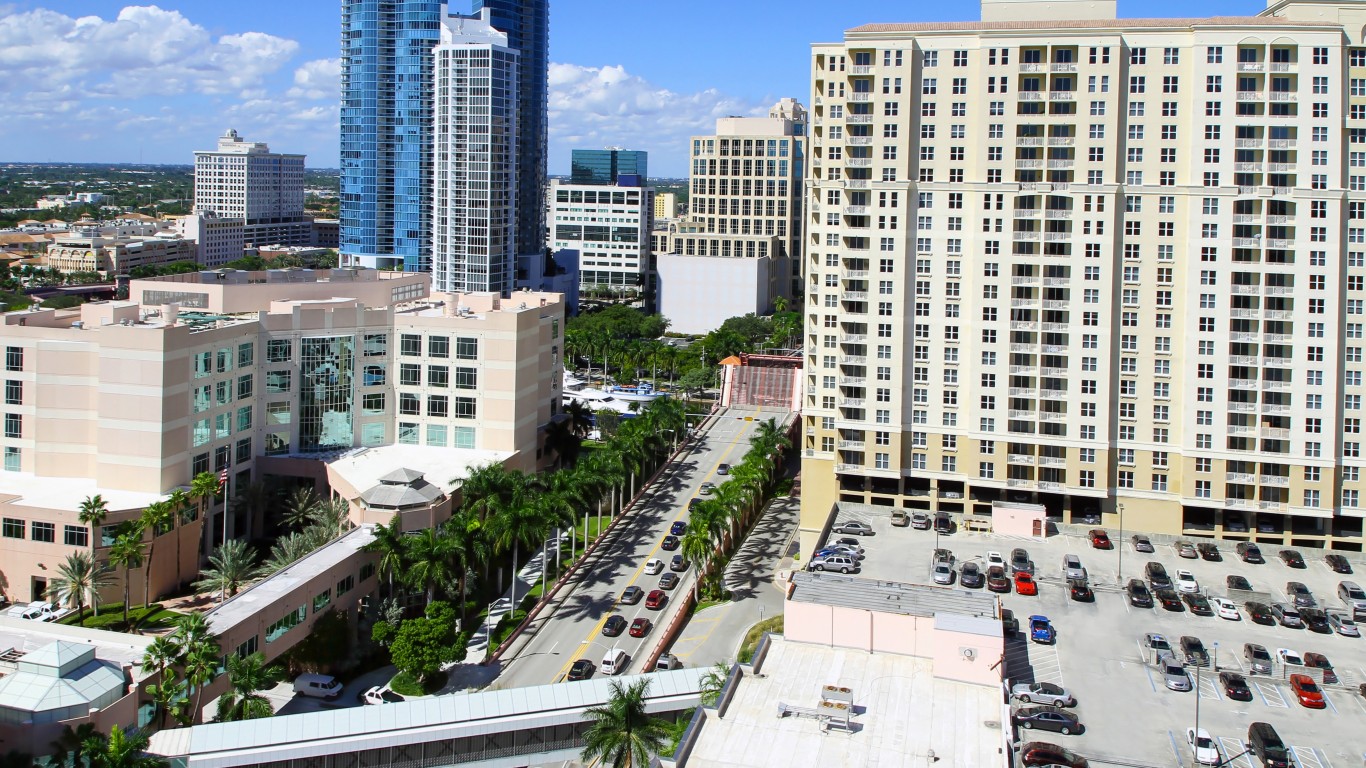
- Average sale-to-list price ratio: 0.96
- Share of homes with price drop: 26.8%
- Typical time on market for homes: 91 days
- Median list price: $443,750
- Median sale price: $465,000
2. West Palm Beach, FL

- Average sale-to-list price ratio: 0.95
- Share of homes with price drop: 29.9%
- Typical time on market for homes: 92 days
- Median list price: $549,000
- Median sale price: $533,750
1. Naples, FL

- Average sale-to-list price ratio: 0.95
- Share of homes with price drop: 39.7%
- Typical time on market for homes: 72 days
- Median list price: $725,000
- Median sale price: $710,000