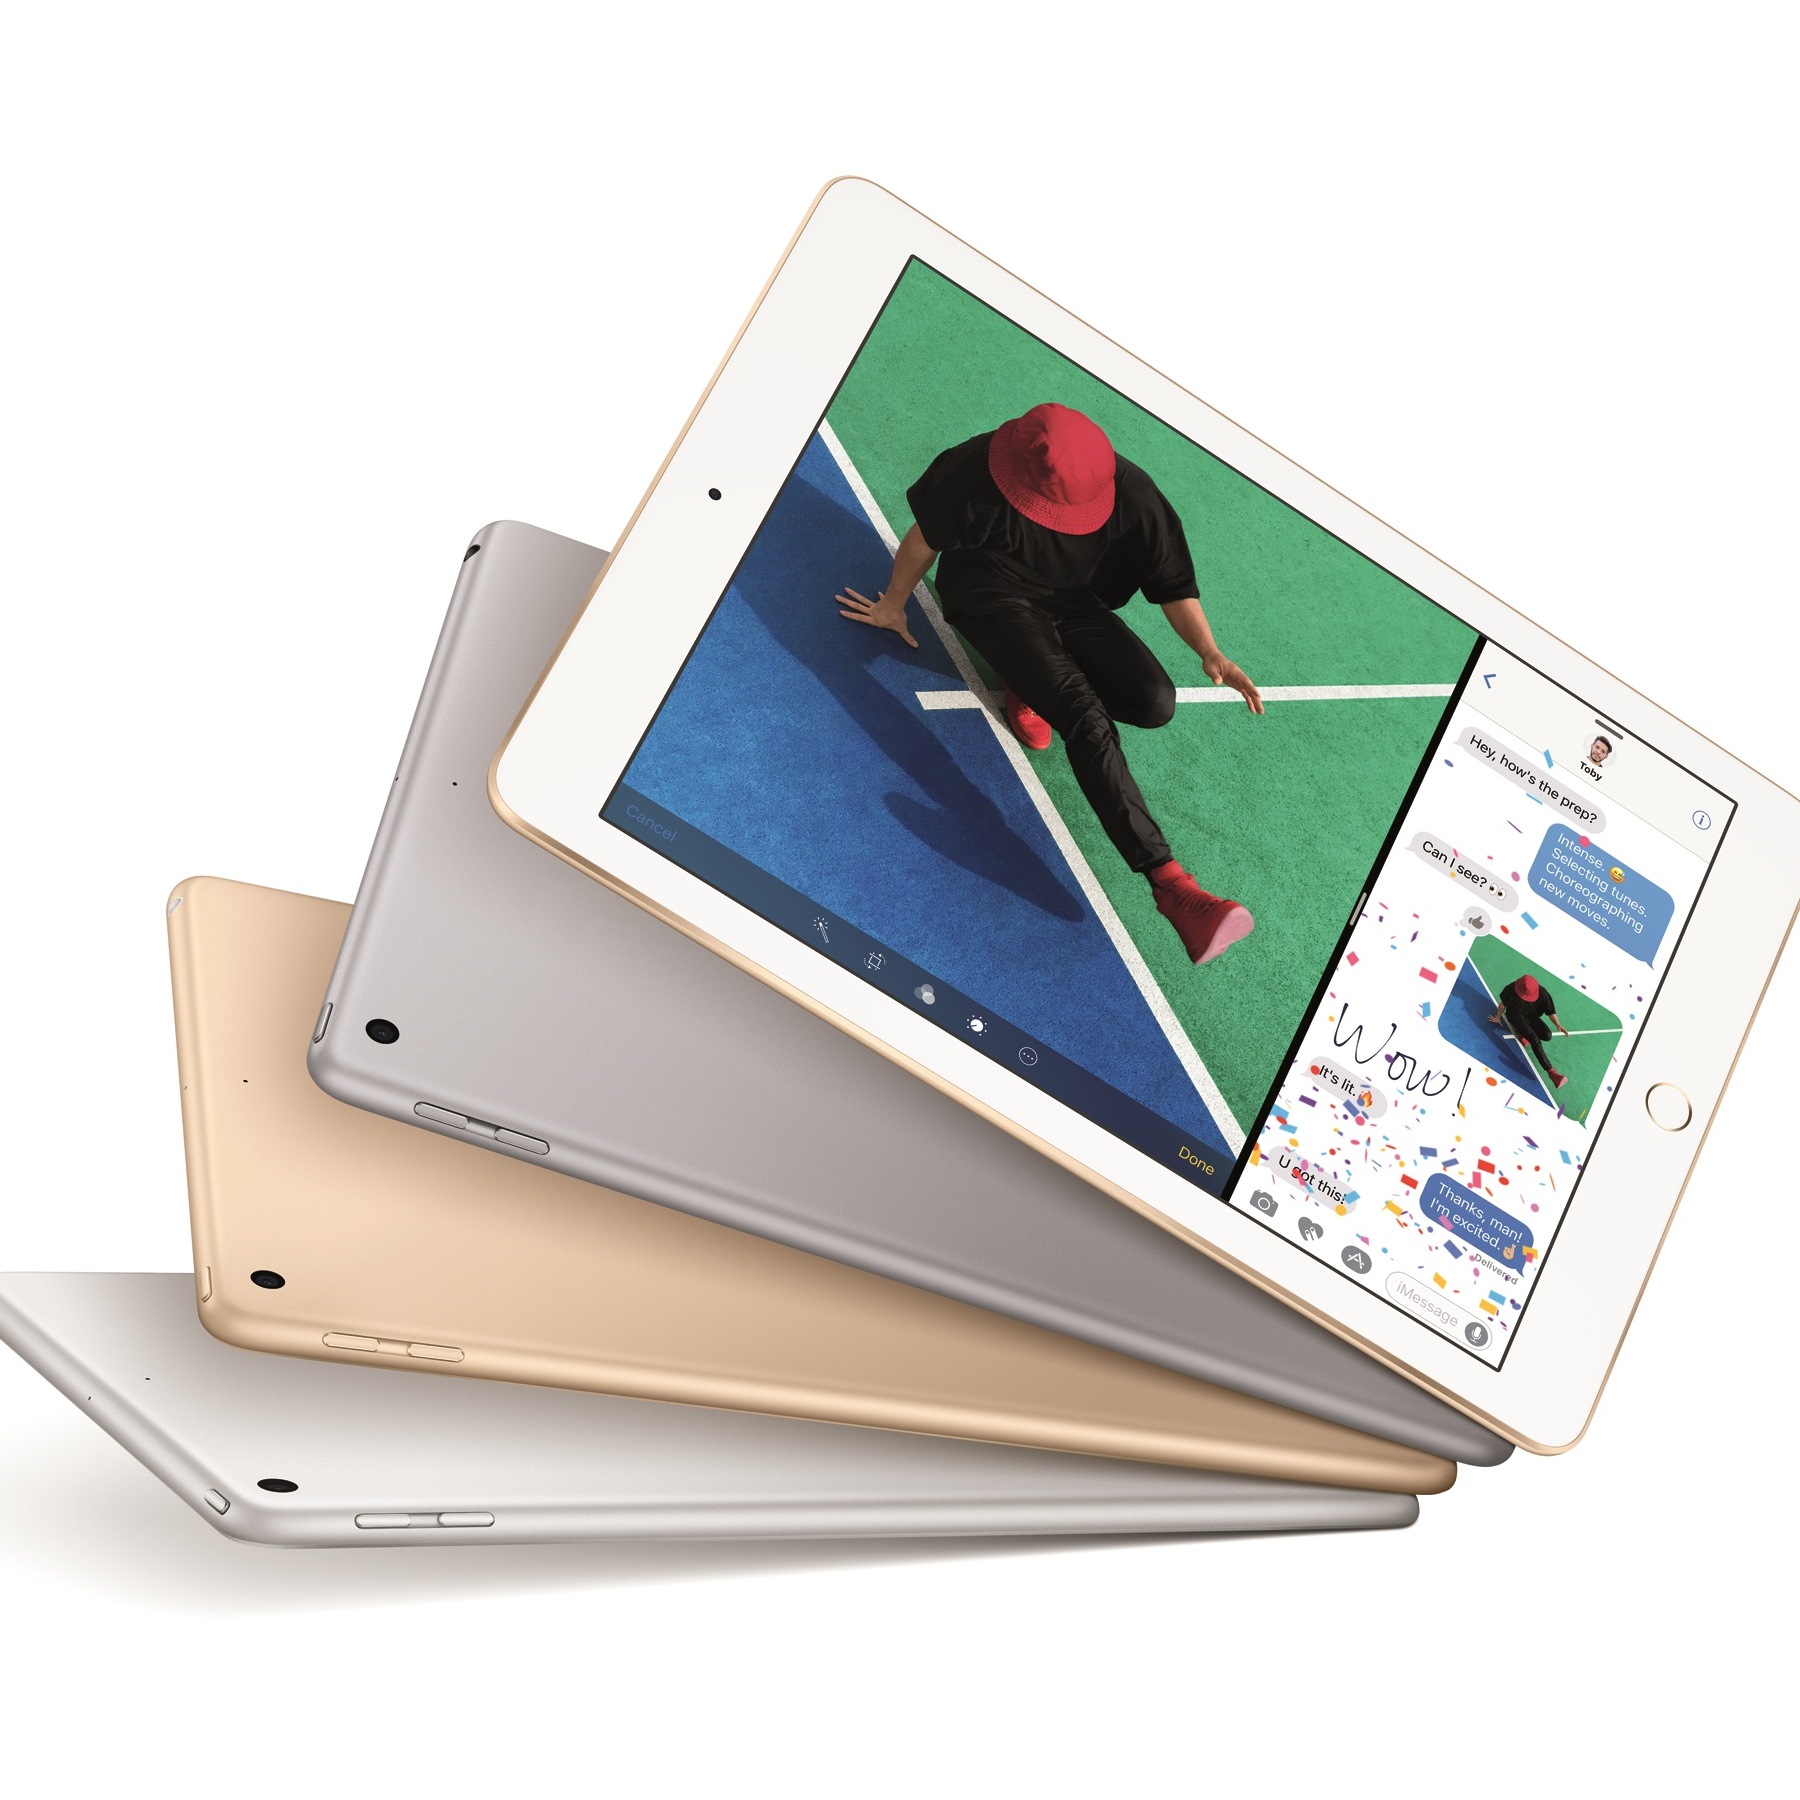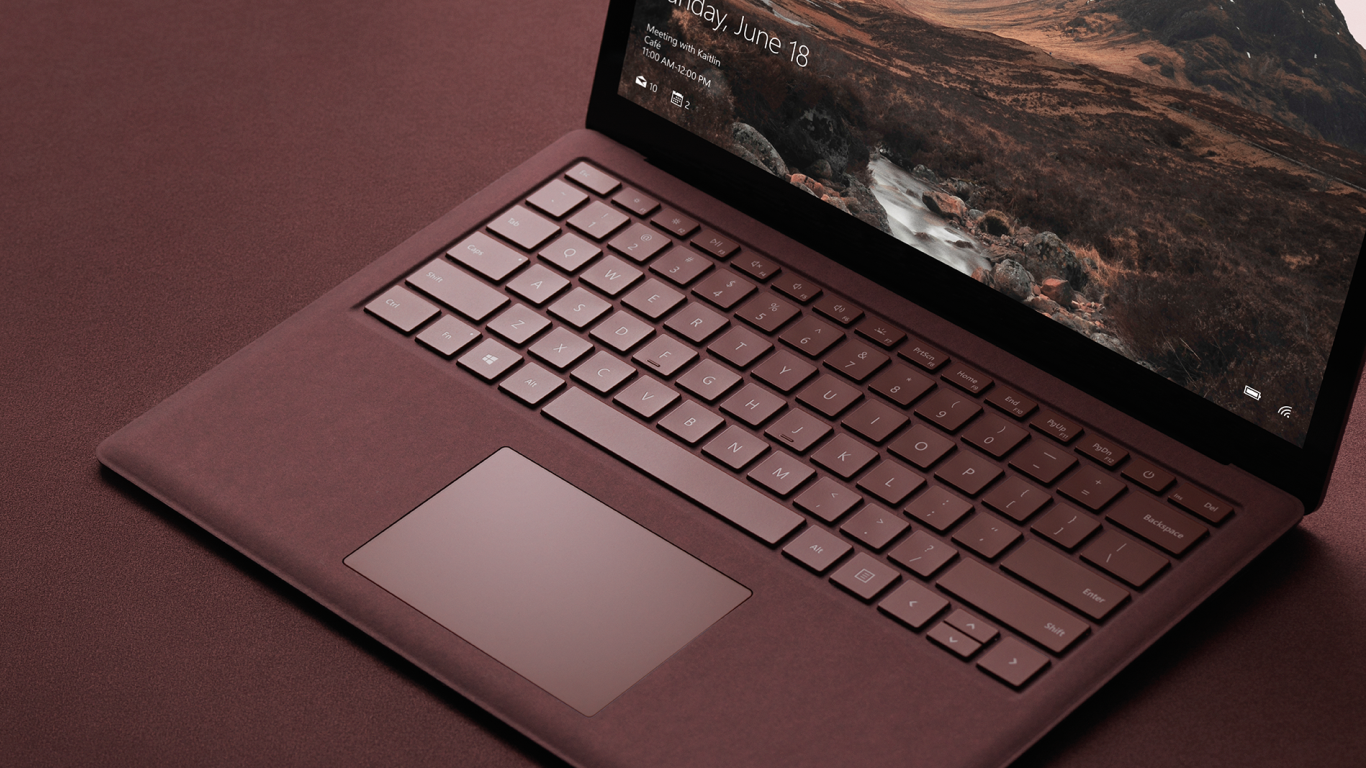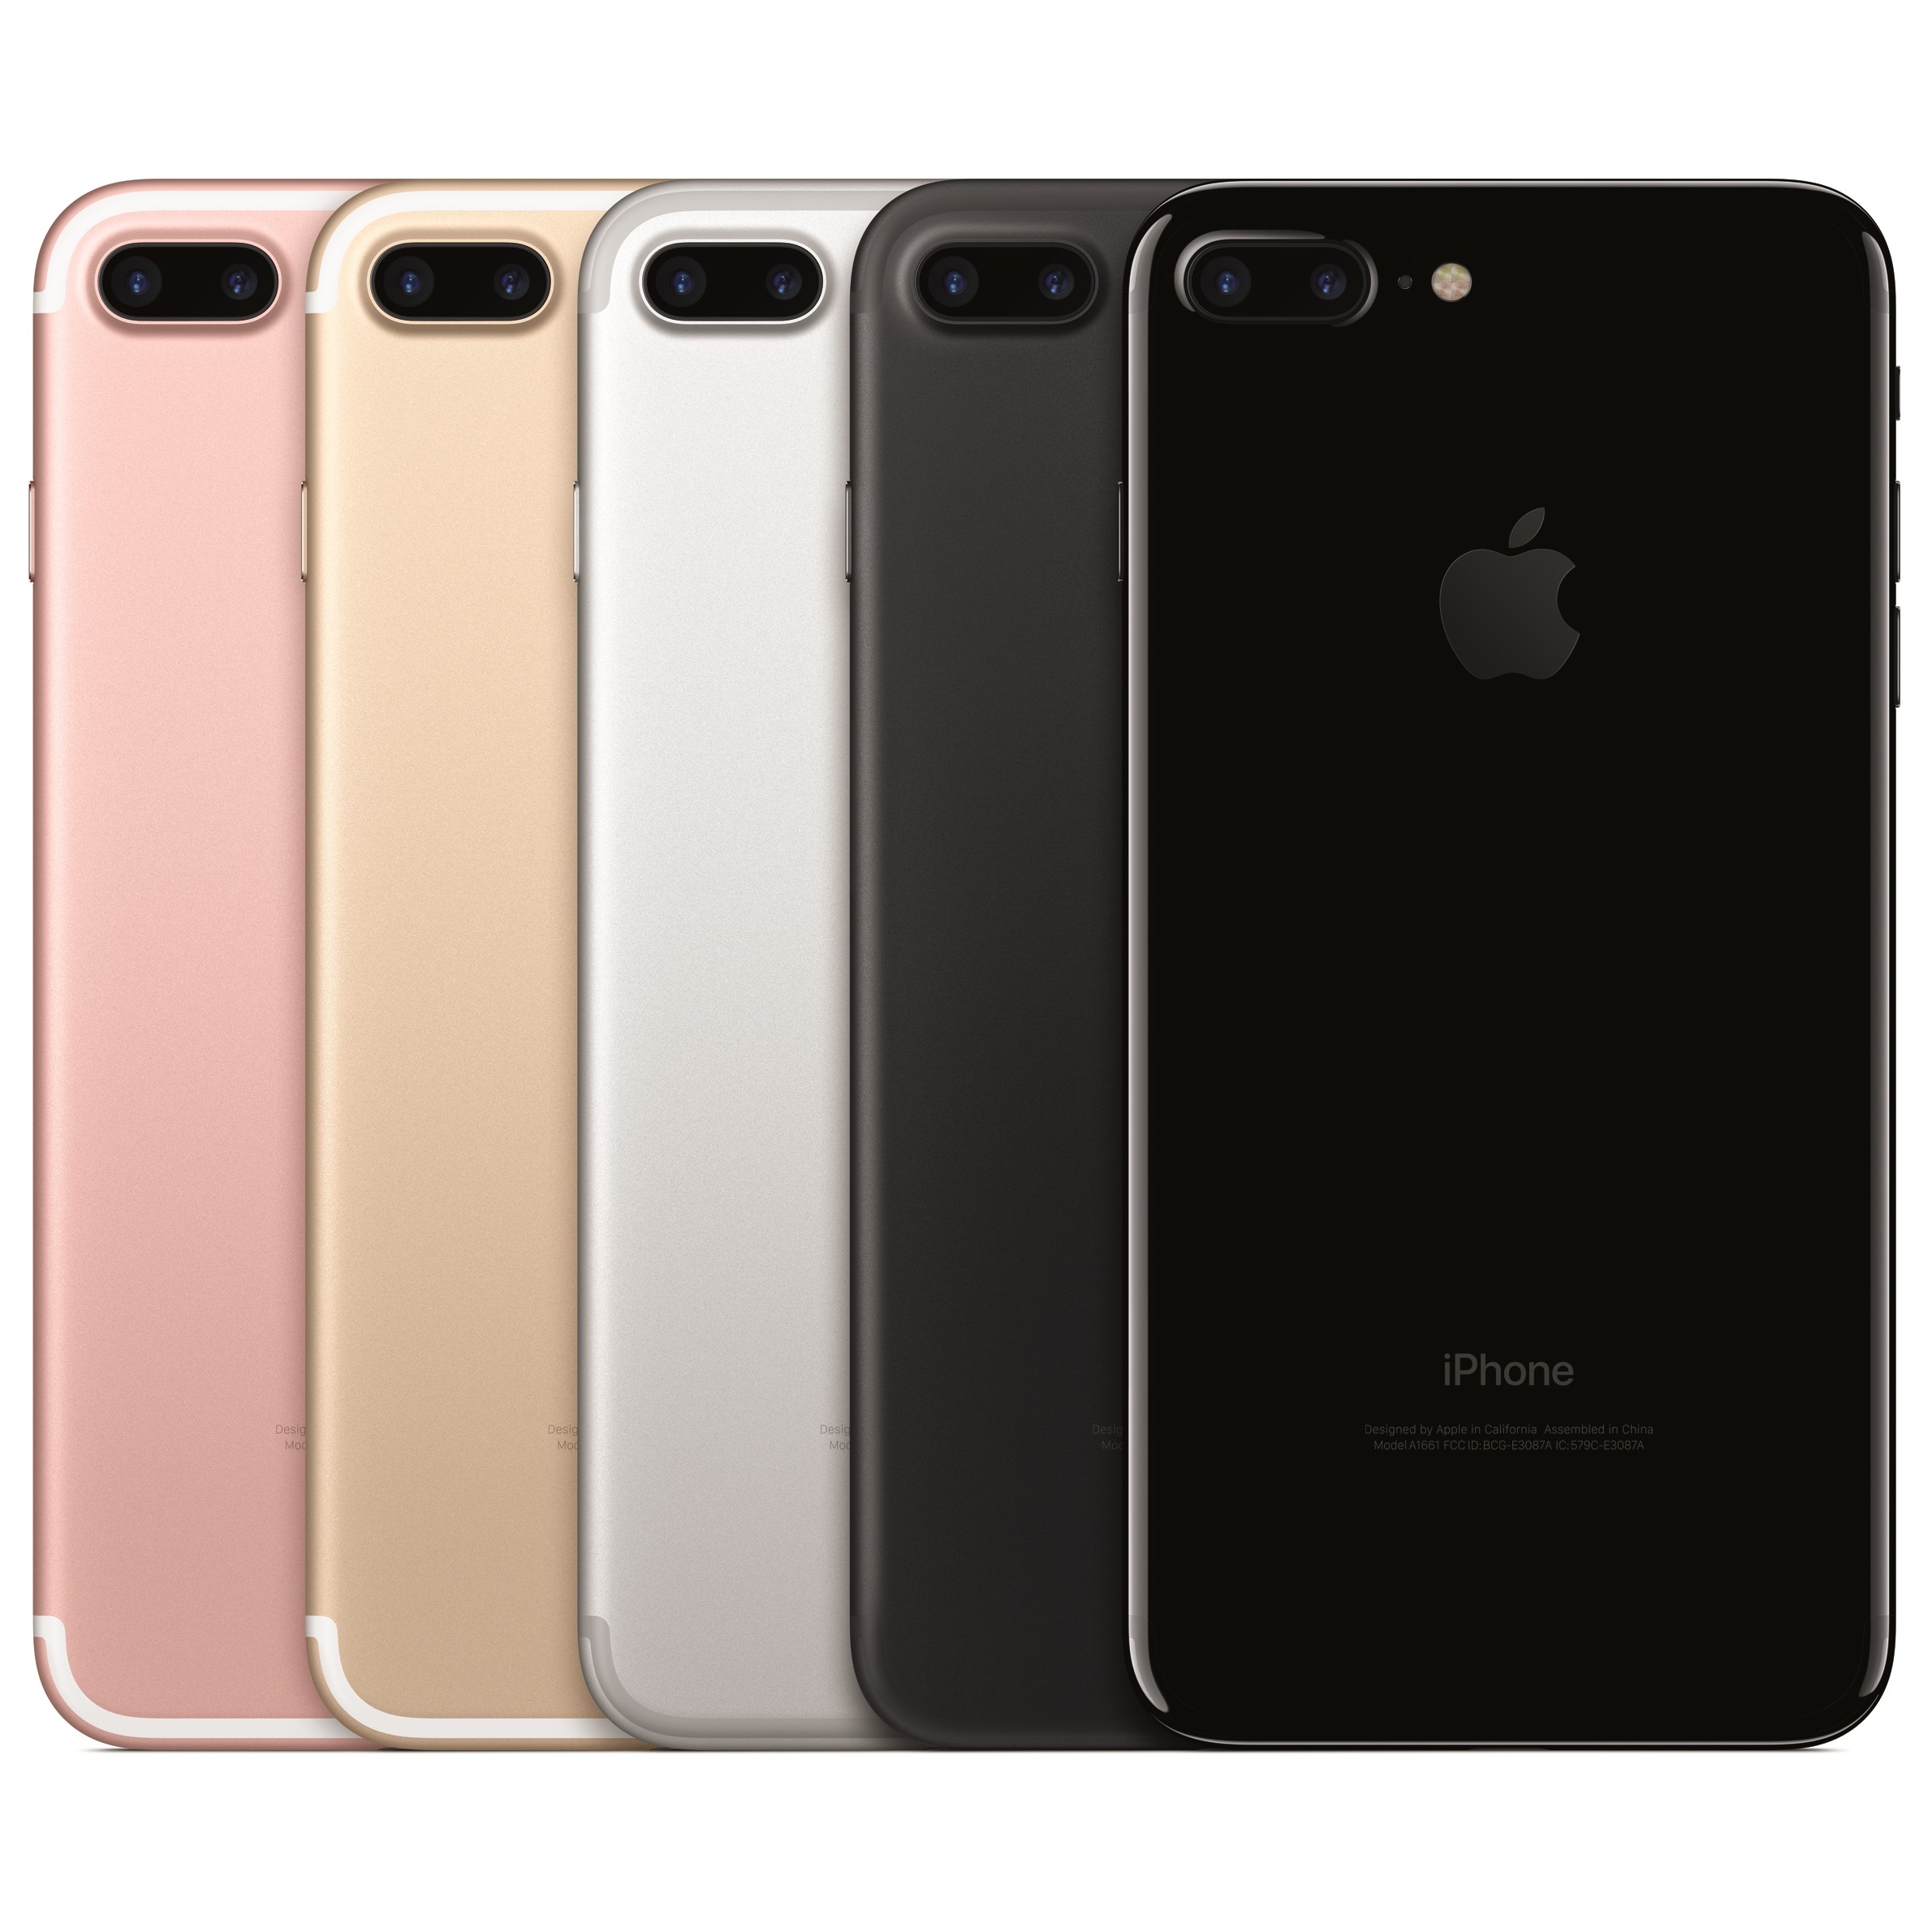
[cnxvideo id=”625445″ placement=”ros”]In its latest ranking of tablet devices, J.D. Power is sure to rankle enthusiasts of the Apple Inc. (NASDAQ: AAPL) iPad. Microsoft Corp.’s (NASDAQ: MSFT) Surface took the top spot in the firm’s 2017 U.S. Tablet Satisfaction Survey released Thursday, but is the Surface really a tablet?
That pretty much depends on whom you ask. AppleInsider, for example, points out the Microsoft itself compares its Surface Pro 4 to Apple’s MacBooks, not to the iPad. An iPad Pro typically costs less than a Surface Pro and, AppleInsider has argued, the performance of the iPad is better on the entry-level devices.
Countering that position, International Data Corp. (IDC) looks at the Surface and the iPad as different devices aimed at the same market. IDC vice-president Ryan Reith said in February:
Typical tablets without a dedicated keyboard, which IDC refers to as slate tablets, are continuing to lose relevancy across all regions and, as a result, we see the decline happening globally. We do see future growth in some emerging markets like the Middle East & Africa as well as Central & Eastern Europe with the sole catalysts being simplicity and low cost. Unfortunately for the industry these are the devices that don’t equate to large revenues.
[nativounit]
J.D. Power vice-president of service industries noted in Thursday’s announcement:
The Microsoft Surface platform has expanded what tablets can do, and it sets the bar for customer satisfaction. These tablet devices are just as capable as many laptops, yet they can still function as standard tablets. This versatility is central to their appeal and success.
Some key findings of J.D. Power’s 2017 survey:
- Satisfaction is rising: Overall customer satisfaction with tablet devices is 841, an increase of 21 index points from the 2016 U.S. Tablet Satisfaction Study—Volume 2, released six months ago.
- Driving the selection process: Lower price and past experience are the most commonly cited reasons for tablet selection among customers (22% each). Reputation is next at 19%.
- Size matters: The average screen diagonal among Microsoft customers is highest, at 11.8 inches. Satisfaction is 869 among customers whose screen diagonal is 10 inches or more vs. 850 among those whose screen diagonal is 8-10 inches and 824 among those whose screen diagonal is less than 8 inches.
- Data plans increase satisfaction: Nearly one-third (32%) of customers have a data plan with their tablet. Overall satisfaction among customers with a data plan is 863 vs. 834 among those without such a plan.
The survey included tablet devices from seven manufacturers, and the average score was 841 out of a possible 1,000 points. Here’s how the seven device makers ranked with their overall score:
- Microsoft: 855
- Apple: 849
- Samsung: 847
- LG: 836
- Amazon: 834
- Acer: 814
- Asus: 812
J.D. Power’s U.S. Tablet Satisfaction Study, now in its sixth year, measures customer satisfaction with tablets across five factors (in order of importance): performance (28%), ease of operation (22%), features (22%), styling and design (17%) and cost (11%). The 2017 study is based on experiences evaluated by 2,238 tablet owners who have owned their current device for less than one year. The study was fielded between October and December 2016.
[wallst_email_signup]