NVIDIA (Nasdaq: NVDA | NVDA Price Prediction) is up 165% across the past year, which is an absolutely incredible performance. Yet, it might surprise you to learn that NVIDIA has gotten much cheaper over the past year. That is to say, ratios like its P/E multiple have actually been dropping as its stock surged!
Generally, stocks growing at extreme rates see their P/E multiple rise as optimism about their future rises. Let’s look at some surprising charts that show how NVIDIA has become cheaper, and then look at why this is the case.
NVIDIA’s Earnings Multiples Have Been Dropping as Profits Exploded
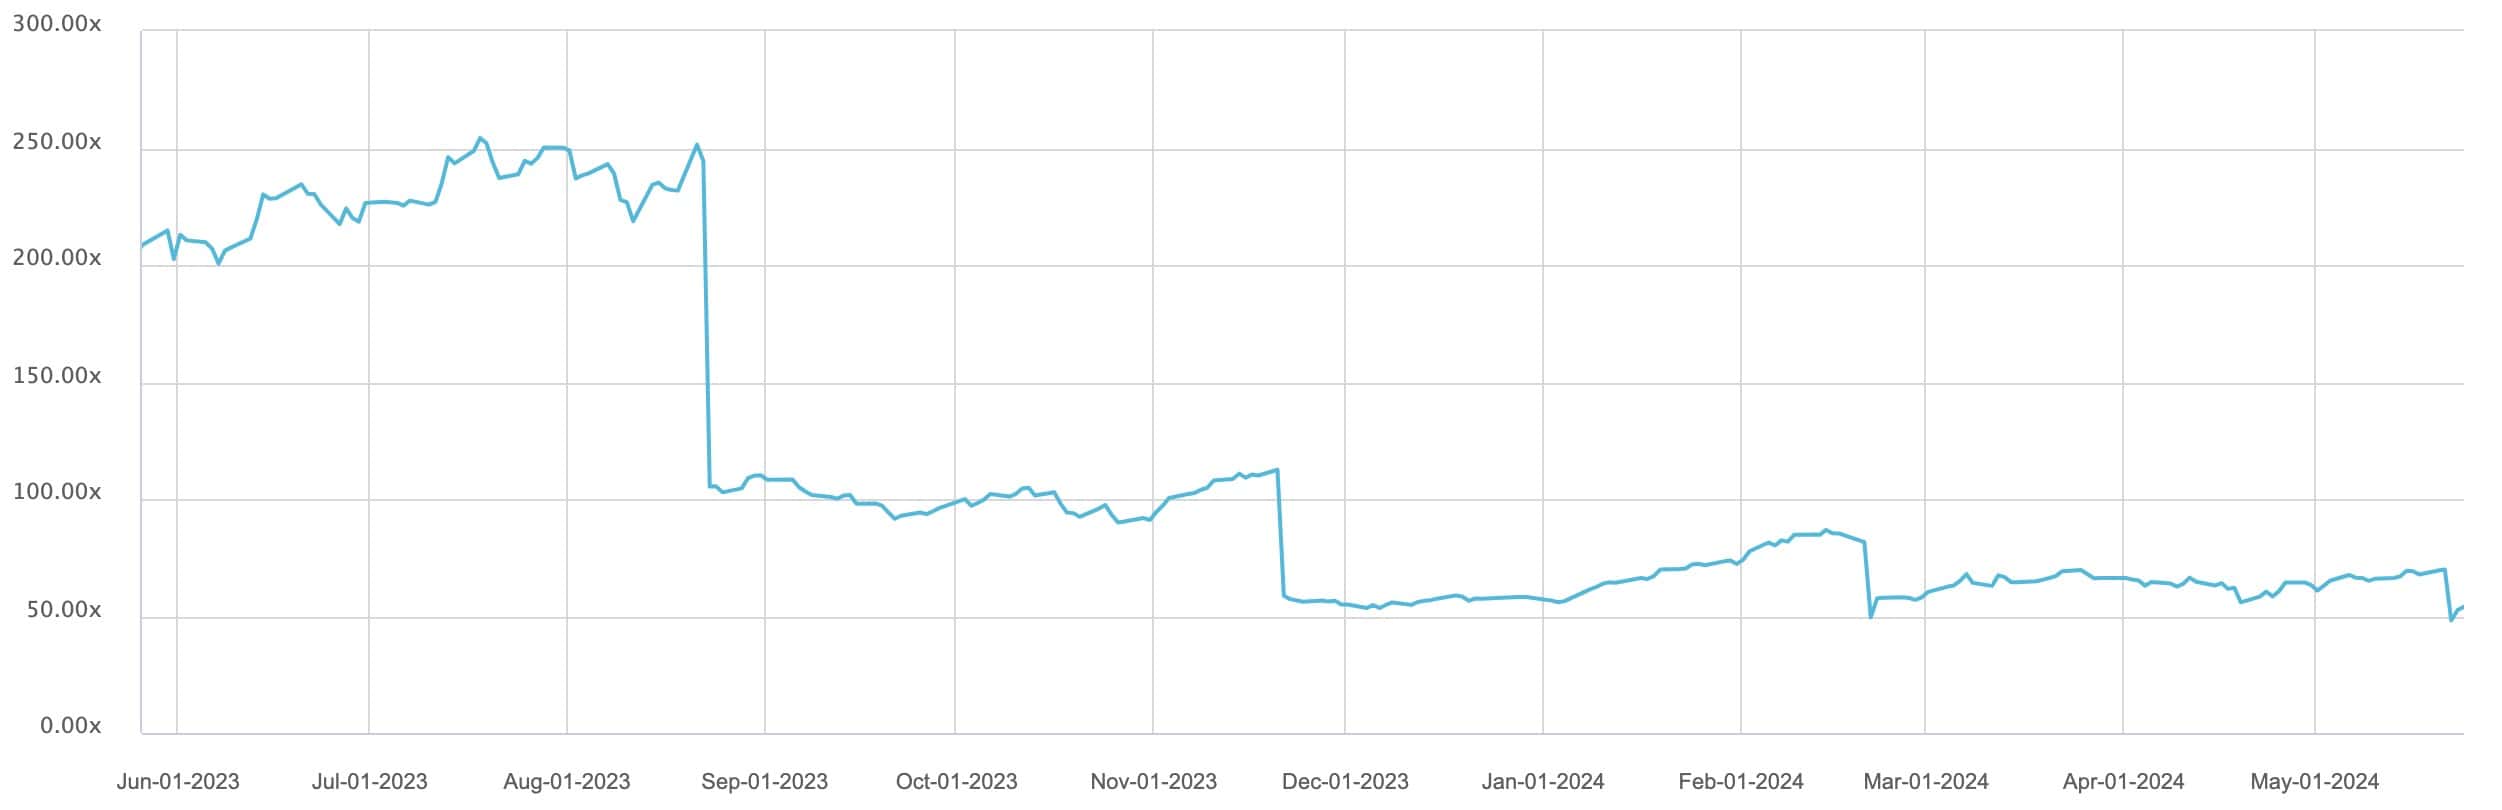
The chart above is compliments of S&P Capital IQ, a division of Standard & Poor’s. It shows how NVIDIA’s P/E ratio has collapsed throughout the past year. The actual ratio here is NVIDIA’s market cap divided by its EBT (earnings before taxes).
Last May NVIDIA was trading for slightly more than 200 times its earnings before taxes! Each sudden drop coincides with the company reporting earnings. Their earnings growth is so massive that each time NVIDIA reports, the multiple falls dramatically.
NVIDIA’s Valuation Relative to Forward Earnings Is Rising
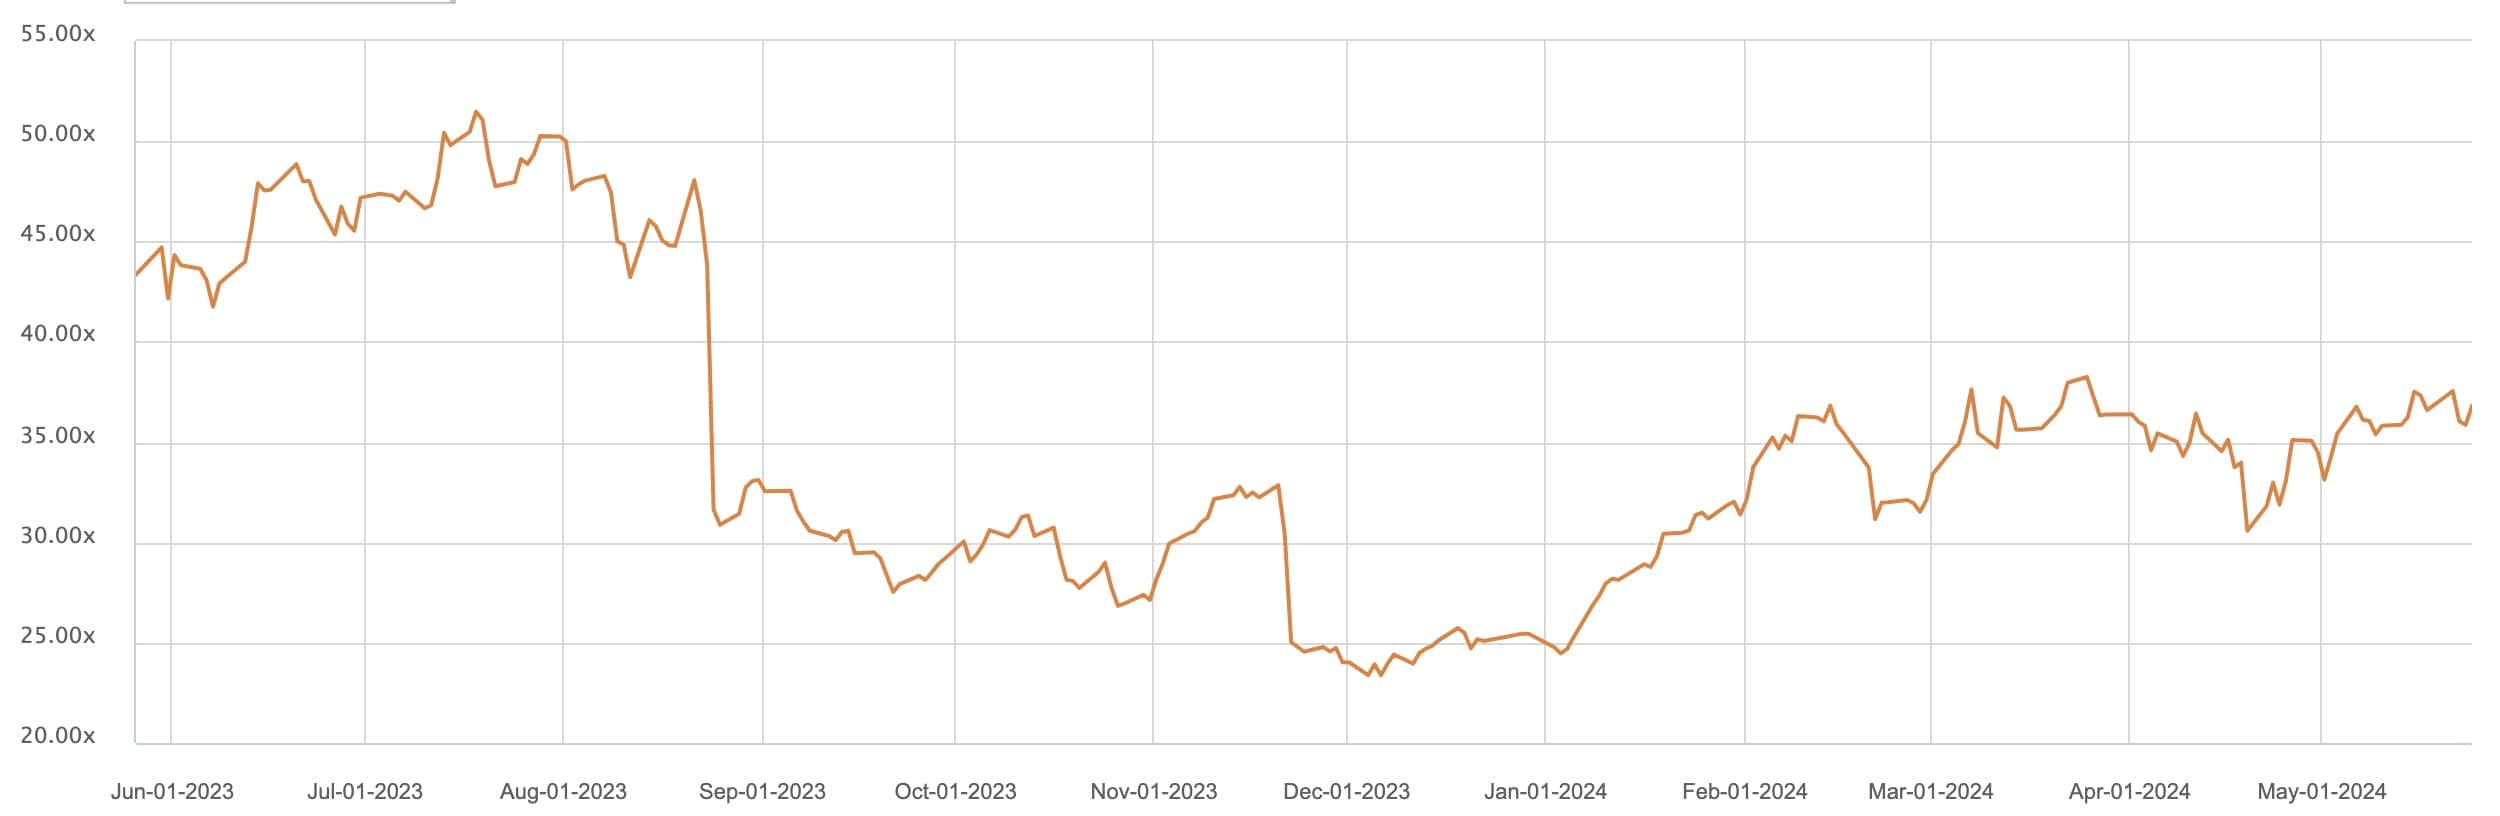
This chart provides a slightly different look at NVIDIA. It’s a measure of forward P/E. Which is to say, what is NVIDIA’s market cap relative to what Wall Street believes the company will earn in the year ahead?
As you can see, NVIDIA’s forward earnings have risen from about 25X at the start of the year to 37X today.
Why is this the case? Partially, this chart shows that confidence in NVIDIA’s ability to perform in the future is rising. At the start of the year, there was still significant doubt that NVIDIA could continue delivering strong growth as its year-over-year comparisons (frequently called comps) got tougher. However, as NVIDIA has delivered in two straight quarterly reports to start 2024, confidence in the company’s ability to continue growing has risen.
Why Is NVIDIA Getting Cheaper?
These two charts illustrate what’s going on with NVIDIA’s stock. First, a look at the company’s profit growth rate in recent quarters is eye-popping.
| Quarter | January 2023 | April 2023 | July 2023 | October 2023 | January 2024 | April 2024 |
| NVIDIA Revenue Growth (From Prior Year) | -21% | -13% | 102% | 206% | 265% | 262% |
| NVIDIA Profit Growth (From Prior Year) | -53% | 26% | 843% | 1,259% | 769% | 628% |
As you can see, when NVIDIA was trading for more than 200 times trailing earnings before profits, it had just finished a quarter where revenue dropped 21% and profits dropped 53%. Yet, at the time, it was clear that the future was about to become much brighter.
Yet, while NVIDIA’s backward-looking multiples have been dropping across the past year, its forward-looking multiples have been growing since the beginning of the year as investors have become more confident that NVIDIA can continue growing for years to come.
Overall, at today’s forward earnings multiple of about 37X, NVIDIA isn’t trading at a substantially different rate than big tech peers. Let’s end this chart analysis with a comparison of NVIDIA to Microsoft and Amazon’s forward earnings.
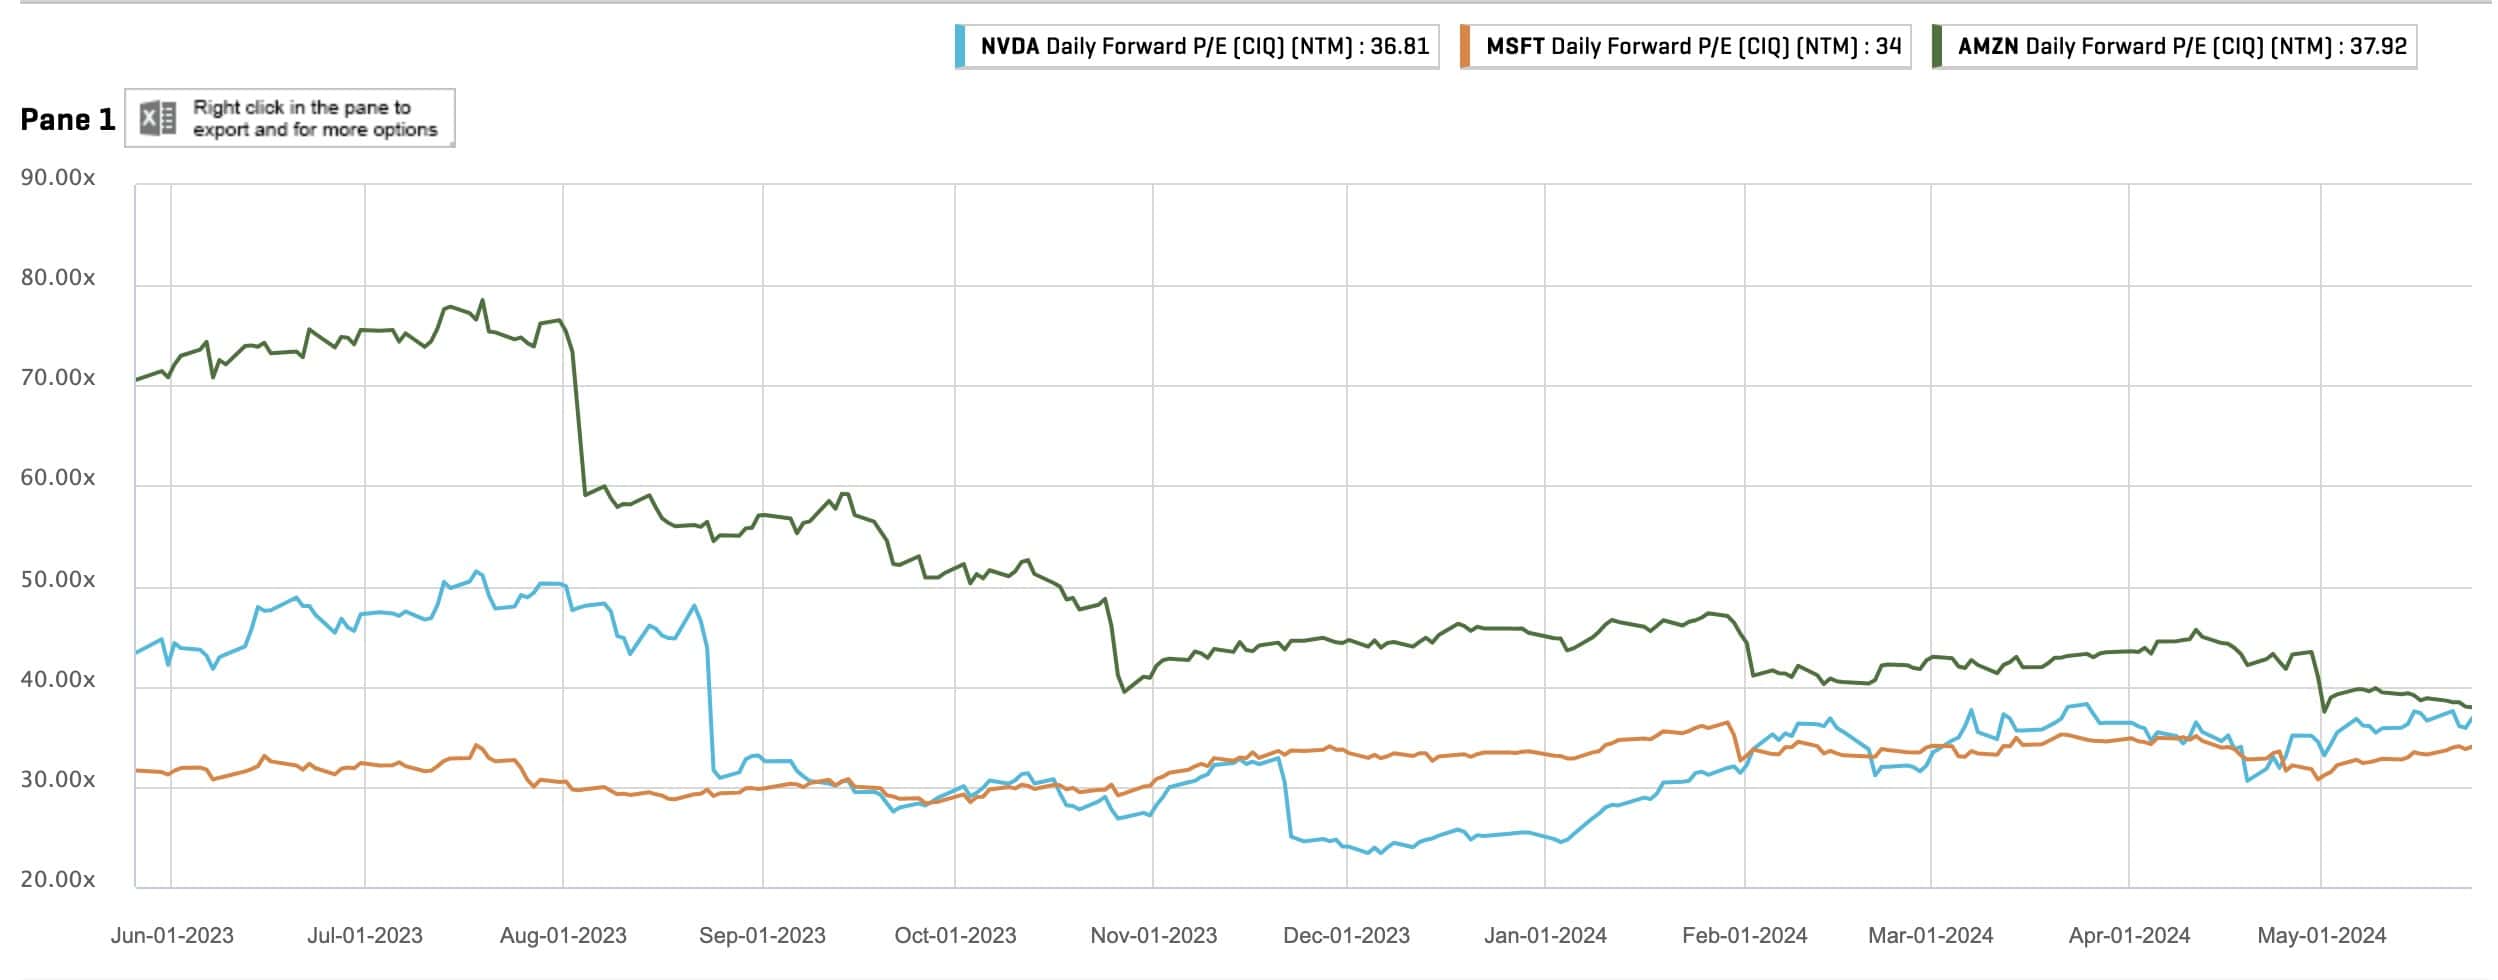
Microsoft (orange), Amazon (green), and NVIDIA (blue) now trade for almost the same forward earnings multiple.
NVIDIA is expected to grow earnings by 29% next fiscal year while those growth rates are 13% for Microsoft and 28% for Amazon. The point is: NVIDIA has long traded for a premium relative to other big tech peers. However, after a year of incredible earnings growth, its multiples are now the same as other technology stocks riding growth from the AI boom.