

General Motors Co. (NYSE: GM) reported sales of 56,380 Silverado pickups in the month of July, up a whopping 33.9% compared with sales of 42, 097 in July of 2014. Silverado sales year to date are up 17.5% to 332,202 units sold. The virtual twin GMC Sierra posted a year-over-year July sales jump of 13.3% to 19,808 units. Year to date, Sierra sales are up 9%. Combined sales of 76,188 total about 10,000 more than you-know-who’s sales.
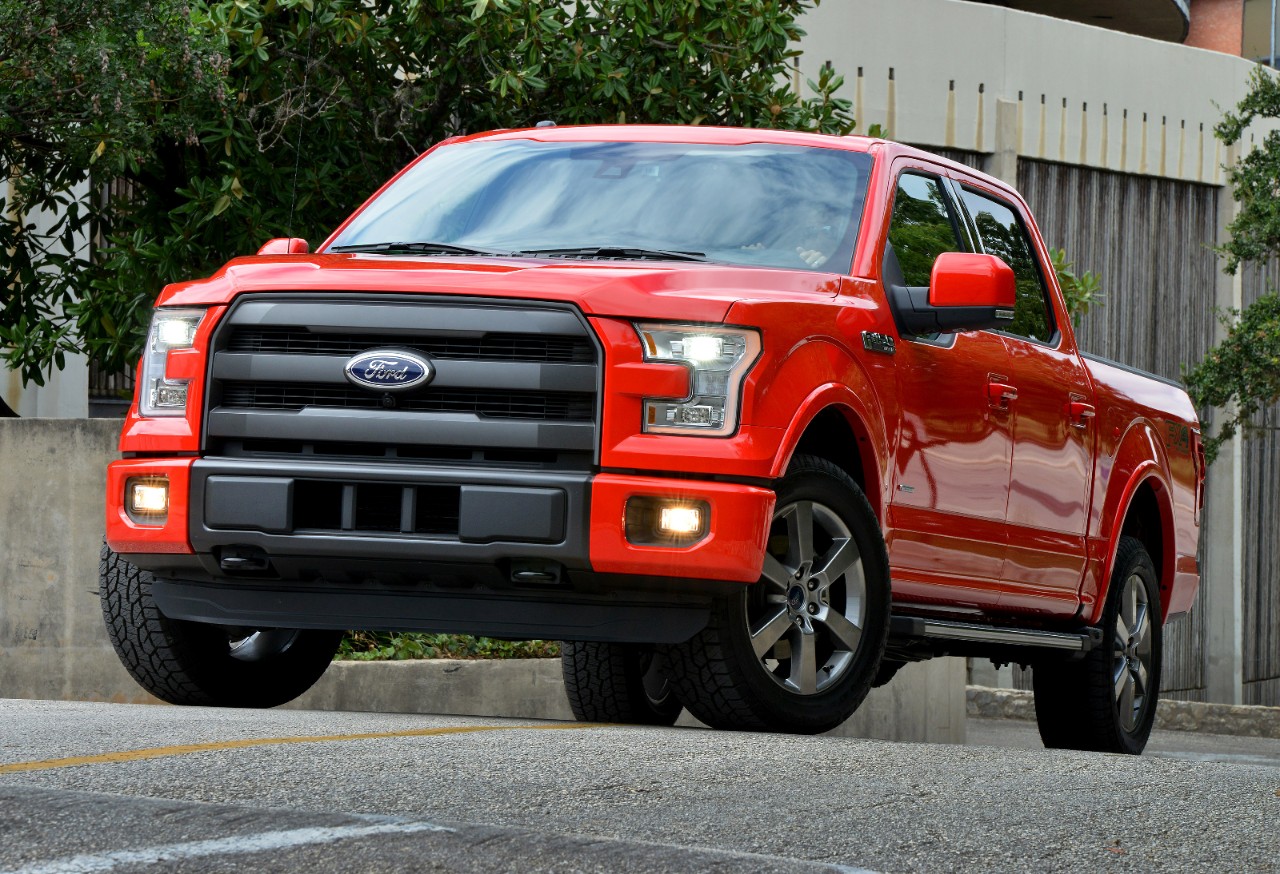
Ford Motor Co. (NYSE: F) reported that July sales of its F-Series pickup rose 4.8% year over year to 66,288 units sold. The company did not break out sales of its all-new F-150. The company continues to ramp up production of the F-150 and expects to reach what a company spokesman called “normalized” levels by the end of the third quarter. What that probably means is that Ford will be able meet dealer demand for inventory, but it surely means whatever Ford says it means.
The Ram pickups from Fiat Chrysler Automobiles N.V. (NYSE: FCAU) posted sales of 38,157 units in July, up just 1% compared with July of 2014. Chrysler said this was the truck’s best July sales level in 10 years.
ALSO READ: 7 Car Brands That Cost Less Than They Used To
Full-size pickup sales continue to rise in the United States and probably will continue to do so until gasoline prices increase by $0.75 to $1.00 a gallon from current levels. That day could be a long ways off though. In the meantime, carmakers are making some serious money on the big pickups. According to Kelley Blue Book (KBB), the average price for a full-size pickup rose 4.8% year over year in July to $45,735. That is about $20,000 more than a midsize car, $25,000 more than a compact and nearly $29,000 more than a subcompact. In other words, a consumer could buy two average-priced cars for what one pickup costs.
Ford said its transaction price for the F-Series trucks rose $3,200 year over year in July. According to KBB, Ford’s average transaction price on all vehicles sold in July was $35,776, up 3% (about $1,035). The company may not be selling as many trucks as it once was, but it is commanding a huge premium for the ones it does sell. Ford’s estimated profit on each F-150 it sells has been calculated at $13,333. The company can afford to discount the sticker price by several thousand dollars and still post a handsome profit on each truck sold.
GM’s average July transaction price on all its vehicles dropped by 0.2% year over year to $37,428, according to KBB. In its sales report Monday, the company said its average transaction price rose about 1.5% year-over-year to $33,800, up about $200 compared with June and up about $530 compared with July 2014.
Based on a single model series, Ford’s F-Series is still the best-selling pickup in the United States, followed by Chevy Silverado, GMC Sierra and Ram.


