
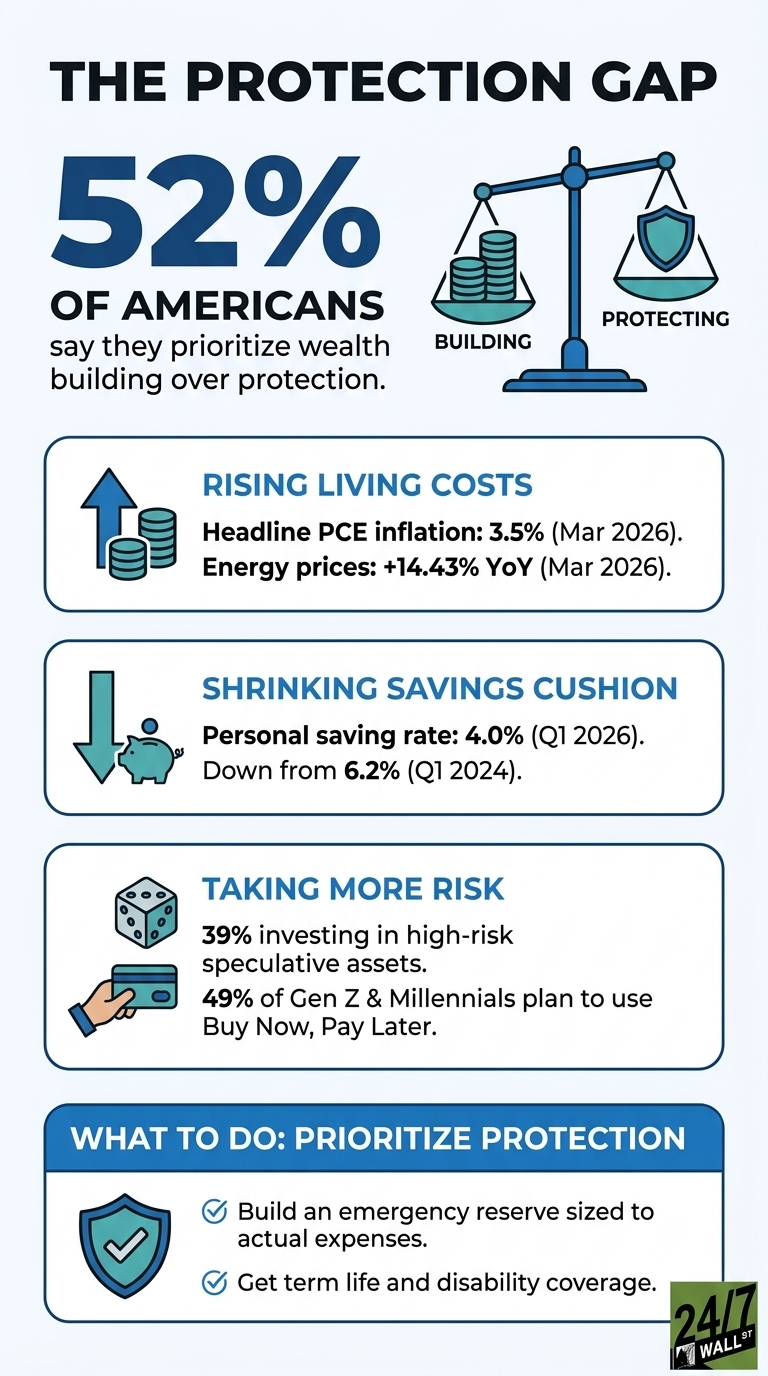
A finding from the Northwestern Mutual 2026 P&P Wave I “Financial States of America” report puts a number on a behavior that has been visible for years: 52% of Americans say they place too much emphasis on building wealth and not enough on protecting it through life insurance, disability insurance, and other risk management tools. The imbalance shows up across generations and is concentrated among younger adults, against an economic backdrop where the cost of being underprotected has been rising.
The macro setting helps frame why protection has become a sharper question. Headline PCE inflation ran at 3.5% year over year in March 2026, up from 2.36% a year earlier, with energy prices climbing 14.43%. Volatility, as measured by the CBOE Volatility Index, has eased after a recent spike to 31.05 in late March. Volatility normalizes quickly; purchasing power lost to inflation and unhedged drawdowns tends to recover slowly.
Household savings behavior is moving in the opposite direction of caution. The personal saving rate fell from 6.2% in the first quarter of 2024 to 4.0% in the first quarter of 2026, even as per capita disposable income rose to $68,617. Americans are earning more and saving a smaller share of it, leaving a thinner cushion against the volatility and inflation already visible in the data.
The Protection Gap Is Largest for Younger Generations
The protection gap is widest in the generations with the most future earnings at stake. Millennials report the largest planning gap at 62%, and the study links that shortfall to a second pattern in the data: 39% of Americans are investing in or considering high‑risk speculative assets such as prediction markets, sports betting, and cryptocurrencies. Among those pursuing these types of bets, 73% say they are doing it because they feel financially behind and believe speculation offers a faster path to their goals than traditional saving.
When Speculation and Debt Stack Up on the Same Balance Sheet
The same cohorts are also leaning on short-term consumer credit. Roughly half of Gen Z (49%) and Millennials (49%) plan to use Buy Now, Pay Later for large purchases in 2026, with 36% of Gen Z and 32% of Millennials planning to use it for daily purchases. Speculative exposure on one side of the household balance sheet and installment debt on the other side are structures that increase risk on both ends.
The Economy Is Stable. Household Behavior Is Not.
Consumer sentiment data underlines the mood behind these choices. The University of Michigan Consumer Sentiment Index sat at 53.3 in March 2026, down from 61.7 in July 2025 and within what the index defines as pessimistic territory. Unemployment at 4.3% remains in the historically healthy band, yet households are behaving as if they are running out of time to catch up.
What a Financial Advisor Actually Changes
The contrast in the report is striking: 71% of Americans who work with a financial advisor say they feel financially secure, compared with 50% of the broader population. The planning relationship typically brings together growth strategies, insurance, emergency reserves, beneficiary designations, and tax structure. The data suggest that this combination correlates strongly with people’s sense of security, regardless of how much they earn.
How Lower Rates Are Making the Problem Worse
Federal Reserve policy has eased alongside this behavioral shift. The federal funds target rate is 3.75% as of April 30, 2026, down from 4.5% a year earlier, which reduces yields on savings products and fixed‑rate insurance contracts. Lower rates increase the relative appeal of riskier assets while inflation continues to erode the value of cash. Together, these forces tilt household decisions further toward growth and away from protection.
The Number That Does Not Show Up in Your Portfolio
The 52% figure is less about what people are doing wrong and more about what gets left off the list when the focus is entirely on growth. A rising account balance is easy to track. The cost of being uninsured during a health event, unhedged during a drawdown, or without a plan when income stops is harder to quantify until it is too late to change. The households in this study that feel genuinely secure are not necessarily the wealthiest. They are the ones who decided that protecting what they have is part of the same job as building it.