24/7 Wall St. Insights
- Between accidents and traffic congestion, driving can be both dangerous and frustrating
- But the many downsides of driving are far more commonplace in certain major cities
- Also: Discover the next Nvidia
Whether they realize it or not, driving or riding in a car is the most dangerous act millions of Americans regularly engage in. Government statistics show that Americans traveling in a passenger vehicle are about 18 times more likely to have a fatal accident than those traveling by rail. Fatality rates for passenger vehicles are also 135 times higher than they are for buses, and 540 times higher than for commercial aircraft.
According to the U.S. Department of Transportation, there were over 39,200 deadly auto accidents nationwide in 2022, resulting in an estimated 42,514 fatalities. Even for the most cautious drivers, accidents — fatal or otherwise — can be unavoidable, as other motorists on the road may be distracted or impaired by drugs or alcohol. Drunk driving alone results in an average of 37 deaths every day in the United States.
While driving comes with inherent risks, most Americans will never be involved in a fatal accident. Still, driving can come with a number of other hazards and inconveniences, which, while less severe than an accident, are far more common.
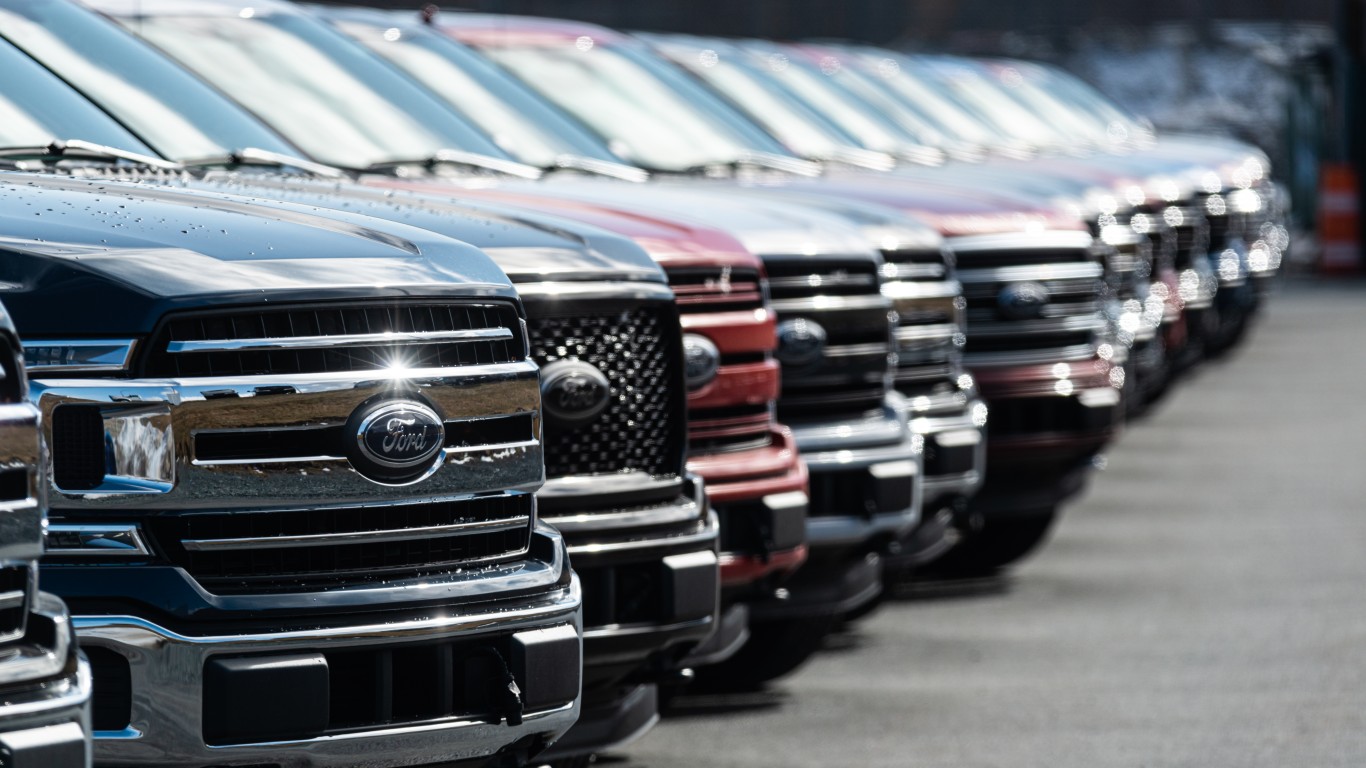
Automobiles are among the biggest investments most Americans will ever make. With the average transaction price for a new car hitting $48,644 in June 2024, vehicles are a prime target for theft — and according to the National Insurance Crime Bureau, an average of two vehicles are stolen every minute nationwide. (Here is a look at the 10 most stolen cars in the United States.)
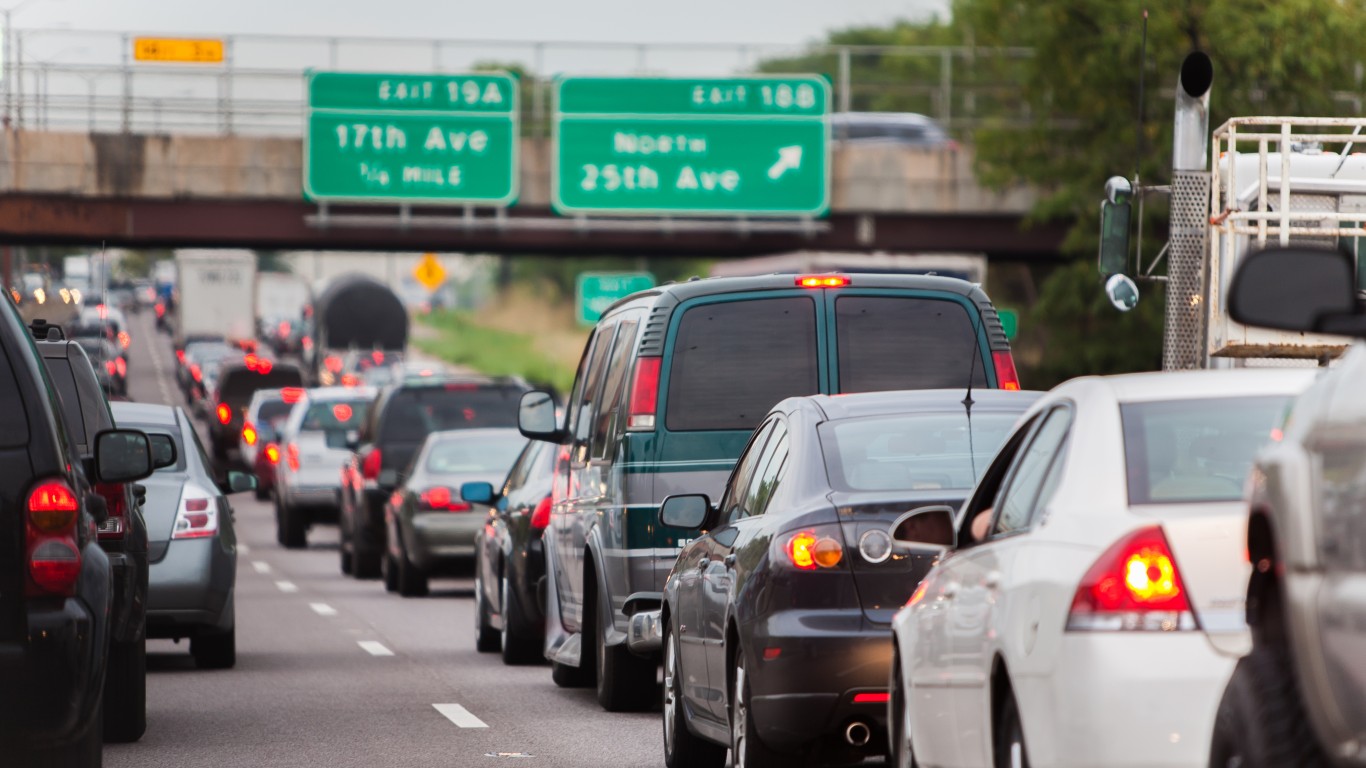
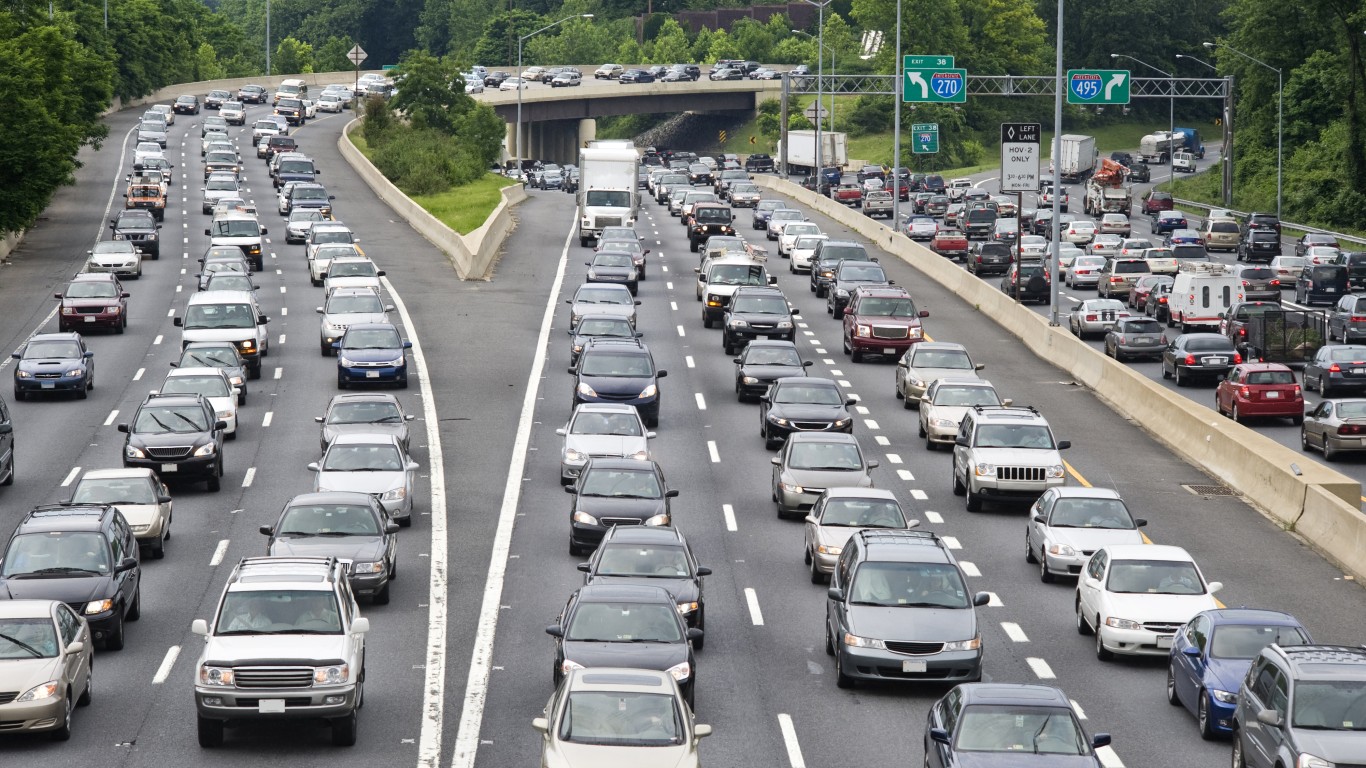
Additionally, Americans have been driving more in recent years than ever before, and more cars on the road means more congestion. A recent report from INRIX, a transportation analytics company, found that the typical American driver lost 42 hours to traffic delays in 2023.
The drawbacks and risks associated with driving are especially pronounced in certain U.S. cities. Using metro area level data from a range of sources, 24/7 Wall St. identified the worst city for drivers in every state. We ranked every major metro area within each state using an equally weighted index of four measures: the motor vehicle fatality rate, the alcohol-related roadway fatality rate, the motor vehicle theft rate, and the average commute time as a proxy for traffic delays.
Data sources include the U.S. Census Bureau’s 2022 American Community Survey, the NICB, and the 2023 County Health Rankings & Roadmaps report, a joint program of the Robert Wood Johnson Foundation and the University of Wisconsin Population Health Institute
It is important to note that four states – Delaware, New Hampshire, Rhode Island, and Vermont – have only one metropolitan area. As a result, the metro area listed in these states ranks as the worst by default only. (Here is a look at the states with the worst traffic.)
Why It Matters

Driving is the standard mode of transportation in the United States. While personal vehicles have several advantages over alternative options, the freedom and convenience motor vehicles offer also come with some significant downsides. These downsides are far more common in some parts of the country than in others.
Alabama: Mobile
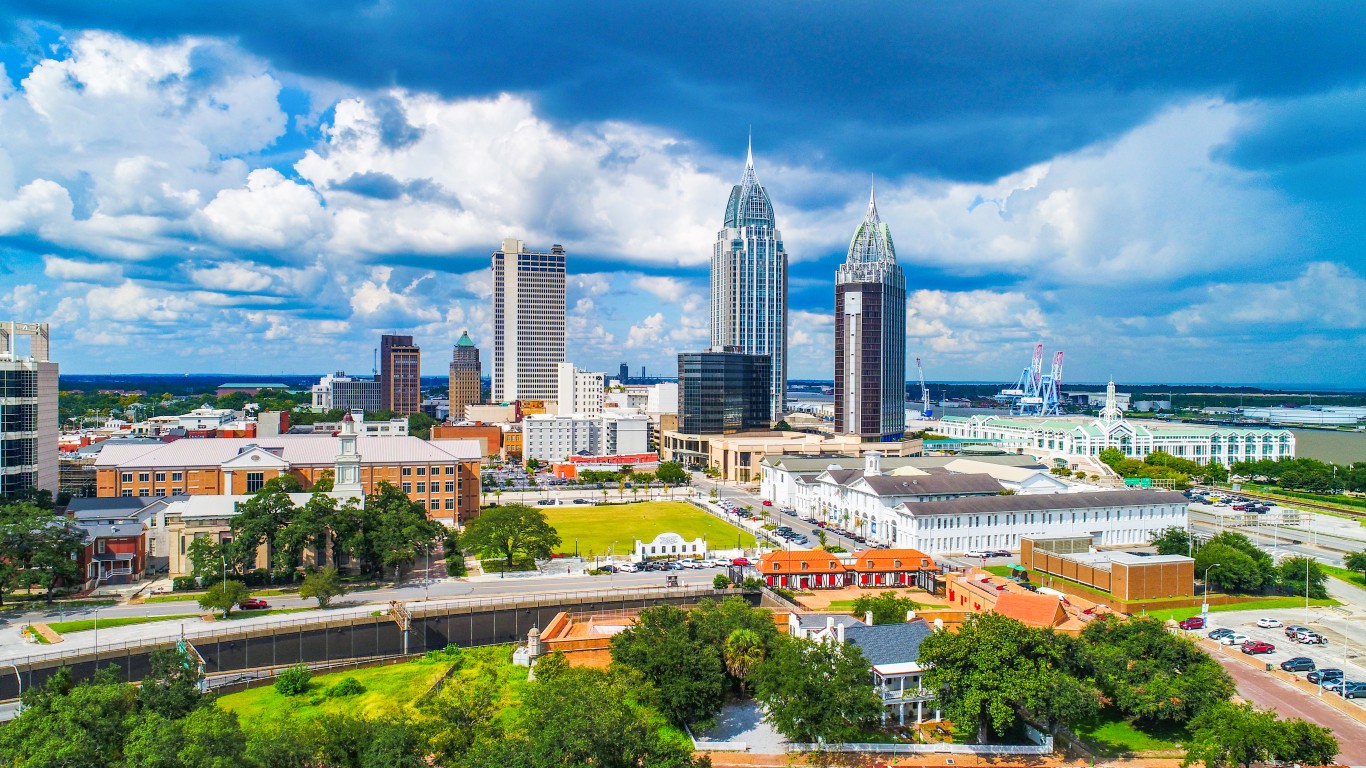
- Motor-vehicle fatality rate: 171.9 per 100,000 people 15 and older (165.9 per 100,000 statewide)
- Alcohol-related driving death rate: 36.9 per 100,000 people 15 and older (30.2 per 100,000 statewide)
- Vehicle theft rate in 2022: 270.1 per 100,000 people (209.2 per 100,000 statewide)
- Total vehicle thefts reported in 2022: 1,152 (10,616 statewide)
- Avg. commute time in 2022: : 27.1 minutes (25.4 minutes statewide)
- Metro areas considered in state: 12
Alaska: Anchorage

- Motor-vehicle fatality rate: 85.8 per 100,000 people 15 and older (90.2 per 100,000 statewide)
- Alcohol-related driving death rate: 18.8 per 100,000 people 15 and older (23.5 per 100,000 statewide)
- Vehicle theft rate in 2022: 341.6 per 100,000 people (245.6 per 100,000 statewide)
- Total vehicle thefts reported in 2022: 1,368 (1,802 statewide)
- Avg. commute time in 2022: : 23.2 minutes (19.4 minutes statewide)
- Metro areas considered in state: 2
Arizona: Flagstaff
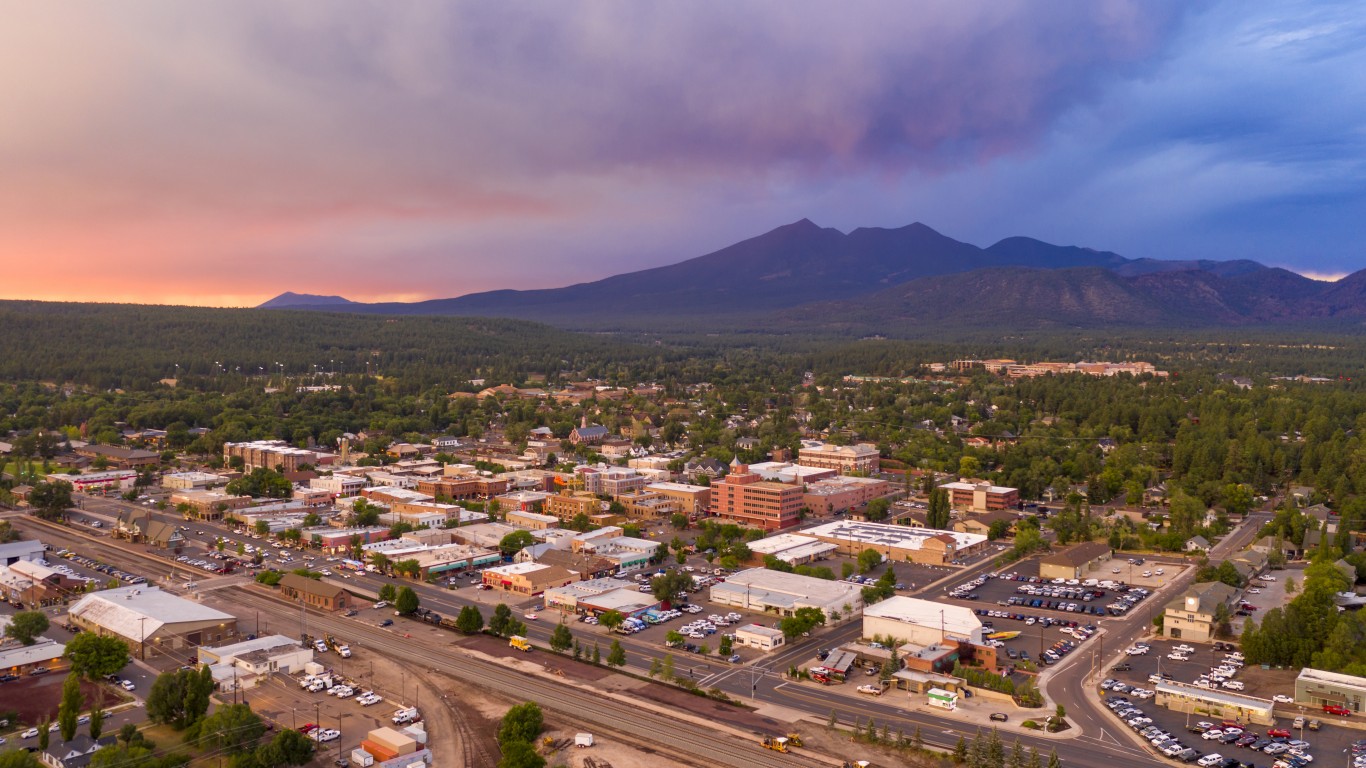
- Motor-vehicle fatality rate: 172.6 per 100,000 people 15 and older (108.1 per 100,000 statewide)
- Alcohol-related driving death rate: 44.6 per 100,000 people 15 and older (18.3 per 100,000 statewide)
- Vehicle theft rate in 2022: 124.3 per 100,000 people (294.8 per 100,000 statewide)
- Total vehicle thefts reported in 2022: 179 (21,694 statewide)
- Avg. commute time in 2022: : 19.6 minutes (24.9 minutes statewide)
- Metro areas considered in state: 7
Arkansas: Hot Springs

- Motor-vehicle fatality rate: 194.1 per 100,000 people 15 and older (160.1 per 100,000 statewide)
- Alcohol-related driving death rate: 26.0 per 100,000 people 15 and older (28.6 per 100,000 statewide)
- Vehicle theft rate in 2022: 370.7 per 100,000 people (269.8 per 100,000 statewide)
- Total vehicle thefts reported in 2022: 371 (8,216 statewide)
- Avg. commute time in 2022: : 21.9 minutes (22.4 minutes statewide)
- Metro areas considered in state: 6
California: Bakersfield
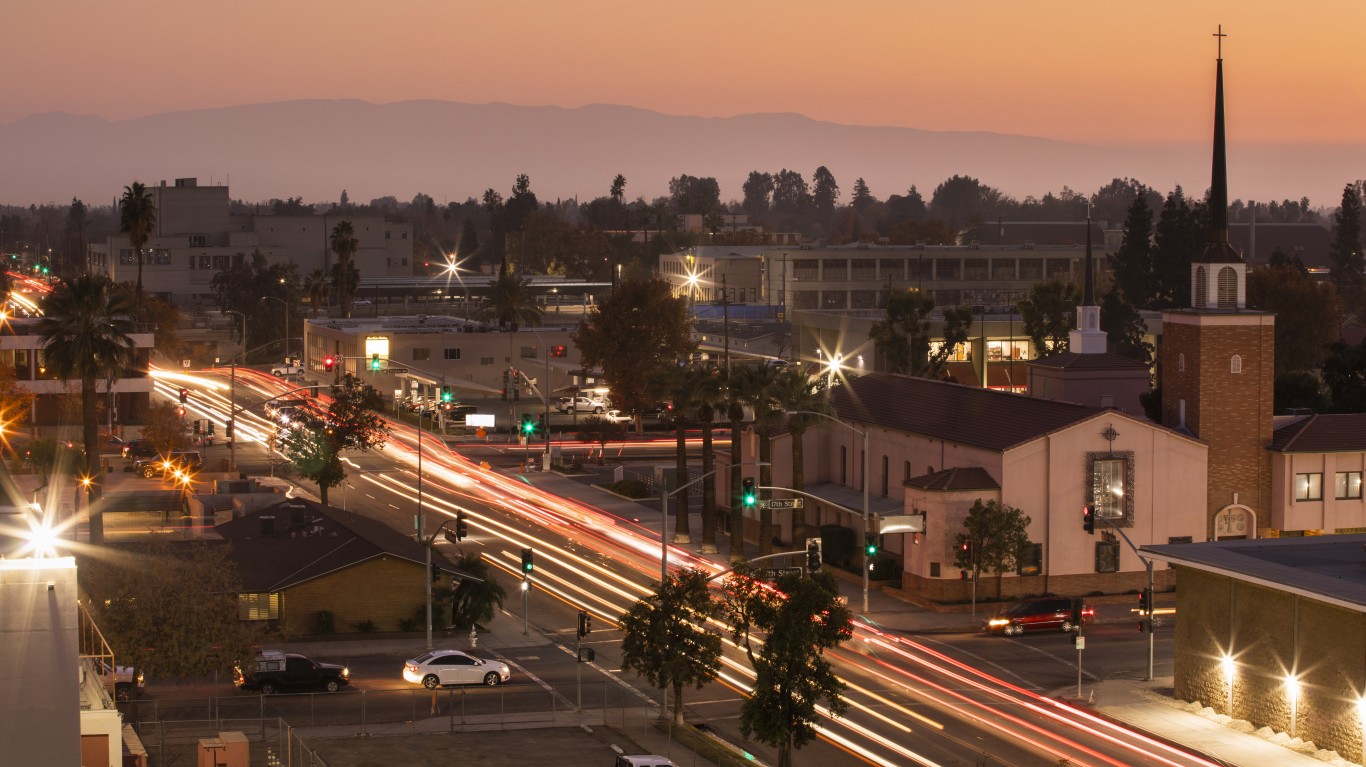
- Motor-vehicle fatality rate: 155.2 per 100,000 people 15 and older (84.8 per 100,000 statewide)
- Alcohol-related driving death rate: 37.7 per 100,000 people 15 and older (16.2 per 100,000 statewide)
- Vehicle theft rate in 2022: 1,072.4 per 100,000 people (520.2 per 100,000 statewide)
- Total vehicle thefts reported in 2022: 9,824 (203,018 statewide)
- Avg. commute time in 2022: : 24.5 minutes (28.3 minutes statewide)
- Metro areas considered in state: 26
Colorado: Pueblo
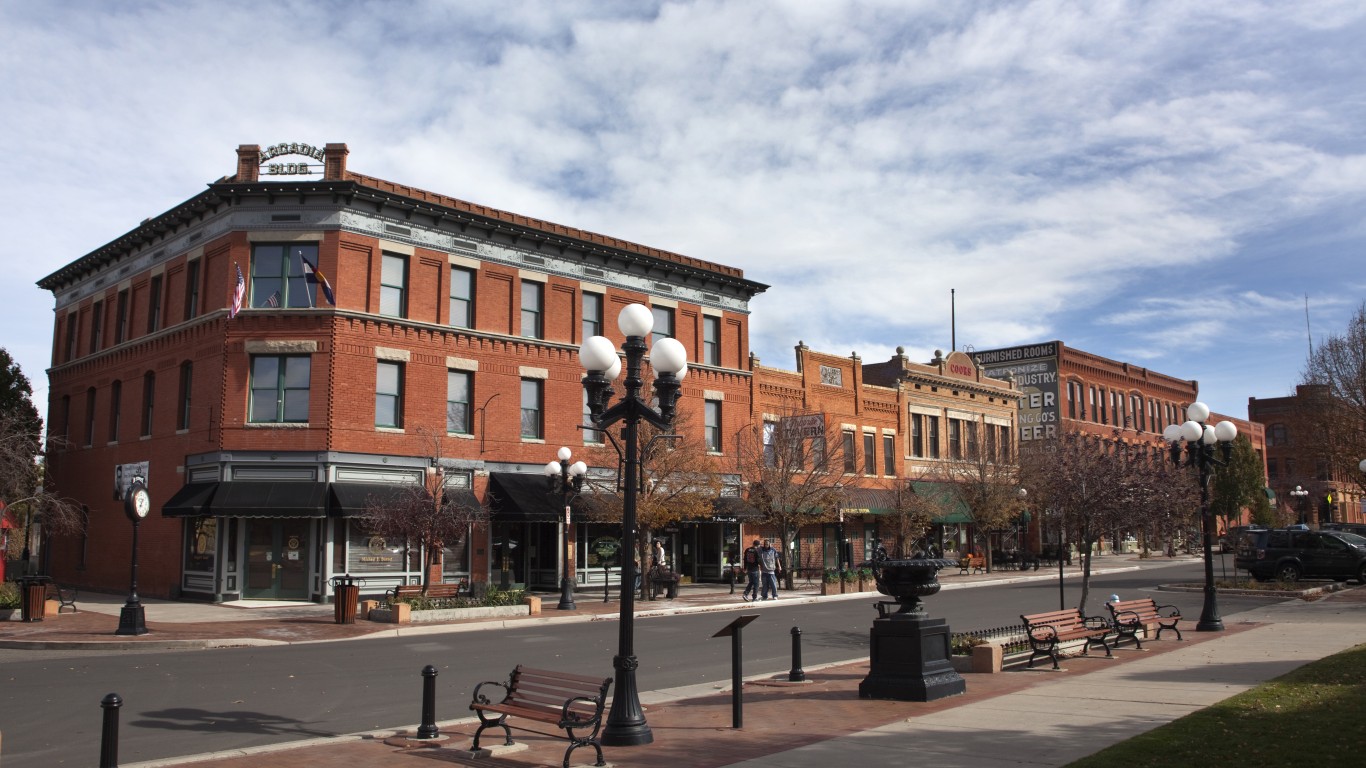
- Motor-vehicle fatality rate: 141.9 per 100,000 people 15 and older (87.8 per 100,000 statewide)
- Alcohol-related driving death rate: 33.7 per 100,000 people 15 and older (21.8 per 100,000 statewide)
- Vehicle theft rate in 2022: 1,086.4 per 100,000 people (731.3 per 100,000 statewide)
- Total vehicle thefts reported in 2022: 1,842 (42,706 statewide)
- Avg. commute time in 2022: : 24.7 minutes (25.0 minutes statewide)
- Metro areas considered in state: 7
Connecticut: New Haven-Milford
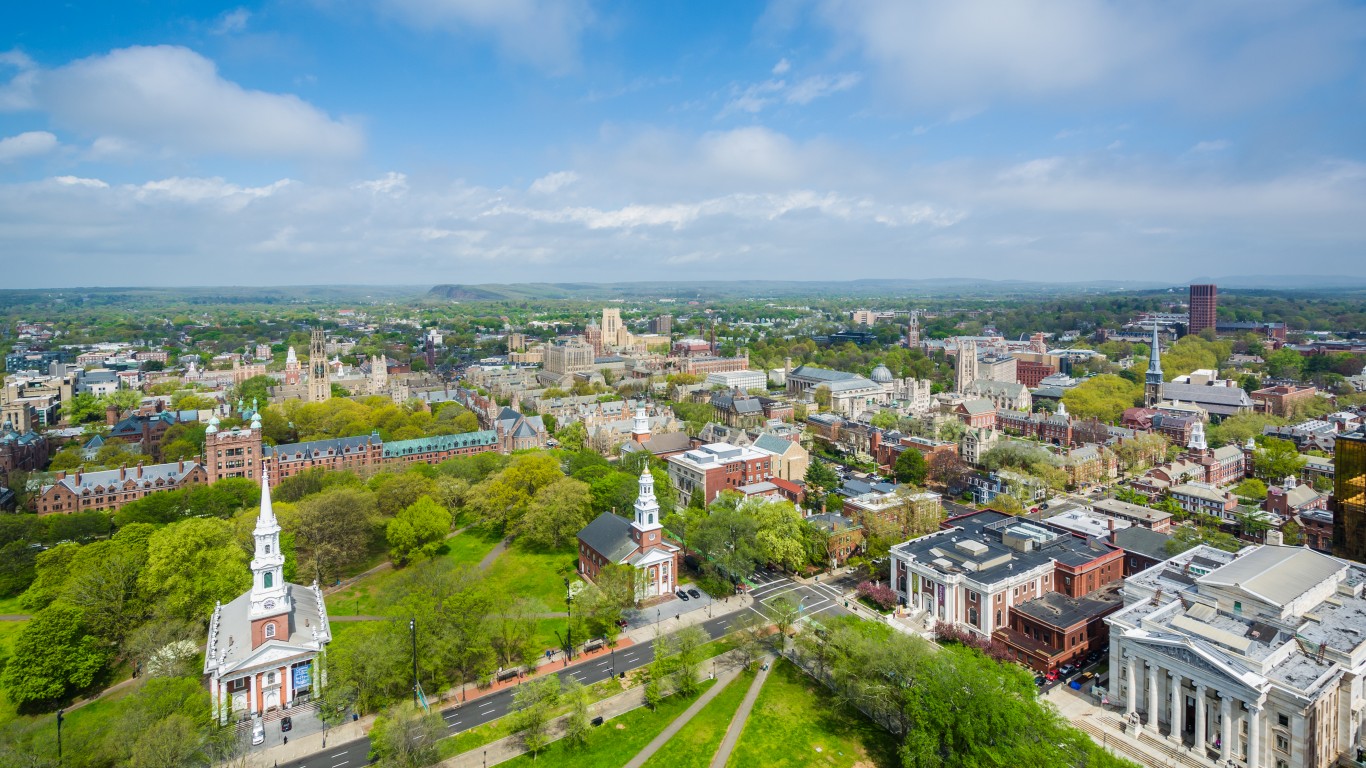
- Motor-vehicle fatality rate: 72.2 per 100,000 people 15 and older (65.5 per 100,000 statewide)
- Alcohol-related driving death rate: 14.7 per 100,000 people 15 and older (14.2 per 100,000 statewide)
- Vehicle theft rate in 2022: 315.1 per 100,000 people (195.5 per 100,000 statewide)
- Total vehicle thefts reported in 2022: 2,740 (7,091 statewide)
- Avg. commute time in 2022: : 25.9 minutes (26.8 minutes statewide)
- Metro areas considered in state: 4
Delaware: Dover
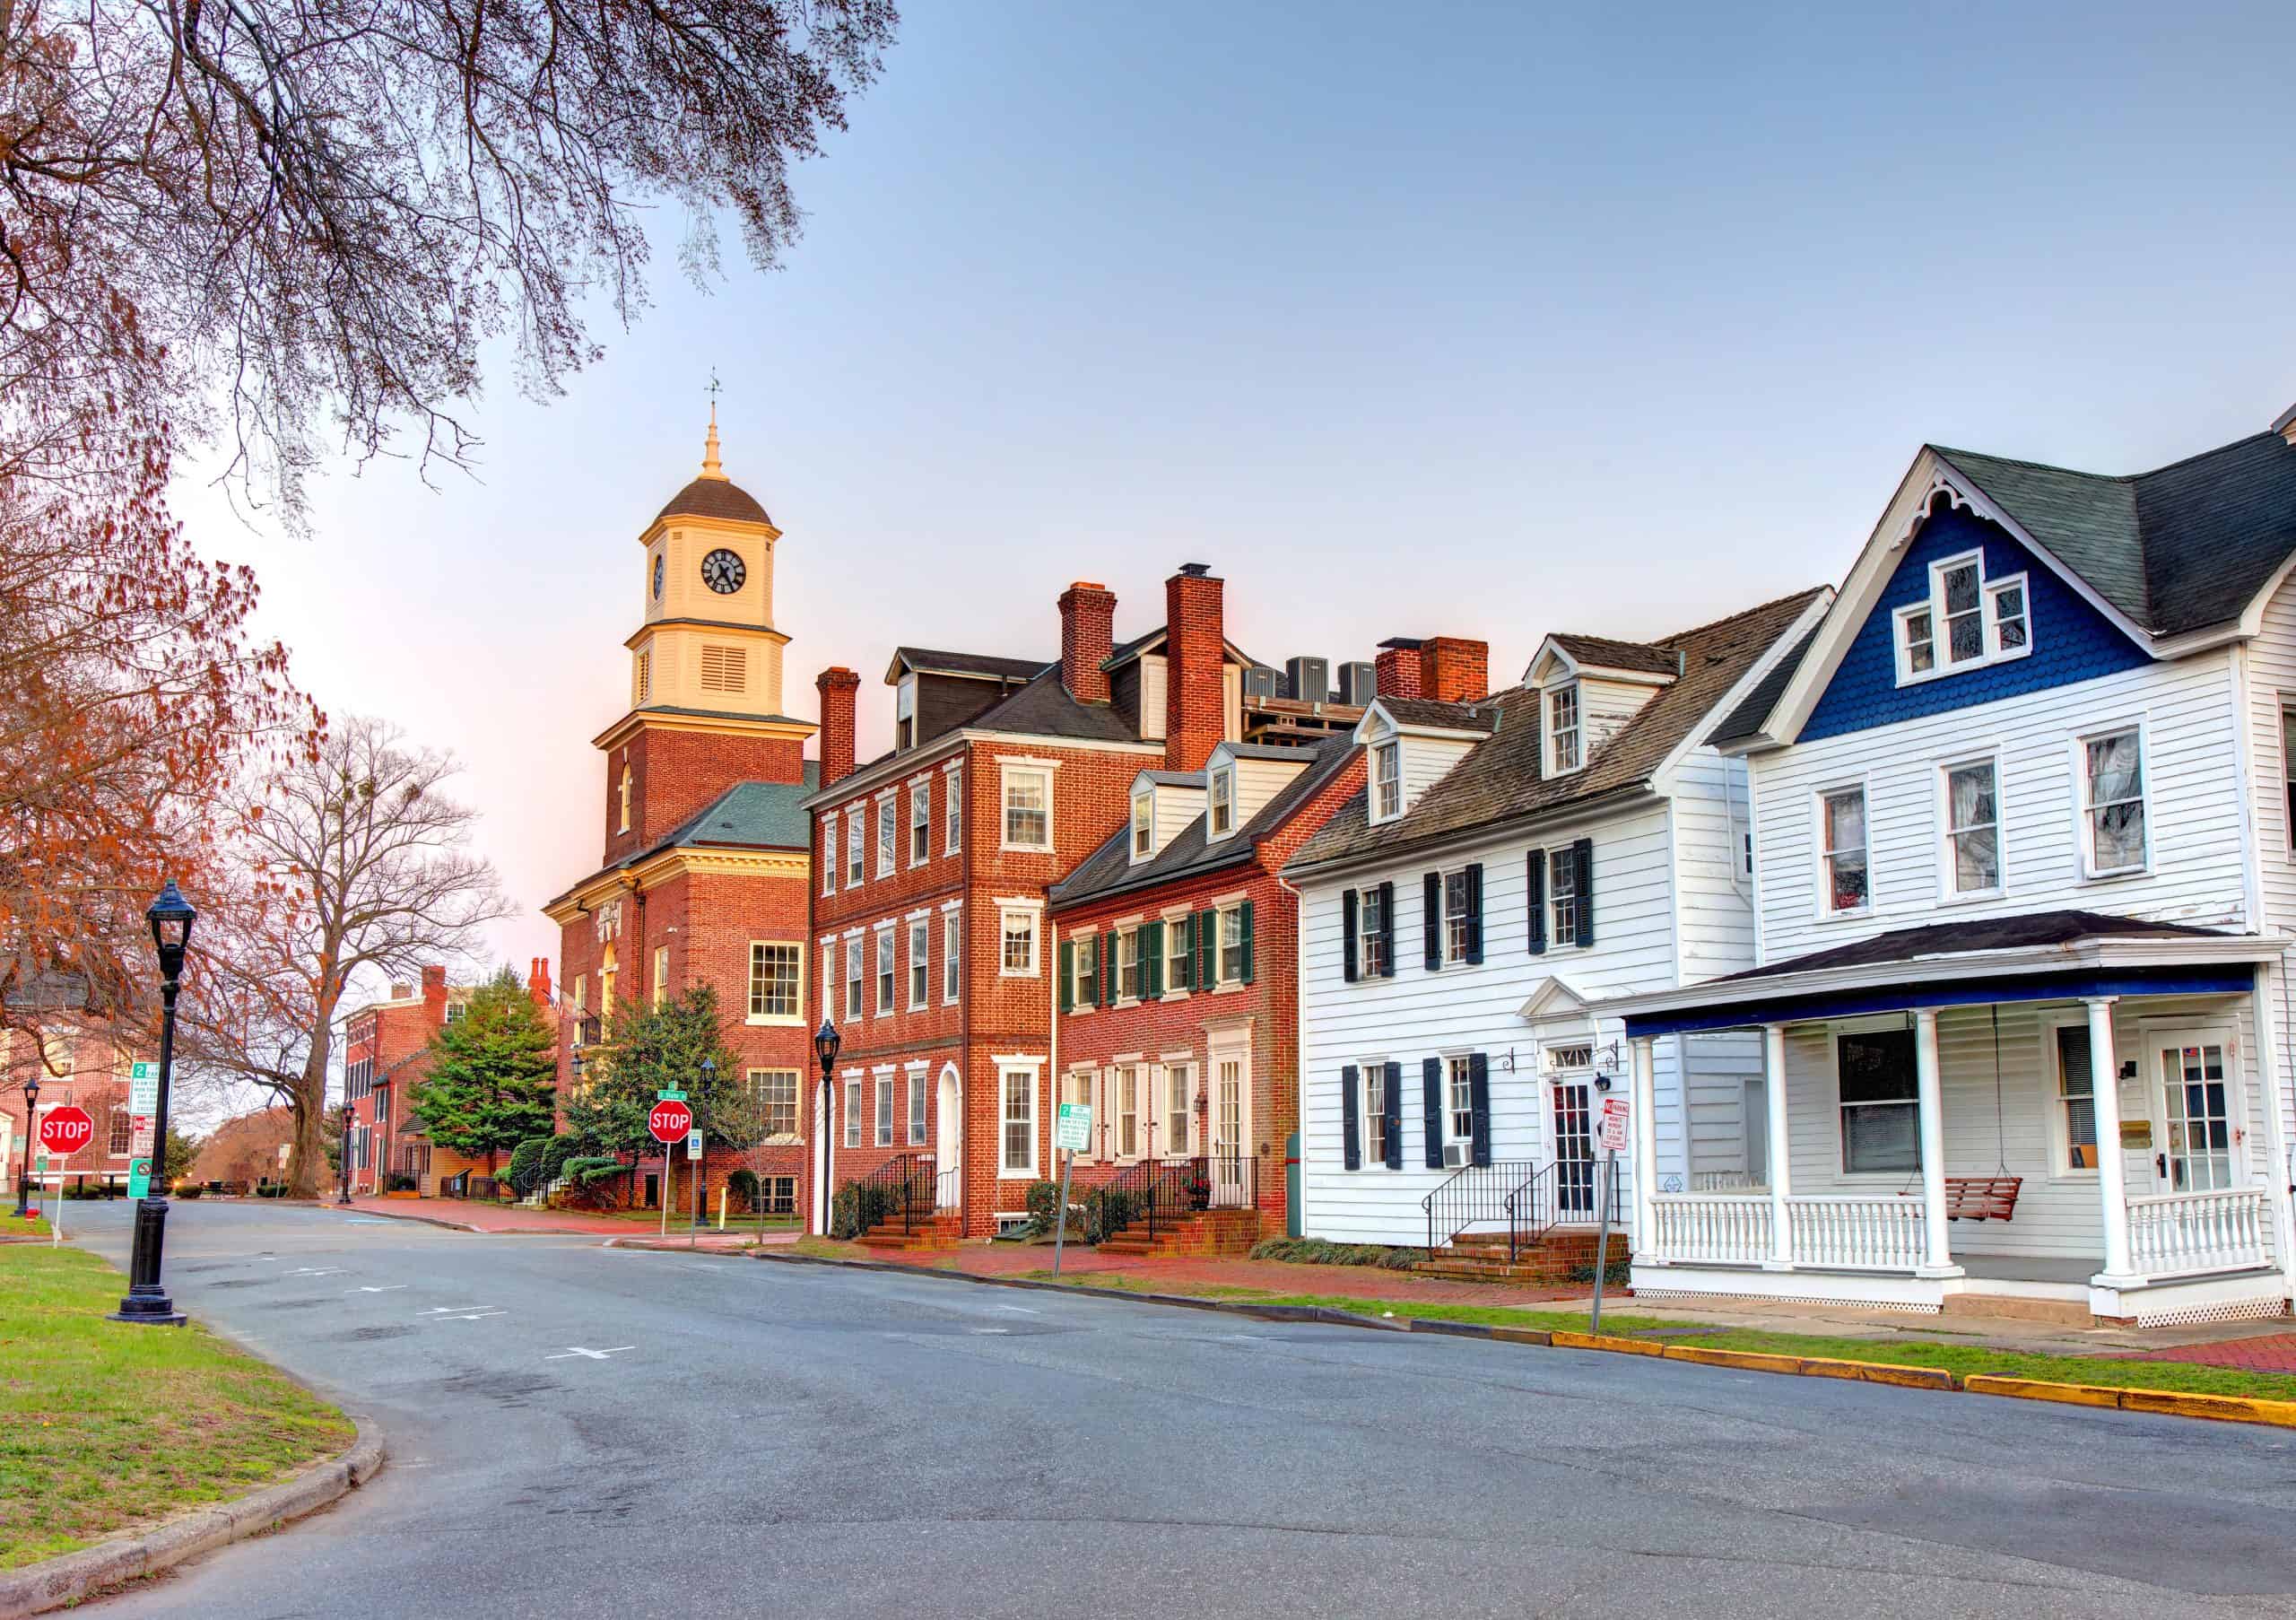
- Motor-vehicle fatality rate: 127.5 per 100,000 people 15 and older (101.1 per 100,000 statewide)
- Alcohol-related driving death rate: 21.8 per 100,000 people 15 and older (17.6 per 100,000 statewide)
- Vehicle theft rate in 2022: 214.5 per 100,000 people (184.5 per 100,000 statewide)
- Total vehicle thefts reported in 2022: 401 (1,879 statewide)
- Avg. commute time in 2022: : 27.2 minutes (26.1 minutes statewide)
- Metro areas considered in state: 1
Florida: Sebring
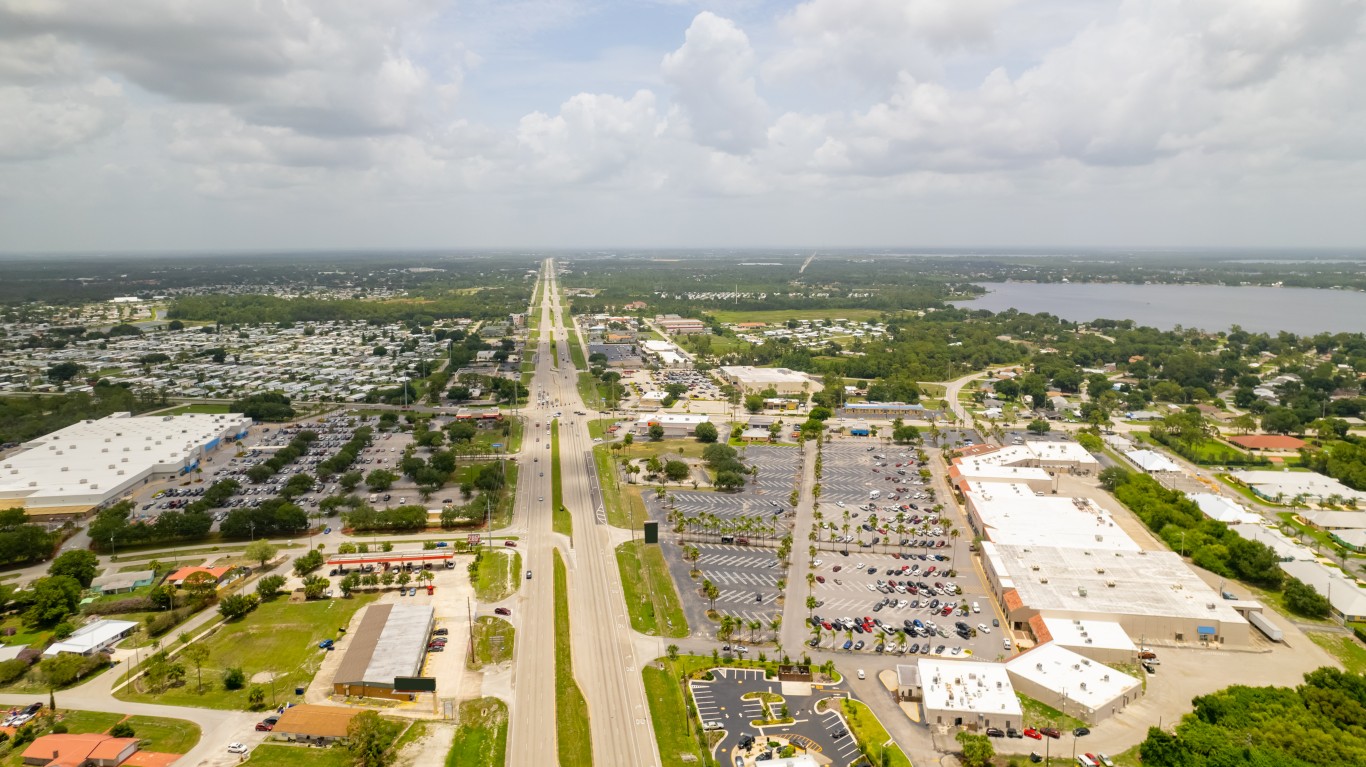
- Motor-vehicle fatality rate: 190.1 per 100,000 people 15 and older (114.7 per 100,000 statewide)
- Alcohol-related driving death rate: 34.8 per 100,000 people 15 and older (18.7 per 100,000 statewide)
- Vehicle theft rate in 2022: 189.4 per 100,000 people (206.9 per 100,000 statewide)
- Total vehicle thefts reported in 2022: 200 (46,020 statewide)
- Avg. commute time in 2022: : 26.0 minutes (28.0 minutes statewide)
- Metro areas considered in state: 22
Georgia: Macon
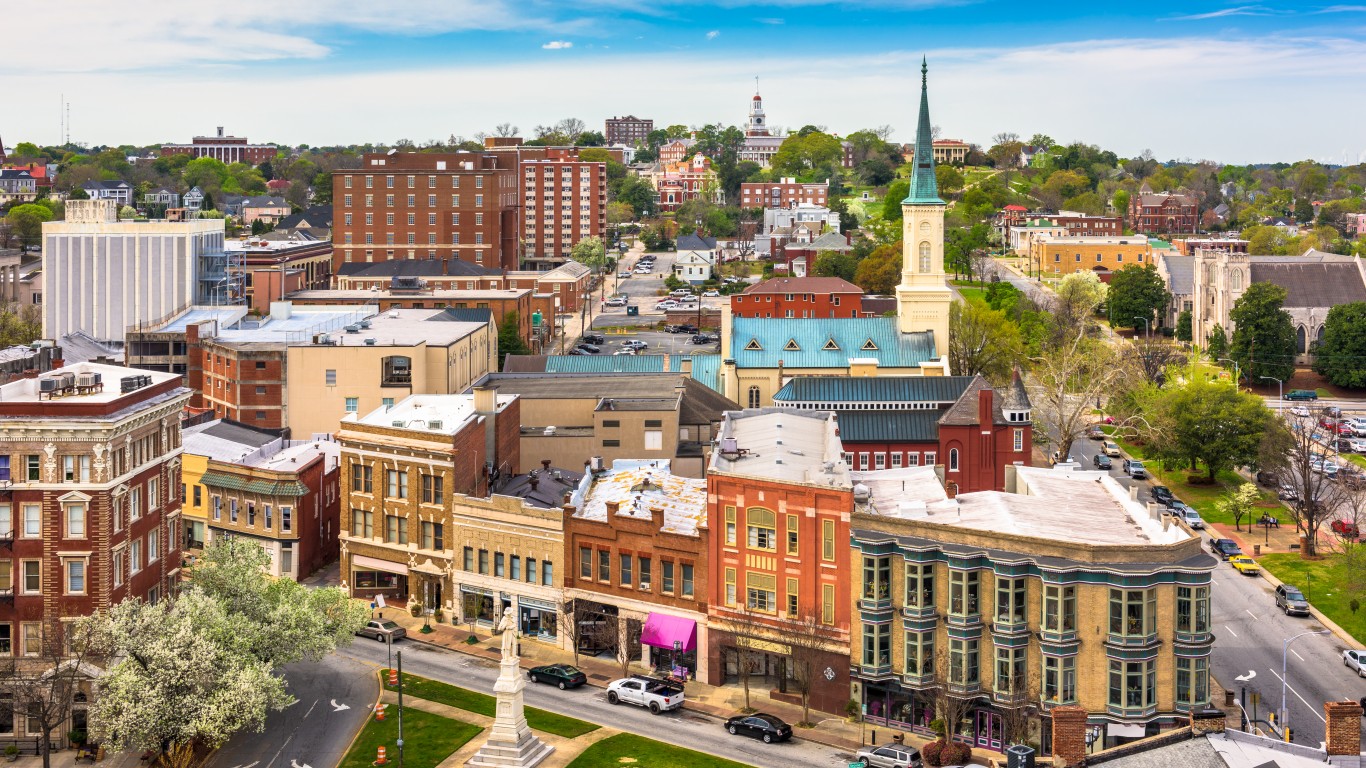
- Motor-vehicle fatality rate: 165.9 per 100,000 people 15 and older (117.6 per 100,000 statewide)
- Alcohol-related driving death rate: 29.0 per 100,000 people 15 and older (18.1 per 100,000 statewide)
- Vehicle theft rate in 2022: 455.7 per 100,000 people (243.9 per 100,000 statewide)
- Total vehicle thefts reported in 2022: 1,066 (26,612 statewide)
- Avg. commute time in 2022: : 25.0 minutes (28.2 minutes statewide)
- Metro areas considered in state: 14
Hawaii: Kahului-Wailuku-Lahaina
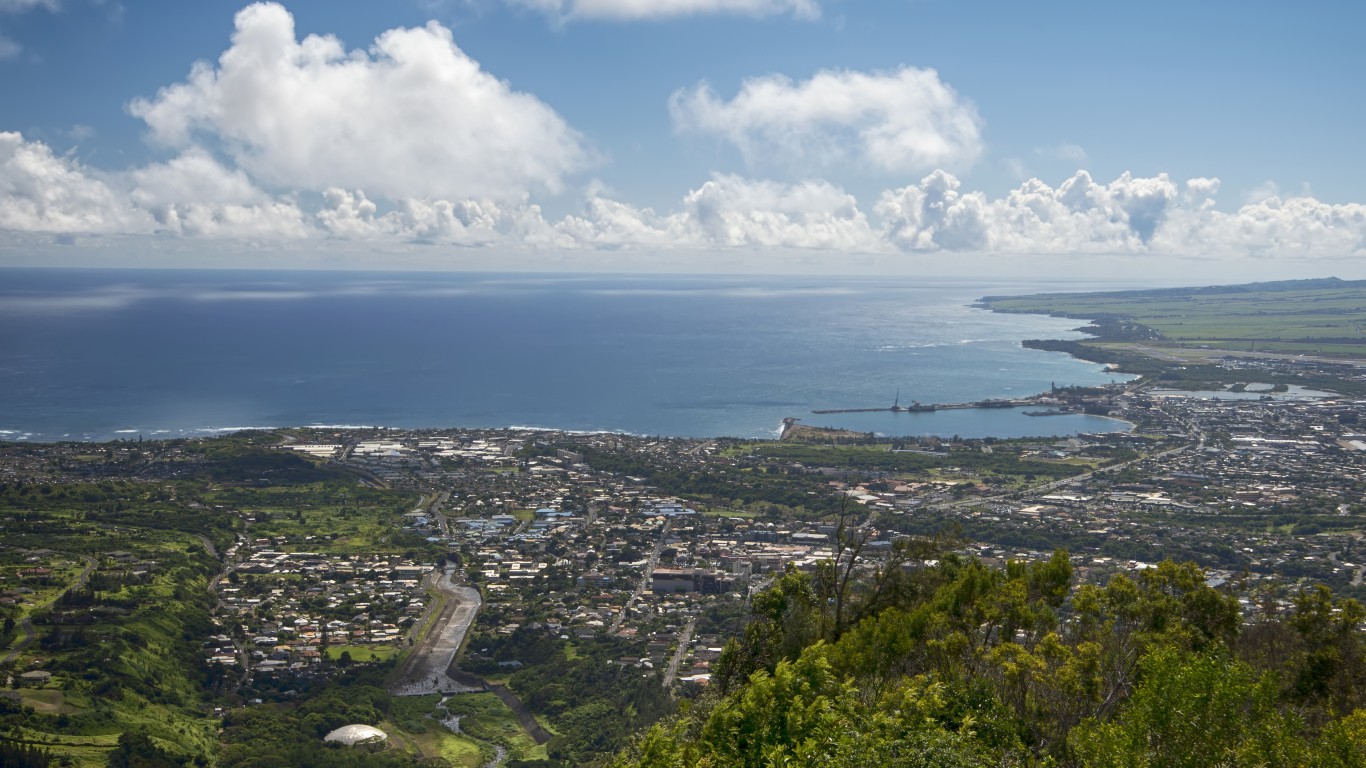
- Motor-vehicle fatality rate: 90.7 per 100,000 people 15 and older (62.8 per 100,000 statewide)
- Alcohol-related driving death rate: 28.7 per 100,000 people 15 and older (14.2 per 100,000 statewide)
- Vehicle theft rate in 2022: 0.0 per 100,000 people (183.2 per 100,000 statewide)
- Total vehicle thefts reported in 2022: 0 (2,639 statewide)
- Avg. commute time in 2022: : 23.1 minutes (26.1 minutes statewide)
- Metro areas considered in state: 2
Idaho: Twin Falls
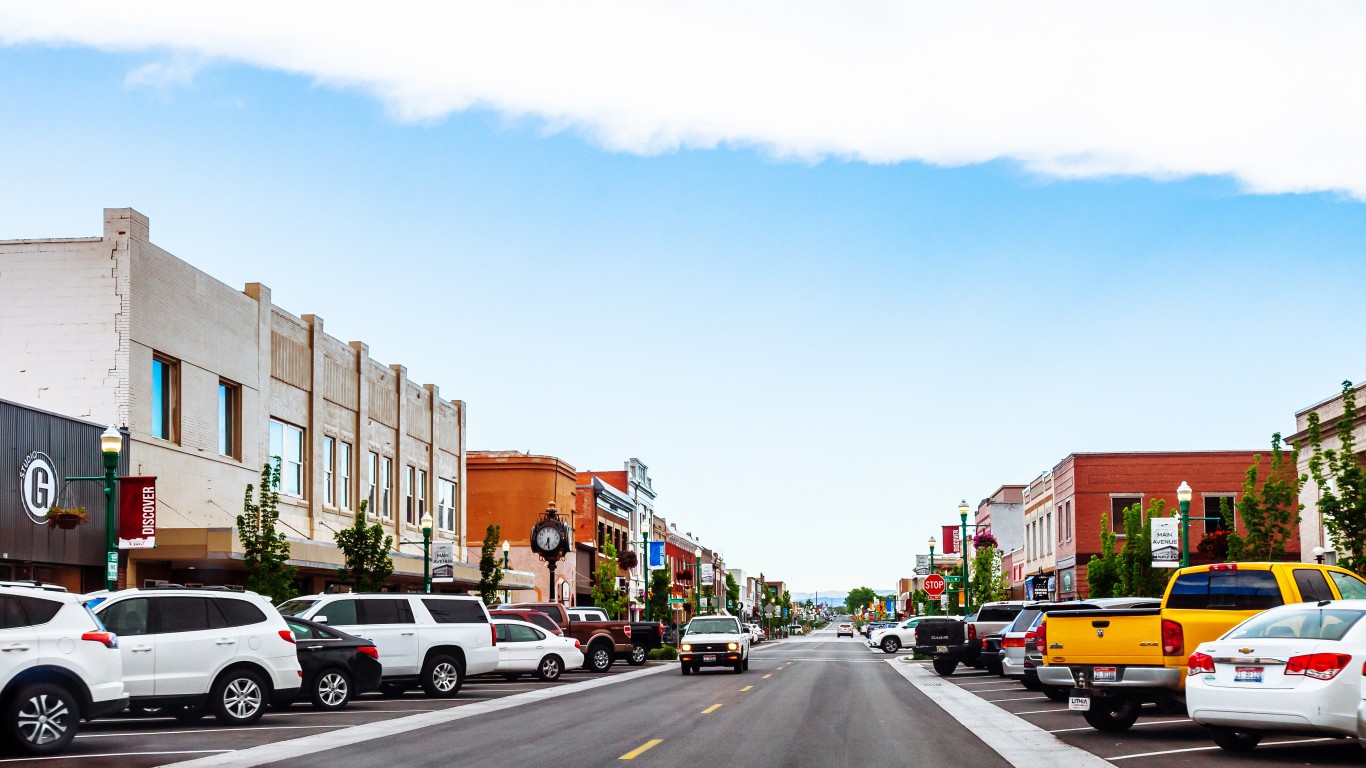
- Motor-vehicle fatality rate: 155.1 per 100,000 people 15 and older (103.0 per 100,000 statewide)
- Alcohol-related driving death rate: 33.4 per 100,000 people 15 and older (23.3 per 100,000 statewide)
- Vehicle theft rate in 2022: 107.6 per 100,000 people (91.1 per 100,000 statewide)
- Total vehicle thefts reported in 2022: 128 (1,766 statewide)
- Avg. commute time in 2022: : 18.4 minutes (22.1 minutes statewide)
- Metro areas considered in state: 6
Illinois: Kankakee
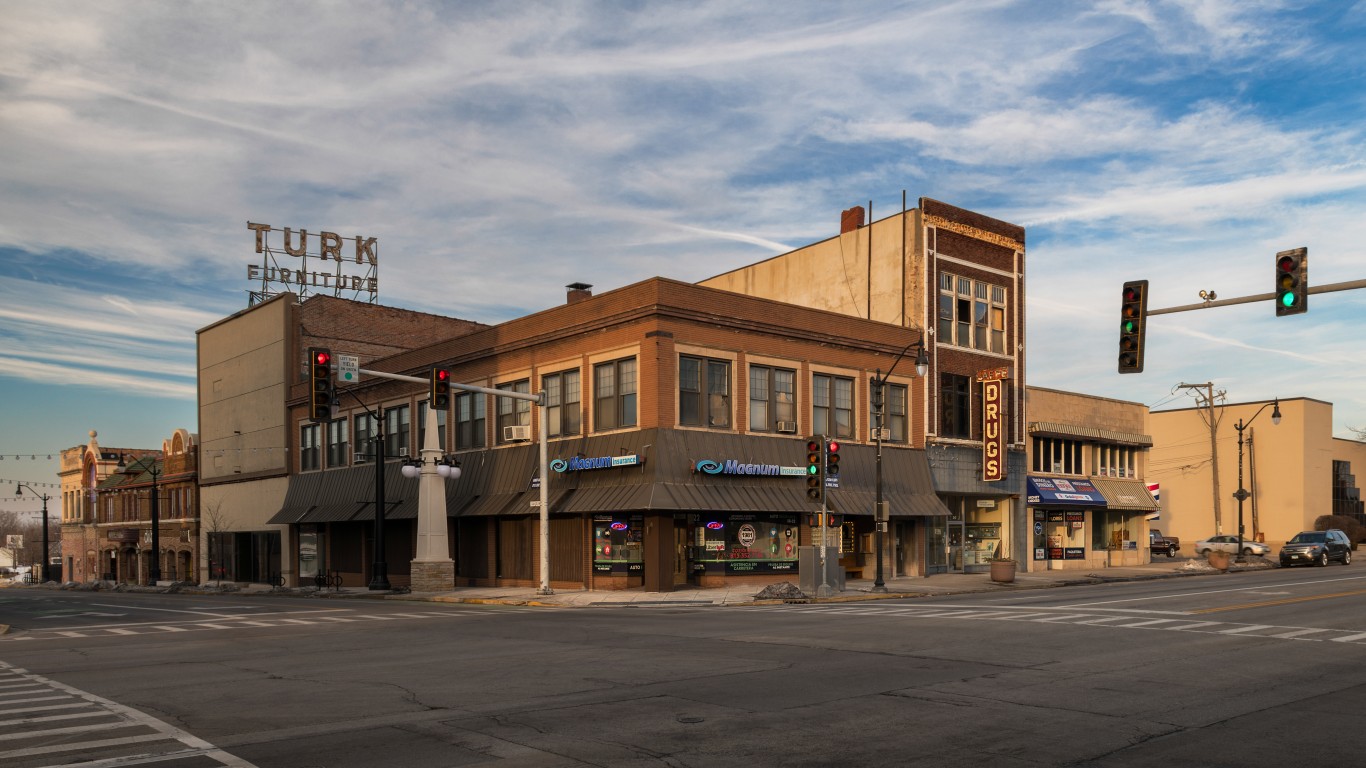
- Motor-vehicle fatality rate: 133.0 per 100,000 people 15 and older (76.3 per 100,000 statewide)
- Alcohol-related driving death rate: 39.3 per 100,000 people 15 and older (15.0 per 100,000 statewide)
- Vehicle theft rate in 2022: 98.0 per 100,000 people (307.6 per 100,000 statewide)
- Total vehicle thefts reported in 2022: 104 (38,699 statewide)
- Avg. commute time in 2022: : 24.3 minutes (27.9 minutes statewide)
- Metro areas considered in state: 10
Indiana: Kokomo
- Motor-vehicle fatality rate: 158.9 per 100,000 people 15 and older (105.1 per 100,000 statewide)
- Alcohol-related driving death rate: 35.3 per 100,000 people 15 and older (14.7 per 100,000 statewide)
- Vehicle theft rate in 2022: 131.6 per 100,000 people (226.0 per 100,000 statewide)
- Total vehicle thefts reported in 2022: 110 (15,440 statewide)
- Avg. commute time in 2022: : 21.6 minutes (24.1 minutes statewide)
- Metro areas considered in state: 12
Iowa: Davenport-Moline-Rock Island
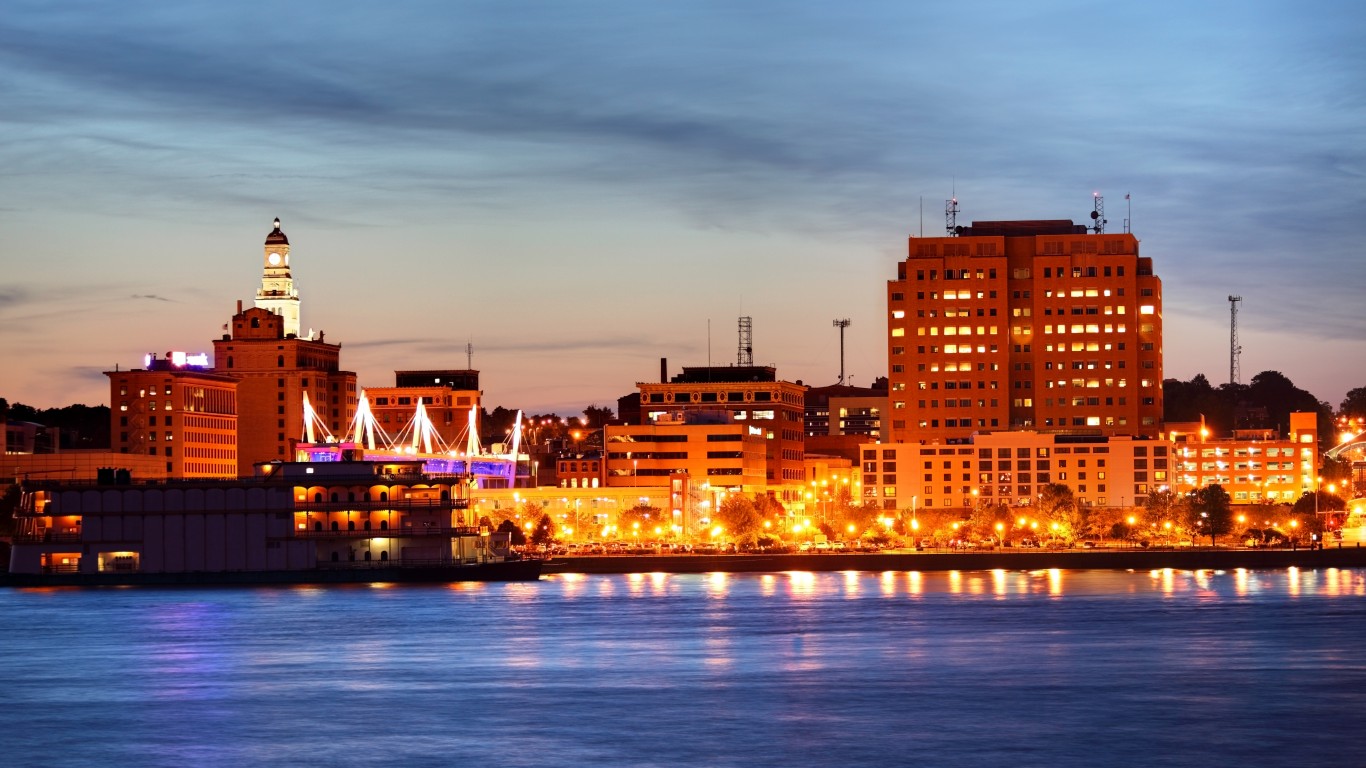
- Motor-vehicle fatality rate: 75.7 per 100,000 people 15 and older (93.9 per 100,000 statewide)
- Alcohol-related driving death rate: 13.3 per 100,000 people 15 and older (17.6 per 100,000 statewide)
- Vehicle theft rate in 2022: 351.9 per 100,000 people (168.1 per 100,000 statewide)
- Total vehicle thefts reported in 2022: 1,335 (5,379 statewide)
- Avg. commute time in 2022: : 20.1 minutes (19.7 minutes statewide)
- Metro areas considered in state: 8
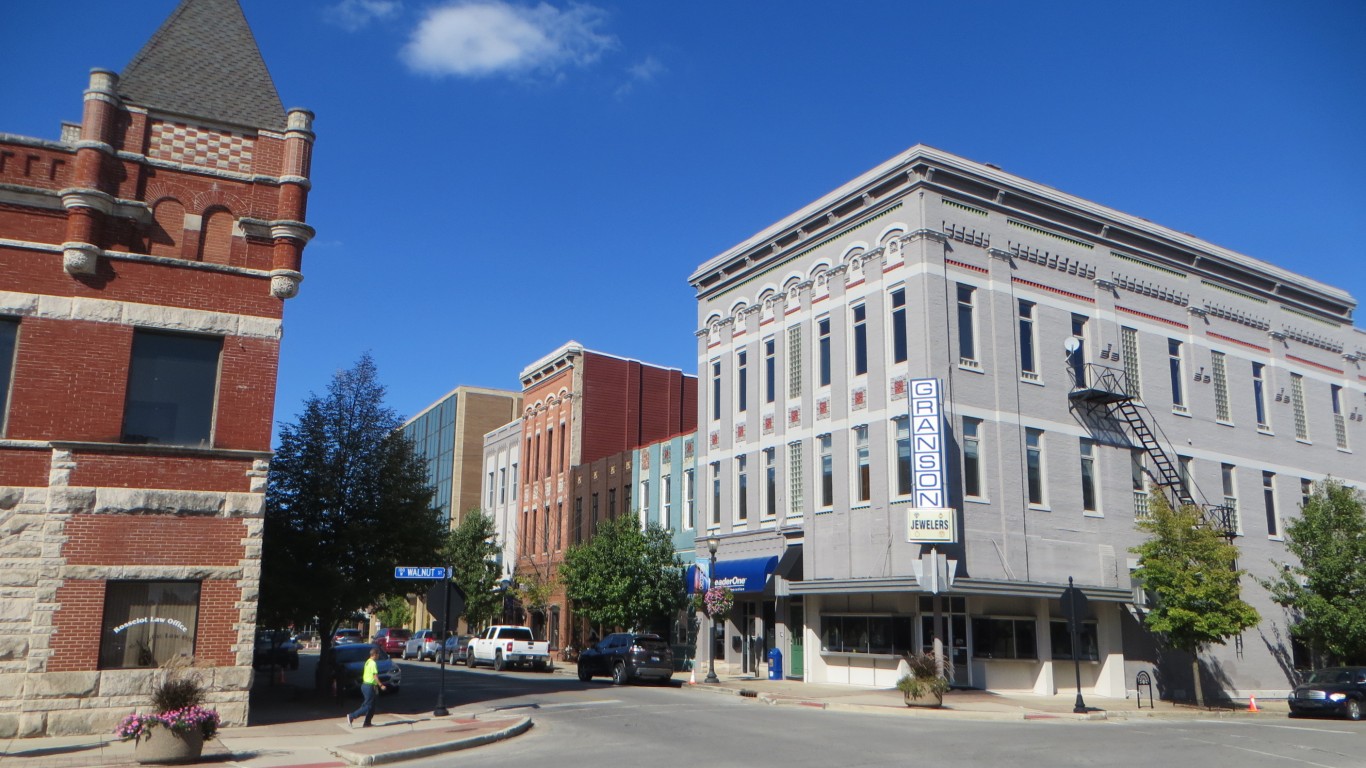
Kansas: Topeka
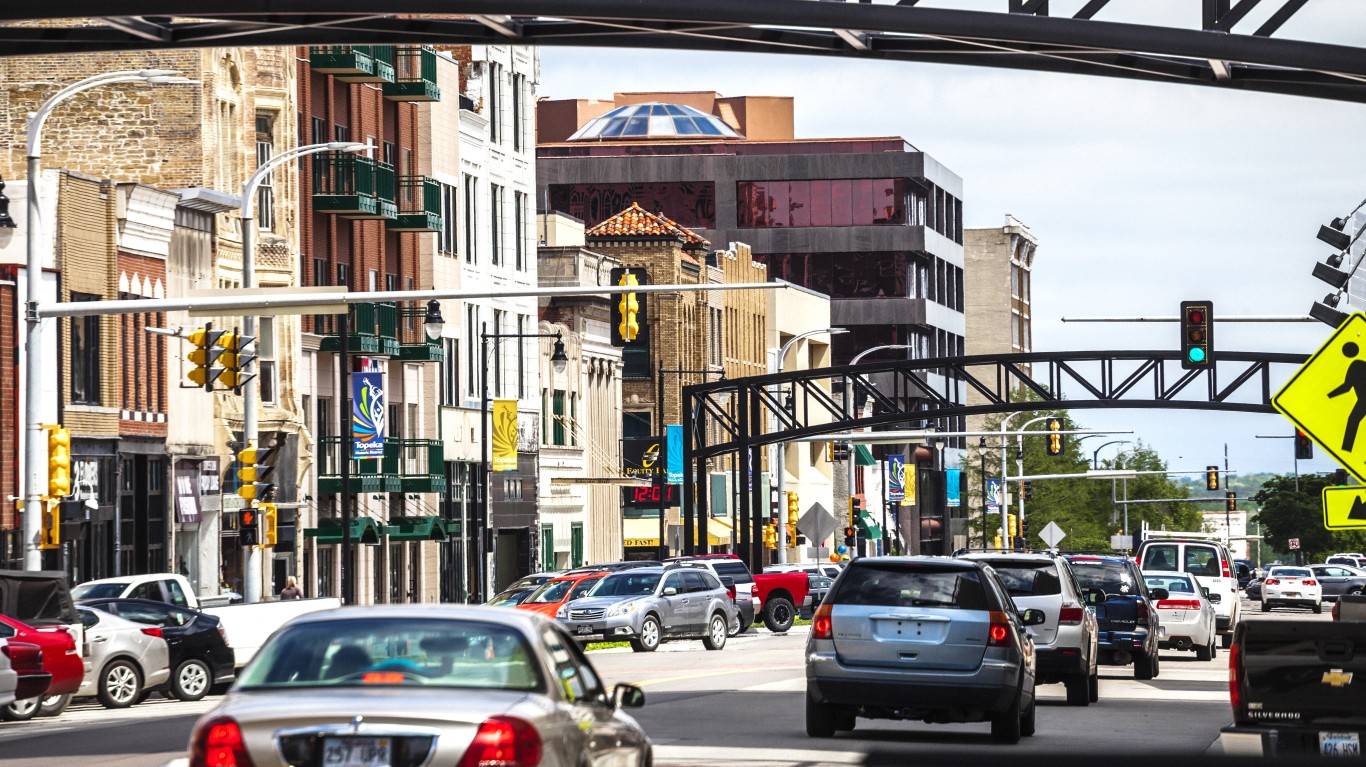
- Motor-vehicle fatality rate: 131.5 per 100,000 people 15 and older (117.3 per 100,000 statewide)
- Alcohol-related driving death rate: 20.7 per 100,000 people 15 and older (17.4 per 100,000 statewide)
- Vehicle theft rate in 2022: 382.7 per 100,000 people (292.4 per 100,000 statewide)
- Total vehicle thefts reported in 2022: 887 (8,588 statewide)
- Avg. commute time in 2022: : 21.0 minutes (19.6 minutes statewide)
- Metro areas considered in state: 4
Kentucky: Elizabethtown-Fort Knox

- Motor-vehicle fatality rate: 164.7 per 100,000 people 15 and older (146.0 per 100,000 statewide)
- Alcohol-related driving death rate: 28.4 per 100,000 people 15 and older (26.6 per 100,000 statewide)
- Vehicle theft rate in 2022: 142.7 per 100,000 people (226.4 per 100,000 statewide)
- Total vehicle thefts reported in 2022: 224 (10,217 statewide)
- Avg. commute time in 2022: : 24.7 minutes (24.1 minutes statewide)
- Metro areas considered in state: 5
Louisiana: Hammond
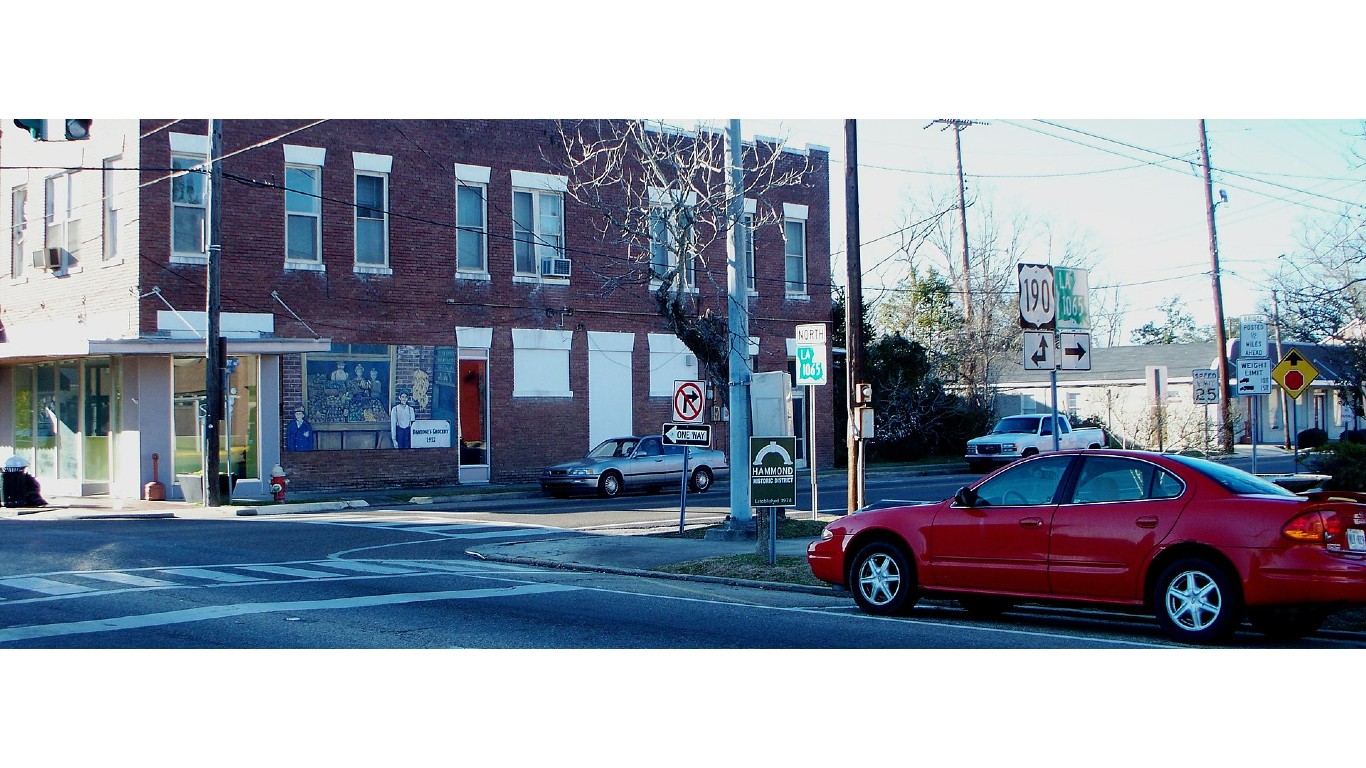
- Motor-vehicle fatality rate: 189.5 per 100,000 people 15 and older (147.6 per 100,000 statewide)
- Alcohol-related driving death rate: 41.2 per 100,000 people 15 and older (32.4 per 100,000 statewide)
- Vehicle theft rate in 2022: 231.3 per 100,000 people (297.1 per 100,000 statewide)
- Total vehicle thefts reported in 2022: 317 (13,638 statewide)
- Avg. commute time in 2022: : 30.7 minutes (25.6 minutes statewide)
- Metro areas considered in state: 9
Maine: Bangor
- Motor-vehicle fatality rate: 108.9 per 100,000 people 15 and older (92.9 per 100,000 statewide)
- Alcohol-related driving death rate: 23.4 per 100,000 people 15 and older (23.0 per 100,000 statewide)
- Vehicle theft rate in 2022: 80.7 per 100,000 people (68.1 per 100,000 statewide)
- Total vehicle thefts reported in 2022: 124 (944 statewide)
- Avg. commute time in 2022: : 23.1 minutes (24.7 minutes statewide)
- Metro areas considered in state: 3
Maryland: California-Lexington Park

- Motor-vehicle fatality rate: 107.6 per 100,000 people 15 and older (74.2 per 100,000 statewide)
- Alcohol-related driving death rate: 33.3 per 100,000 people 15 and older (14.9 per 100,000 statewide)
- Vehicle theft rate in 2022: 74.9 per 100,000 people (260.9 per 100,000 statewide)
- Total vehicle thefts reported in 2022: 86 (16,086 statewide)
- Avg. commute time in 2022: : 28.7 minutes (30.8 minutes statewide)
- Metro areas considered in state: 5
Massachusetts: Worcester
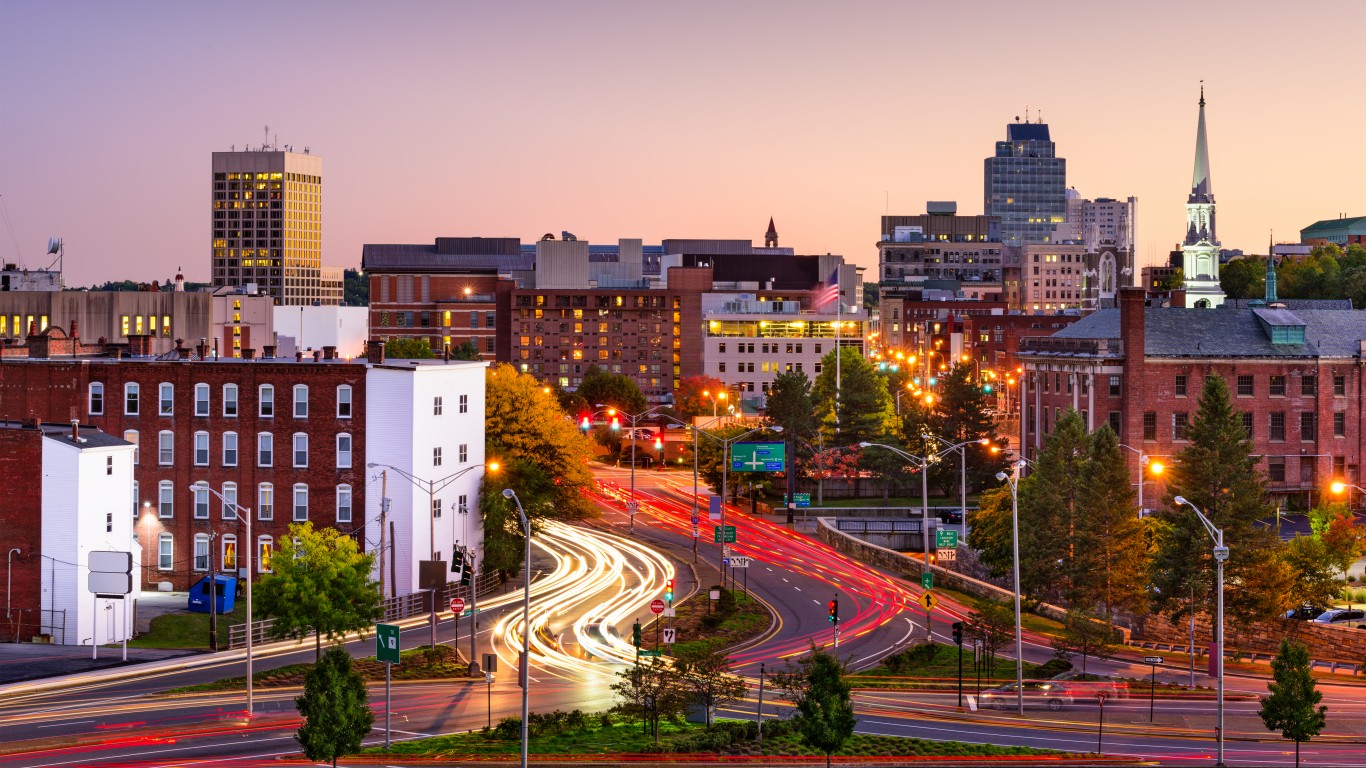
- Motor-vehicle fatality rate: 59.8 per 100,000 people 15 and older (46.7 per 100,000 statewide)
- Alcohol-related driving death rate: 13.2 per 100,000 people 15 and older (9.2 per 100,000 statewide)
- Vehicle theft rate in 2022: 77.4 per 100,000 people (101.5 per 100,000 statewide)
- Total vehicle thefts reported in 2022: 759 (7,084 statewide)
- Avg. commute time in 2022: : 28.2 minutes (28.6 minutes statewide)
- Metro areas considered in state: 5
Michigan: Monroe
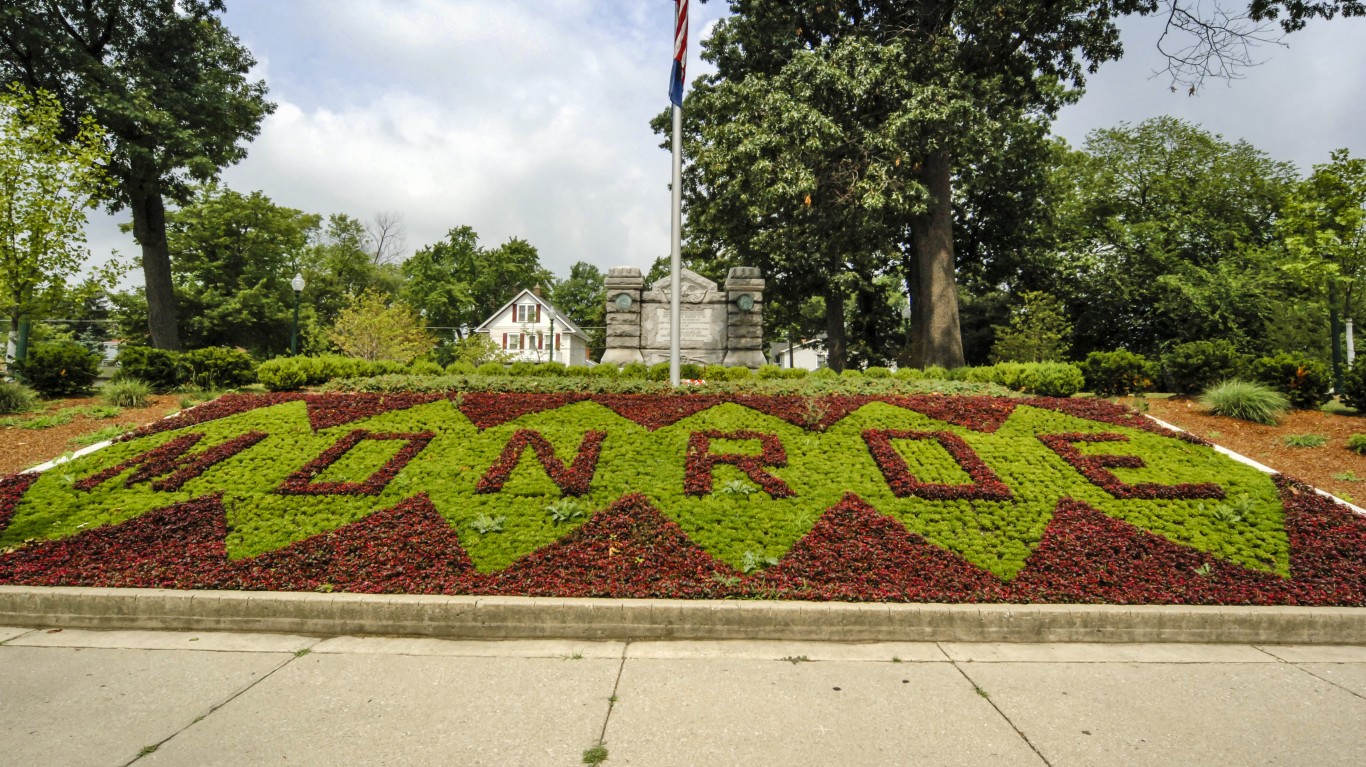
- Motor-vehicle fatality rate: 111.2 per 100,000 people 15 and older (83.2 per 100,000 statewide)
- Alcohol-related driving death rate: 35.5 per 100,000 people 15 and older (18.1 per 100,000 statewide)
- Vehicle theft rate in 2022: 120.8 per 100,000 people (256.7 per 100,000 statewide)
- Total vehicle thefts reported in 2022: 188 (25,753 statewide)
- Avg. commute time in 2022: : 25.7 minutes (24.2 minutes statewide)
- Metro areas considered in state: 14
Minnesota: Minneapolis-St. Paul-Bloomington

- Motor-vehicle fatality rate: 47.5 per 100,000 people 15 and older (64.4 per 100,000 statewide)
- Alcohol-related driving death rate: 9.4 per 100,000 people 15 and older (12.1 per 100,000 statewide)
- Vehicle theft rate in 2022: 417.7 per 100,000 people (311.9 per 100,000 statewide)
- Total vehicle thefts reported in 2022: 15,429 (17,832 statewide)
- Avg. commute time in 2022: : 24.0 minutes (22.8 minutes statewide)
- Metro areas considered in state: 5
Mississippi: Jackson

- Motor-vehicle fatality rate: 176.0 per 100,000 people 15 and older (214.0 per 100,000 statewide)
- Alcohol-related driving death rate: 20.1 per 100,000 people 15 and older (26.6 per 100,000 statewide)
- Vehicle theft rate in 2022: 302.8 per 100,000 people (209.2 per 100,000 statewide)
- Total vehicle thefts reported in 2022: 1,766 (6,150 statewide)
- Avg. commute time in 2022: : 24.7 minutes (25.5 minutes statewide)
- Metro areas considered in state: 3
Missouri: St. Louis

- Motor-vehicle fatality rate: 106.6 per 100,000 people 15 and older (126.4 per 100,000 statewide)
- Alcohol-related driving death rate: 22.3 per 100,000 people 15 and older (25.4 per 100,000 statewide)
- Vehicle theft rate in 2022: 537.7 per 100,000 people (482.6 per 100,000 statewide)
- Total vehicle thefts reported in 2022: 15,063 (29,815 statewide)
- Avg. commute time in 2022: : 24.8 minutes (23.7 minutes statewide)
- Metro areas considered in state: 8
Montana: Billings
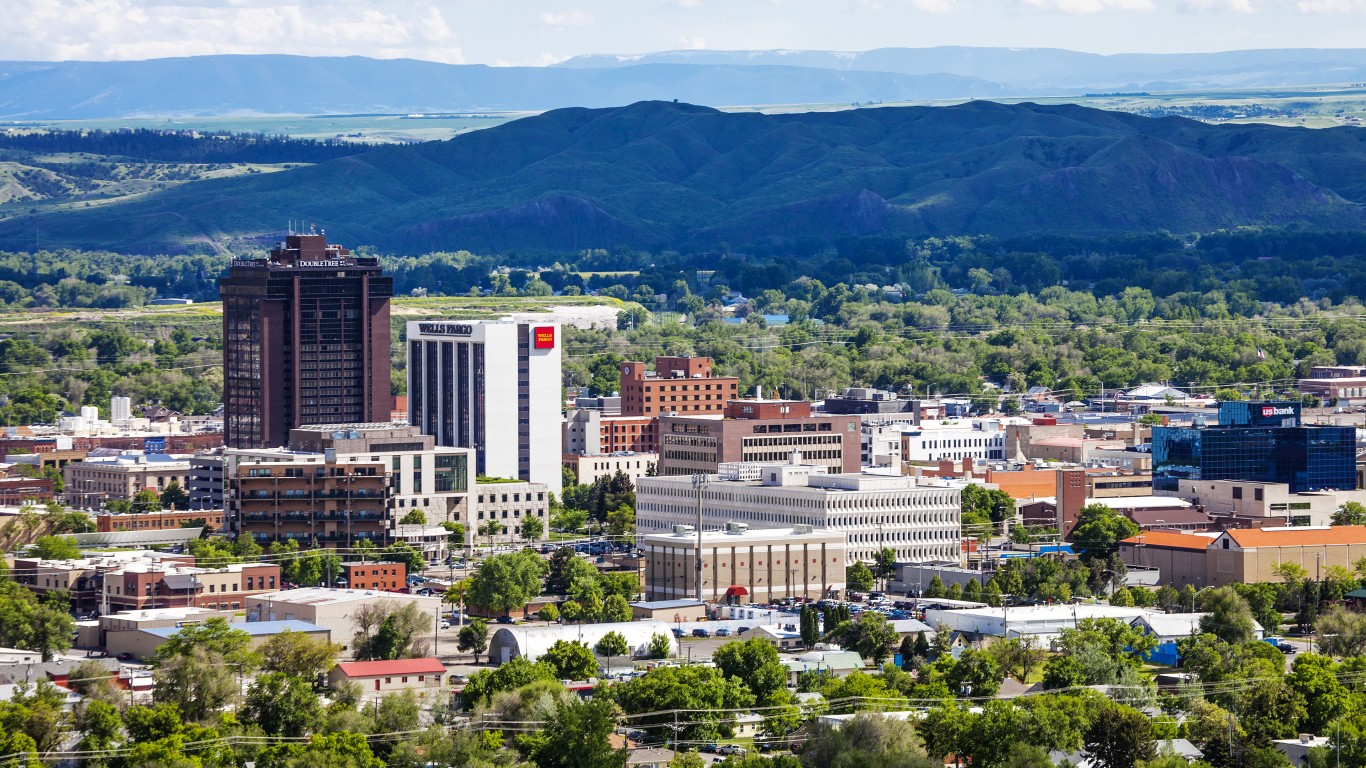
- Motor-vehicle fatality rate: 118.1 per 100,000 people 15 and older (138.0 per 100,000 statewide)
- Alcohol-related driving death rate: 34.0 per 100,000 people 15 and older (47.6 per 100,000 statewide)
- Vehicle theft rate in 2022: 447.9 per 100,000 people (223.7 per 100,000 statewide)
- Total vehicle thefts reported in 2022: 852 (2,512 statewide)
- Avg. commute time in 2022: : 20.2 minutes (19.0 minutes statewide)
- Metro areas considered in state: 3
Nebraska: Omaha-Council Bluffs

- Motor-vehicle fatality rate: 84.6 per 100,000 people 15 and older (106.8 per 100,000 statewide)
- Alcohol-related driving death rate: 18.2 per 100,000 people 15 and older (24.3 per 100,000 statewide)
- Vehicle theft rate in 2022: 388.6 per 100,000 people (257.0 per 100,000 statewide)
- Total vehicle thefts reported in 2022: 3,795 (5,058 statewide)
- Avg. commute time in 2022: : 20.4 minutes (18.8 minutes statewide)
- Metro areas considered in state: 3
Nevada: Las Vegas-Henderson-Paradise
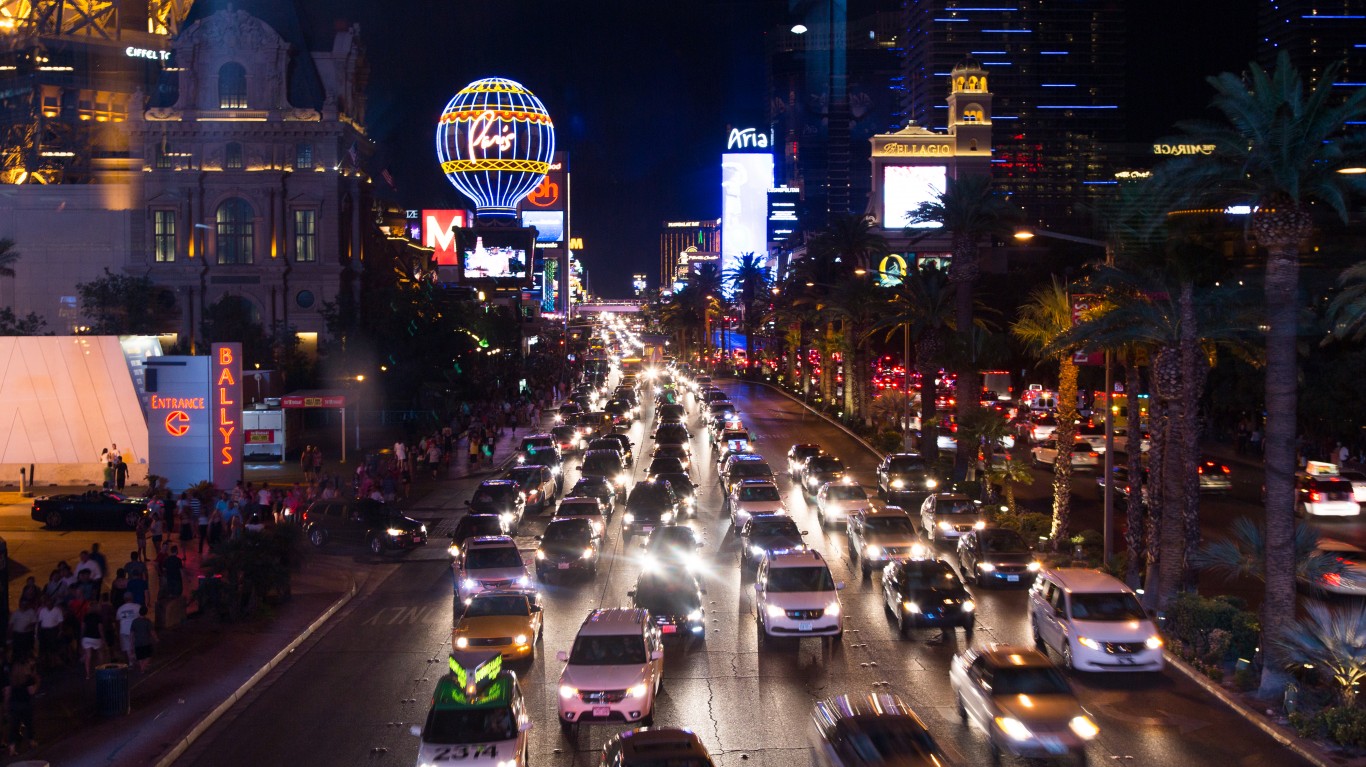
- Motor-vehicle fatality rate: 80.0 per 100,000 people 15 and older (88.6 per 100,000 statewide)
- Alcohol-related driving death rate: 13.8 per 100,000 people 15 and older (16.7 per 100,000 statewide)
- Vehicle theft rate in 2022: 561.8 per 100,000 people (480.8 per 100,000 statewide)
- Total vehicle thefts reported in 2022: 13,051 (15,279 statewide)
- Avg. commute time in 2022: : 24.6 minutes (24.5 minutes statewide)
- Metro areas considered in state: 3
New Hampshire: Manchester-Nashua
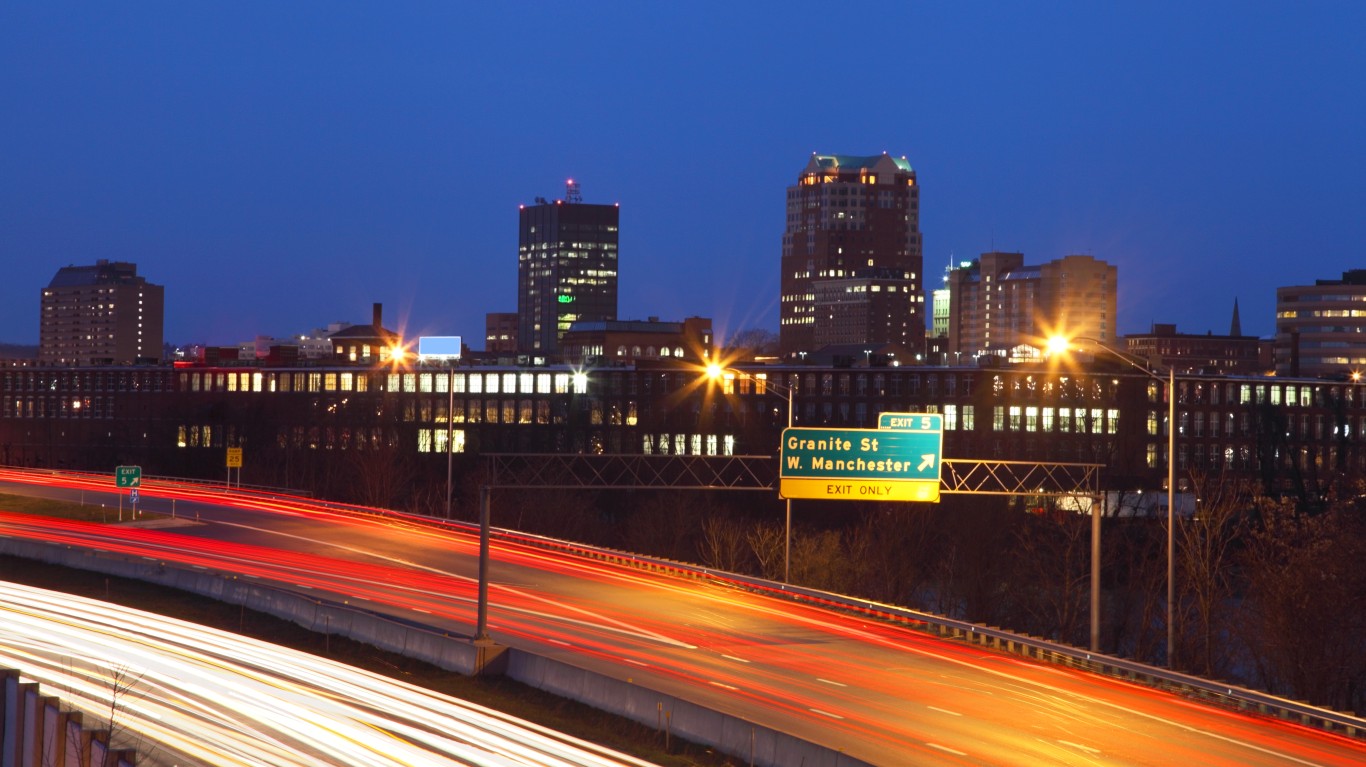
- Motor-vehicle fatality rate: 55.9 per 100,000 people 15 and older (65.6 per 100,000 statewide)
- Alcohol-related driving death rate: 11.4 per 100,000 people 15 and older (16.3 per 100,000 statewide)
- Vehicle theft rate in 2022: 72.7 per 100,000 people (53.8 per 100,000 statewide)
- Total vehicle thefts reported in 2022: 310 (750 statewide)
- Avg. commute time in 2022: : 26.9 minutes (26.7 minutes statewide)
- Metro areas considered in state: 1
New Jersey: Vineland-Bridgeton

- Motor-vehicle fatality rate: 152.6 per 100,000 people 15 and older (54.4 per 100,000 statewide)
- Alcohol-related driving death rate: 27.9 per 100,000 people 15 and older (8.8 per 100,000 statewide)
- Vehicle theft rate in 2022: 113.6 per 100,000 people (174.5 per 100,000 statewide)
- Total vehicle thefts reported in 2022: 172 (16,165 statewide)
- Avg. commute time in 2022: : 25.5 minutes (30.3 minutes statewide)
- Metro areas considered in state: 4
New Mexico: Farmington
- Motor-vehicle fatality rate: 291.8 per 100,000 people 15 and older (153.5 per 100,000 statewide)
- Alcohol-related driving death rate: 70.9 per 100,000 people 15 and older (33.7 per 100,000 statewide)
- Vehicle theft rate in 2022: 190.2 per 100,000 people (540.6 per 100,000 statewide)
- Total vehicle thefts reported in 2022: 229 (11,424 statewide)
- Avg. commute time in 2022: : 25.7 minutes (23.7 minutes statewide)
- Metro areas considered in state: 4
New York: New York-Newark-Jersey City
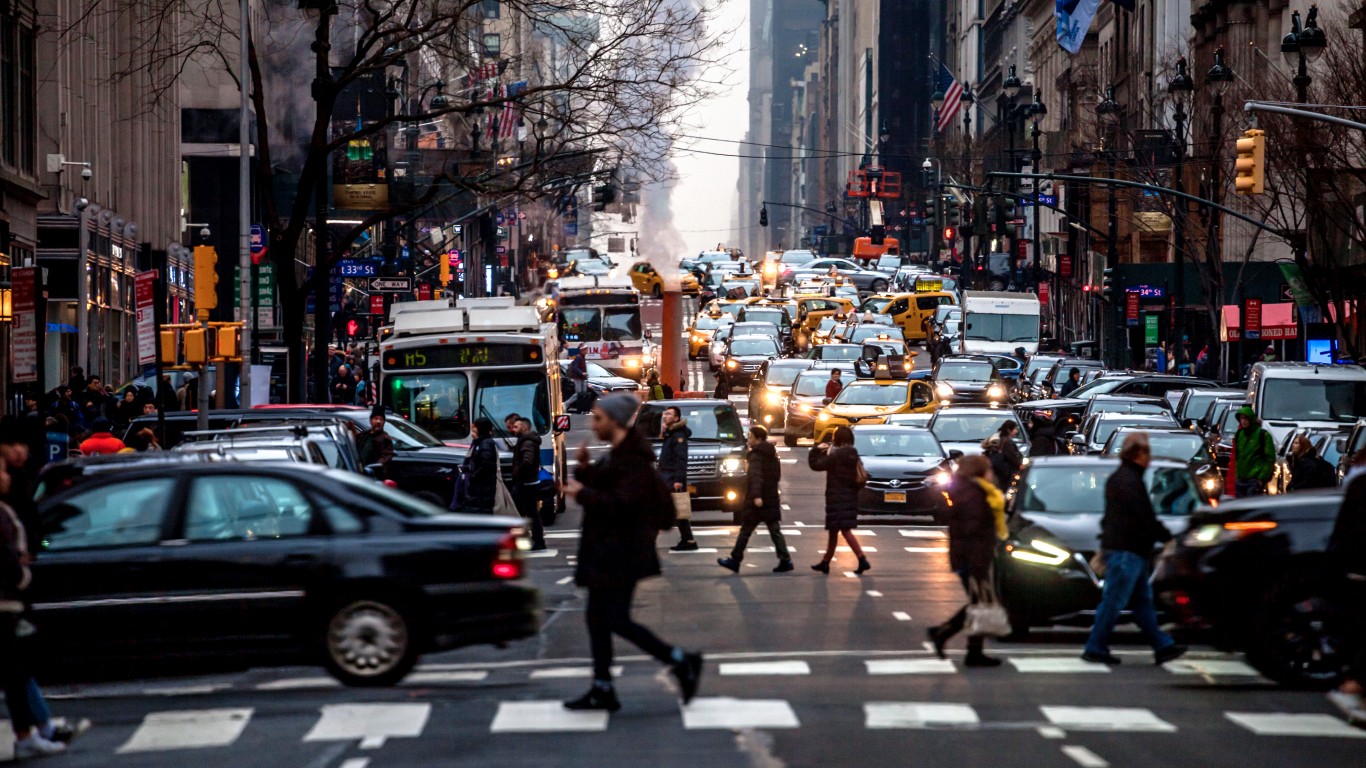
- Motor-vehicle fatality rate: 40.6 per 100,000 people 15 and older (46.9 per 100,000 statewide)
- Alcohol-related driving death rate: 4.8 per 100,000 people 15 and older (6.1 per 100,000 statewide)
- Vehicle theft rate in 2022: 160.5 per 100,000 people (143.9 per 100,000 statewide)
- Total vehicle thefts reported in 2022: 31,479 (28,323 statewide)
- Avg. commute time in 2022: : 35.8 minutes (33.0 minutes statewide)
- Metro areas considered in state: 12
North Carolina: Rocky Mount

- Motor-vehicle fatality rate: 210.3 per 100,000 people 15 and older (119.5 per 100,000 statewide)
- Alcohol-related driving death rate: 51.5 per 100,000 people 15 and older (21.1 per 100,000 statewide)
- Vehicle theft rate in 2022: 147.8 per 100,000 people (220.4 per 100,000 statewide)
- Total vehicle thefts reported in 2022: 213 (23,576 statewide)
- Avg. commute time in 2022: : 24.7 minutes (25.1 minutes statewide)
- Metro areas considered in state: 15
North Dakota: Bismarck
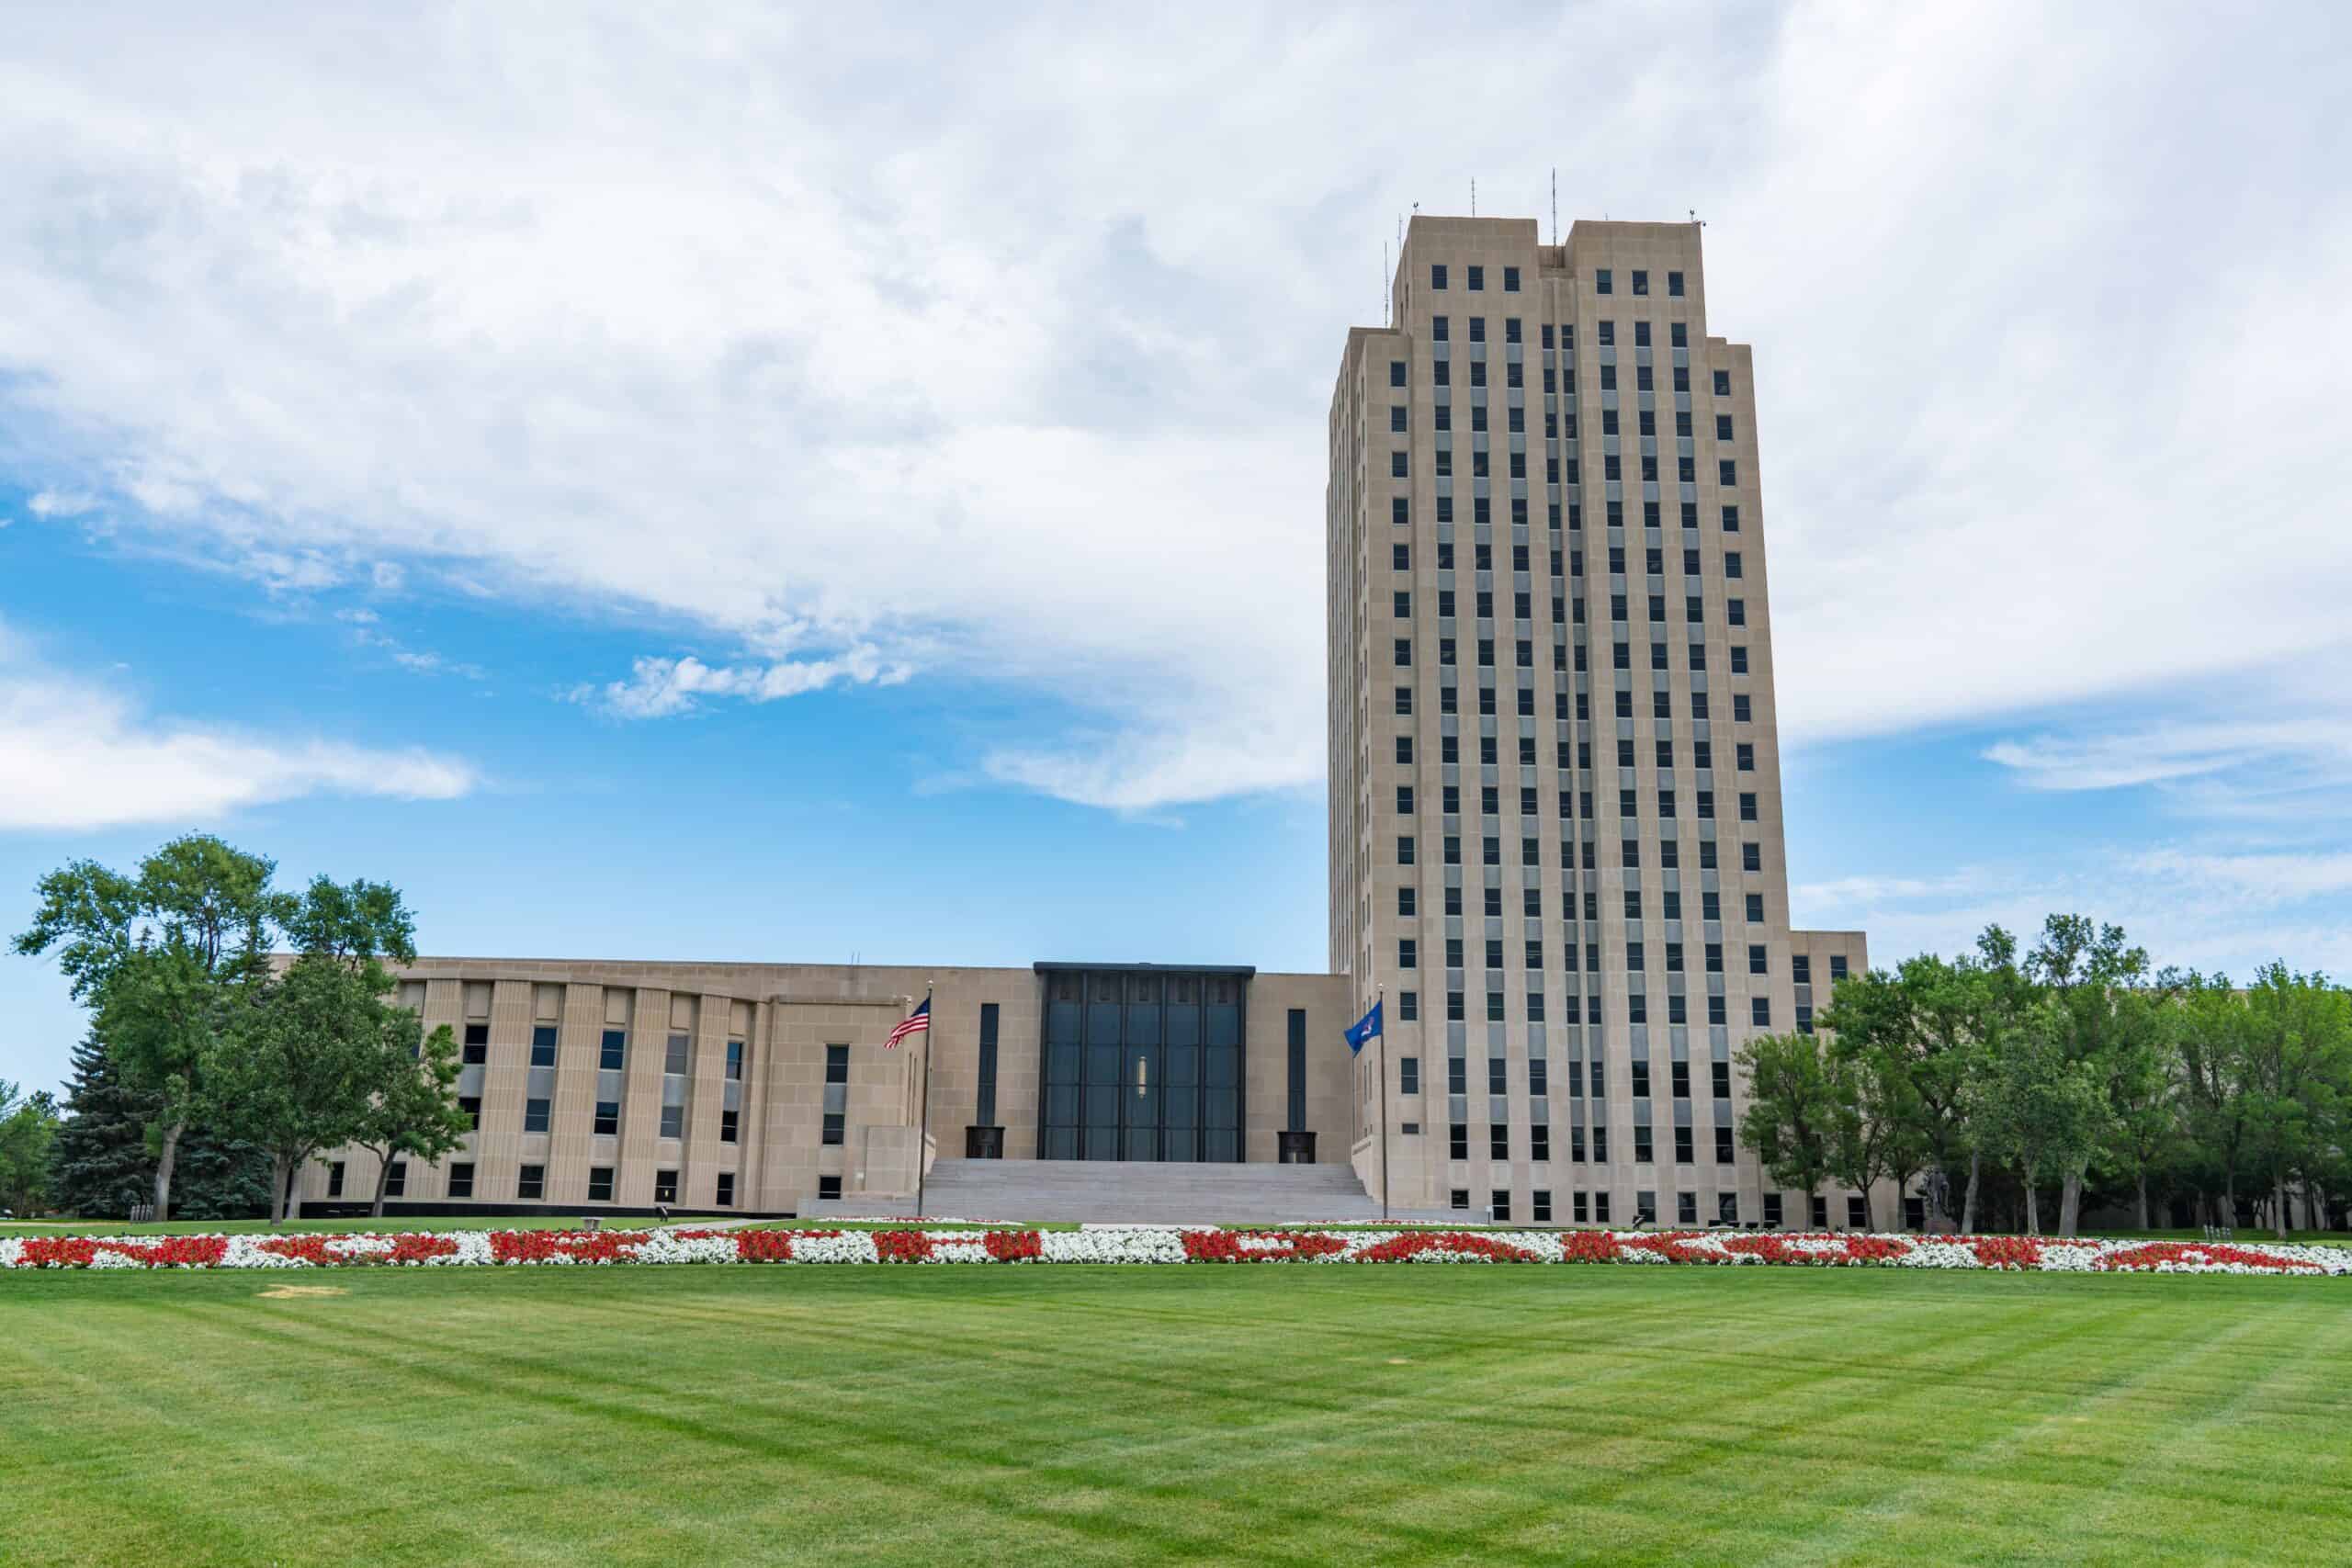
- Motor-vehicle fatality rate: 89.9 per 100,000 people 15 and older (117.4 per 100,000 statewide)
- Alcohol-related driving death rate: 19.3 per 100,000 people 15 and older (35.2 per 100,000 statewide)
- Vehicle theft rate in 2022: 206.9 per 100,000 people (224.6 per 100,000 statewide)
- Total vehicle thefts reported in 2022: 279 (1,750 statewide)
- Avg. commute time in 2022: : 18.4 minutes (18.3 minutes statewide)
- Metro areas considered in state: 3
Ohio: Springfield

- Motor-vehicle fatality rate: 134.8 per 100,000 people 15 and older (88.2 per 100,000 statewide)
- Alcohol-related driving death rate: 19.0 per 100,000 people 15 and older (19.4 per 100,000 statewide)
- Vehicle theft rate in 2022: 275.2 per 100,000 people (258.3 per 100,000 statewide)
- Total vehicle thefts reported in 2022: 371 (30,361 statewide)
- Avg. commute time in 2022: : 21.5 minutes (23.5 minutes statewide)
- Metro areas considered in state: 11
Oklahoma: Tulsa
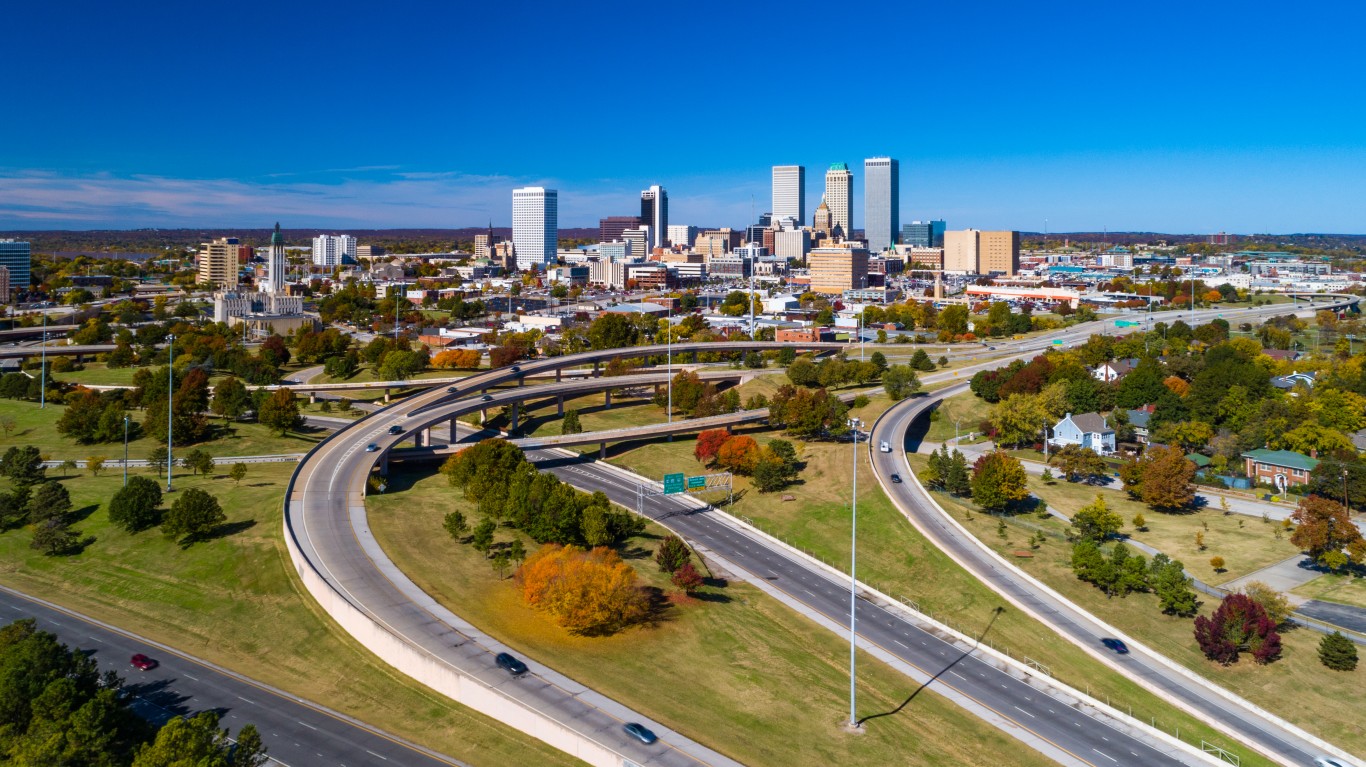
- Motor-vehicle fatality rate: 114.8 per 100,000 people 15 and older (146.9 per 100,000 statewide)
- Alcohol-related driving death rate: 21.6 per 100,000 people 15 and older (27.2 per 100,000 statewide)
- Vehicle theft rate in 2022: 417.2 per 100,000 people (298.7 per 100,000 statewide)
- Total vehicle thefts reported in 2022: 4,314 (12,007 statewide)
- Avg. commute time in 2022: : 21.9 minutes (22.7 minutes statewide)
- Metro areas considered in state: 4
Oregon: Grants Pass
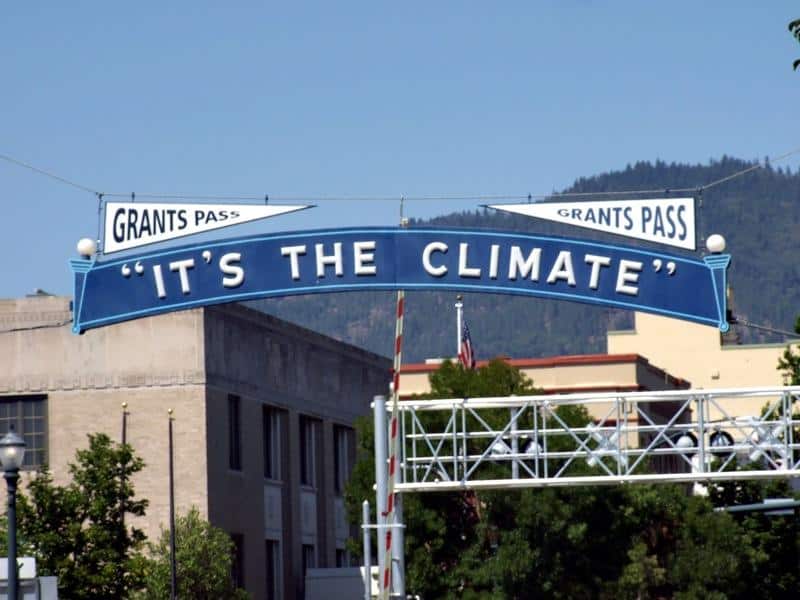
- Motor-vehicle fatality rate: 191.9 per 100,000 people 15 and older (92.7 per 100,000 statewide)
- Alcohol-related driving death rate: 61.7 per 100,000 people 15 and older (19.1 per 100,000 statewide)
- Vehicle theft rate in 2022: 396.7 per 100,000 people (540.9 per 100,000 statewide)
- Total vehicle thefts reported in 2022: 348 (22,934 statewide)
- Avg. commute time in 2022: : 22.5 minutes (22.8 minutes statewide)
- Metro areas considered in state: 8
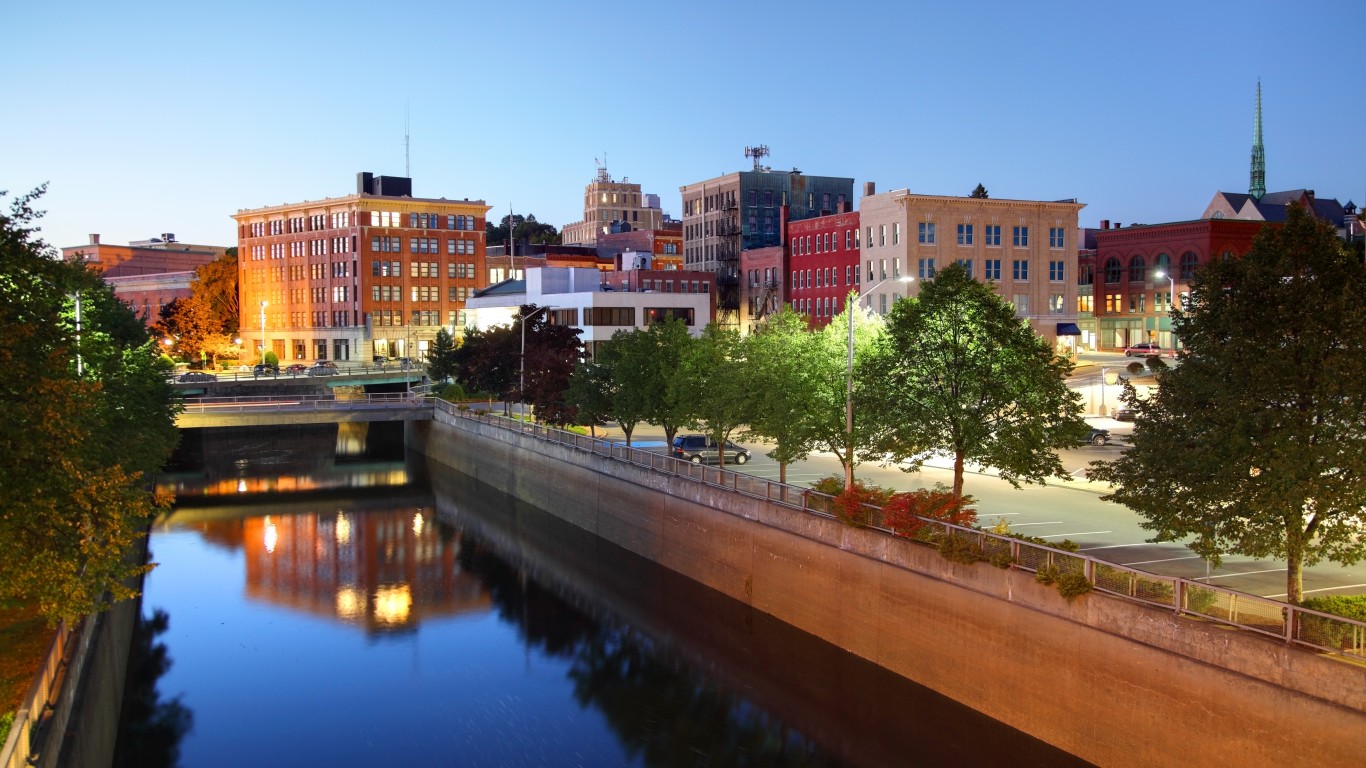
Pennsylvania: East Stroudsburg

- Motor-vehicle fatality rate: 113.0 per 100,000 people 15 and older (77.4 per 100,000 statewide)
- Alcohol-related driving death rate: 19.8 per 100,000 people 15 and older (13.4 per 100,000 statewide)
- Vehicle theft rate in 2022: 65.8 per 100,000 people (172.7 per 100,000 statewide)
- Total vehicle thefts reported in 2022: 110 (22,407 statewide)
- Avg. commute time in 2022: : 36.2 minutes (26.4 minutes statewide)
- Metro areas considered in state: 18
Rhode Island: Providence-Warwick

- Motor-vehicle fatality rate: 57.7 per 100,000 people 15 and older (51.2 per 100,000 statewide)
- Alcohol-related driving death rate: 13.9 per 100,000 people 15 and older (13.8 per 100,000 statewide)
- Vehicle theft rate in 2022: 149.8 per 100,000 people (164.2 per 100,000 statewide)
- Total vehicle thefts reported in 2022: 2,508 (1,796 statewide)
- Avg. commute time in 2022: : 26.4 minutes (25.4 minutes statewide)
- Metro areas considered in state: 1
South Carolina: Florence

- Motor-vehicle fatality rate: 224.3 per 100,000 people 15 and older (158.5 per 100,000 statewide)
- Alcohol-related driving death rate: 62.4 per 100,000 people 15 and older (38.4 per 100,000 statewide)
- Vehicle theft rate in 2022: 358.6 per 100,000 people (290.5 per 100,000 statewide)
- Total vehicle thefts reported in 2022: 714 (15,345 statewide)
- Avg. commute time in 2022: : 20.7 minutes (25.6 minutes statewide)
- Metro areas considered in state: 8
South Dakota: Rapid City
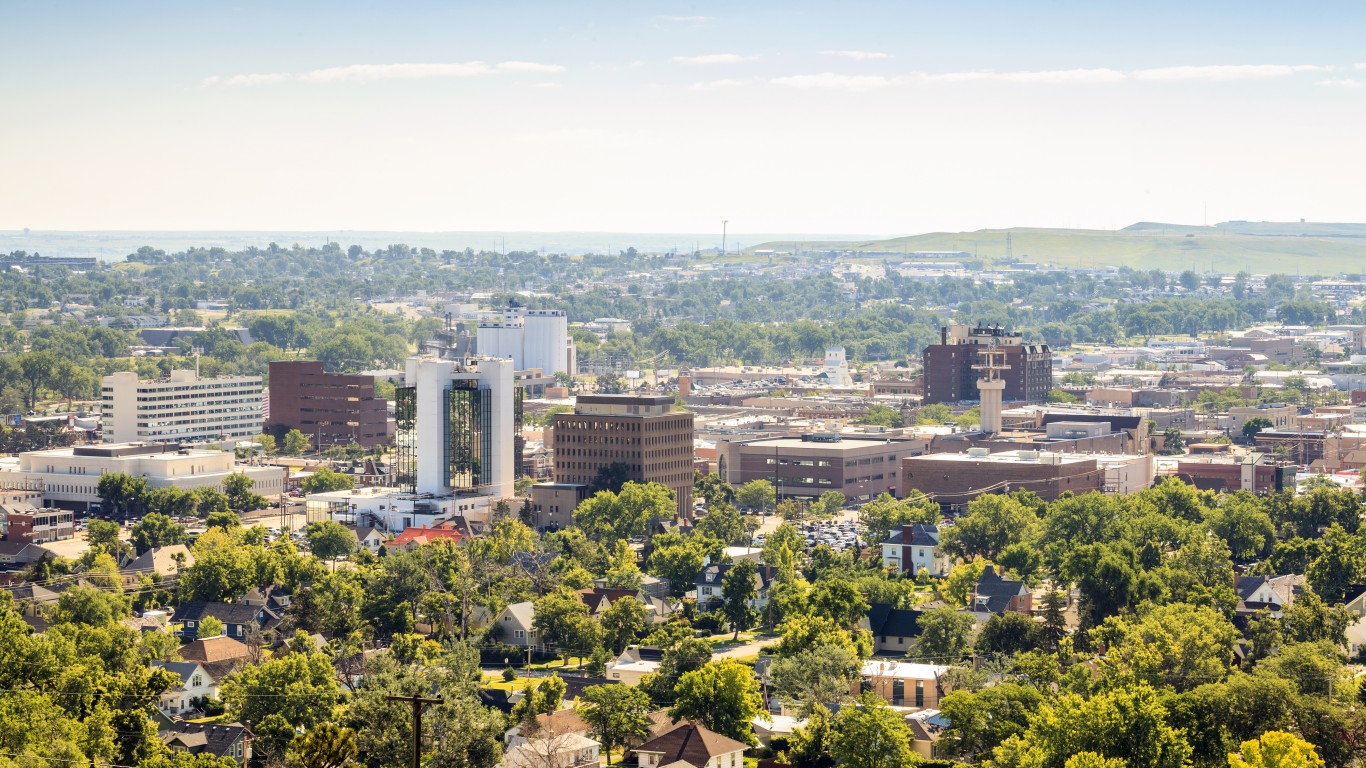
- Motor-vehicle fatality rate: 111.9 per 100,000 people 15 and older (136.4 per 100,000 statewide)
- Alcohol-related driving death rate: 25.2 per 100,000 people 15 and older (30.6 per 100,000 statewide)
- Vehicle theft rate in 2022: 397.5 per 100,000 people (248.3 per 100,000 statewide)
- Total vehicle thefts reported in 2022: 577 (2,259 statewide)
- Avg. commute time in 2022: : 19.3 minutes (18.2 minutes statewide)
- Metro areas considered in state: 2
Tennessee: Memphis
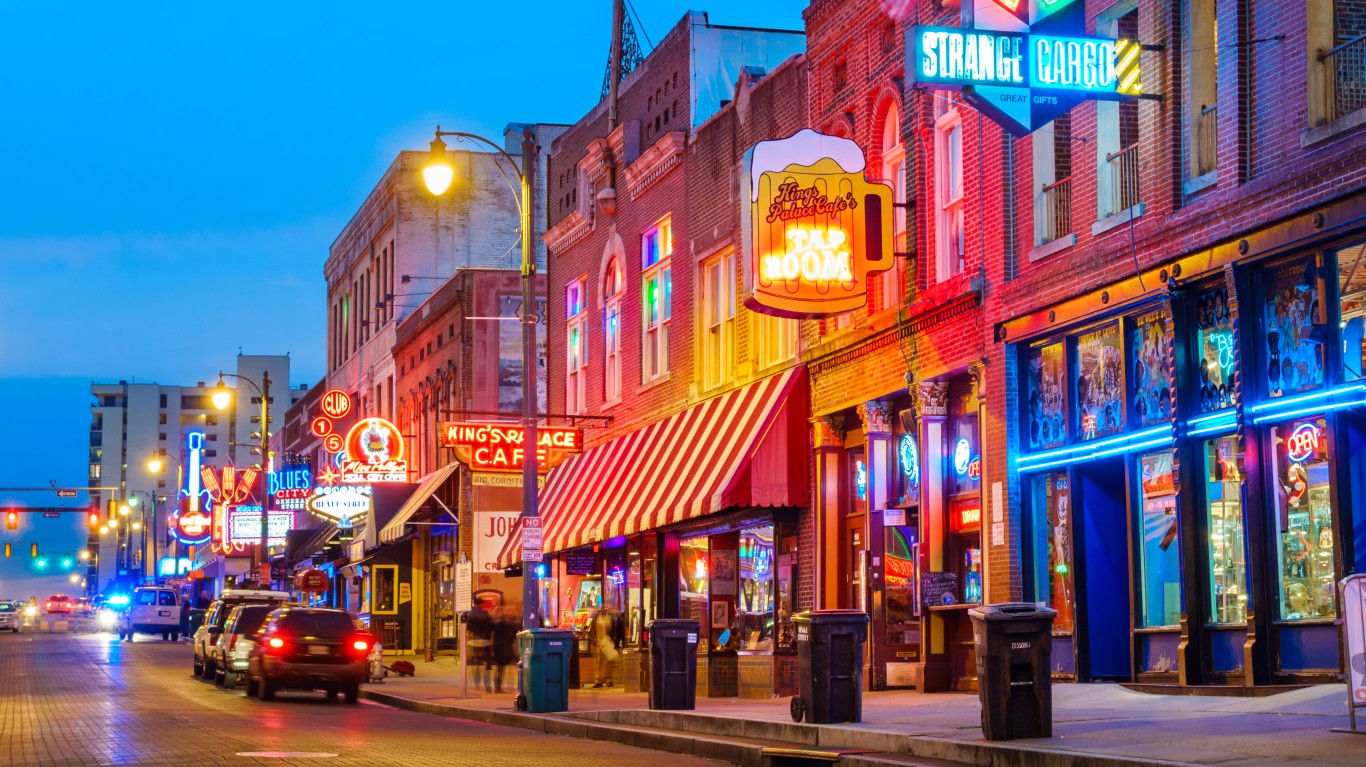
- Motor-vehicle fatality rate: 161.5 per 100,000 people 15 and older (128.0 per 100,000 statewide)
- Alcohol-related driving death rate: 21.5 per 100,000 people 15 and older (22.1 per 100,000 statewide)
- Vehicle theft rate in 2022: 845.7 per 100,000 people (337.9 per 100,000 statewide)
- Total vehicle thefts reported in 2022: 11,267 (23,830 statewide)
- Avg. commute time in 2022: : 23.9 minutes (25.5 minutes statewide)
- Metro areas considered in state: 10
Texas: Odessa
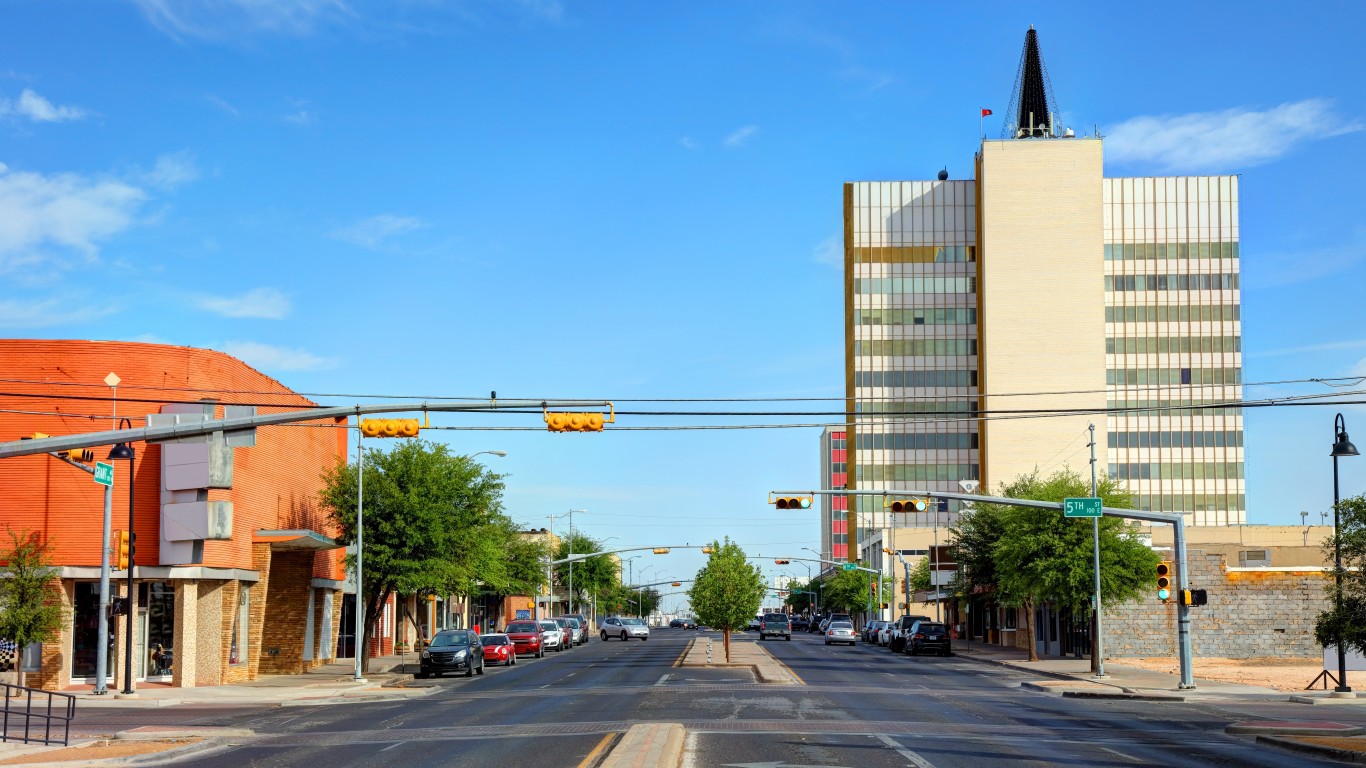
- Motor-vehicle fatality rate: 298.1 per 100,000 people 15 and older (109.4 per 100,000 statewide)
- Alcohol-related driving death rate: 76.0 per 100,000 people 15 and older (19.8 per 100,000 statewide)
- Vehicle theft rate in 2022: 430.2 per 100,000 people (350.1 per 100,000 statewide)
- Total vehicle thefts reported in 2022: 692 (105,133 statewide)
- Avg. commute time in 2022: : 23.9 minutes (26.7 minutes statewide)
- Metro areas considered in state: 25
Utah: Salt Lake City
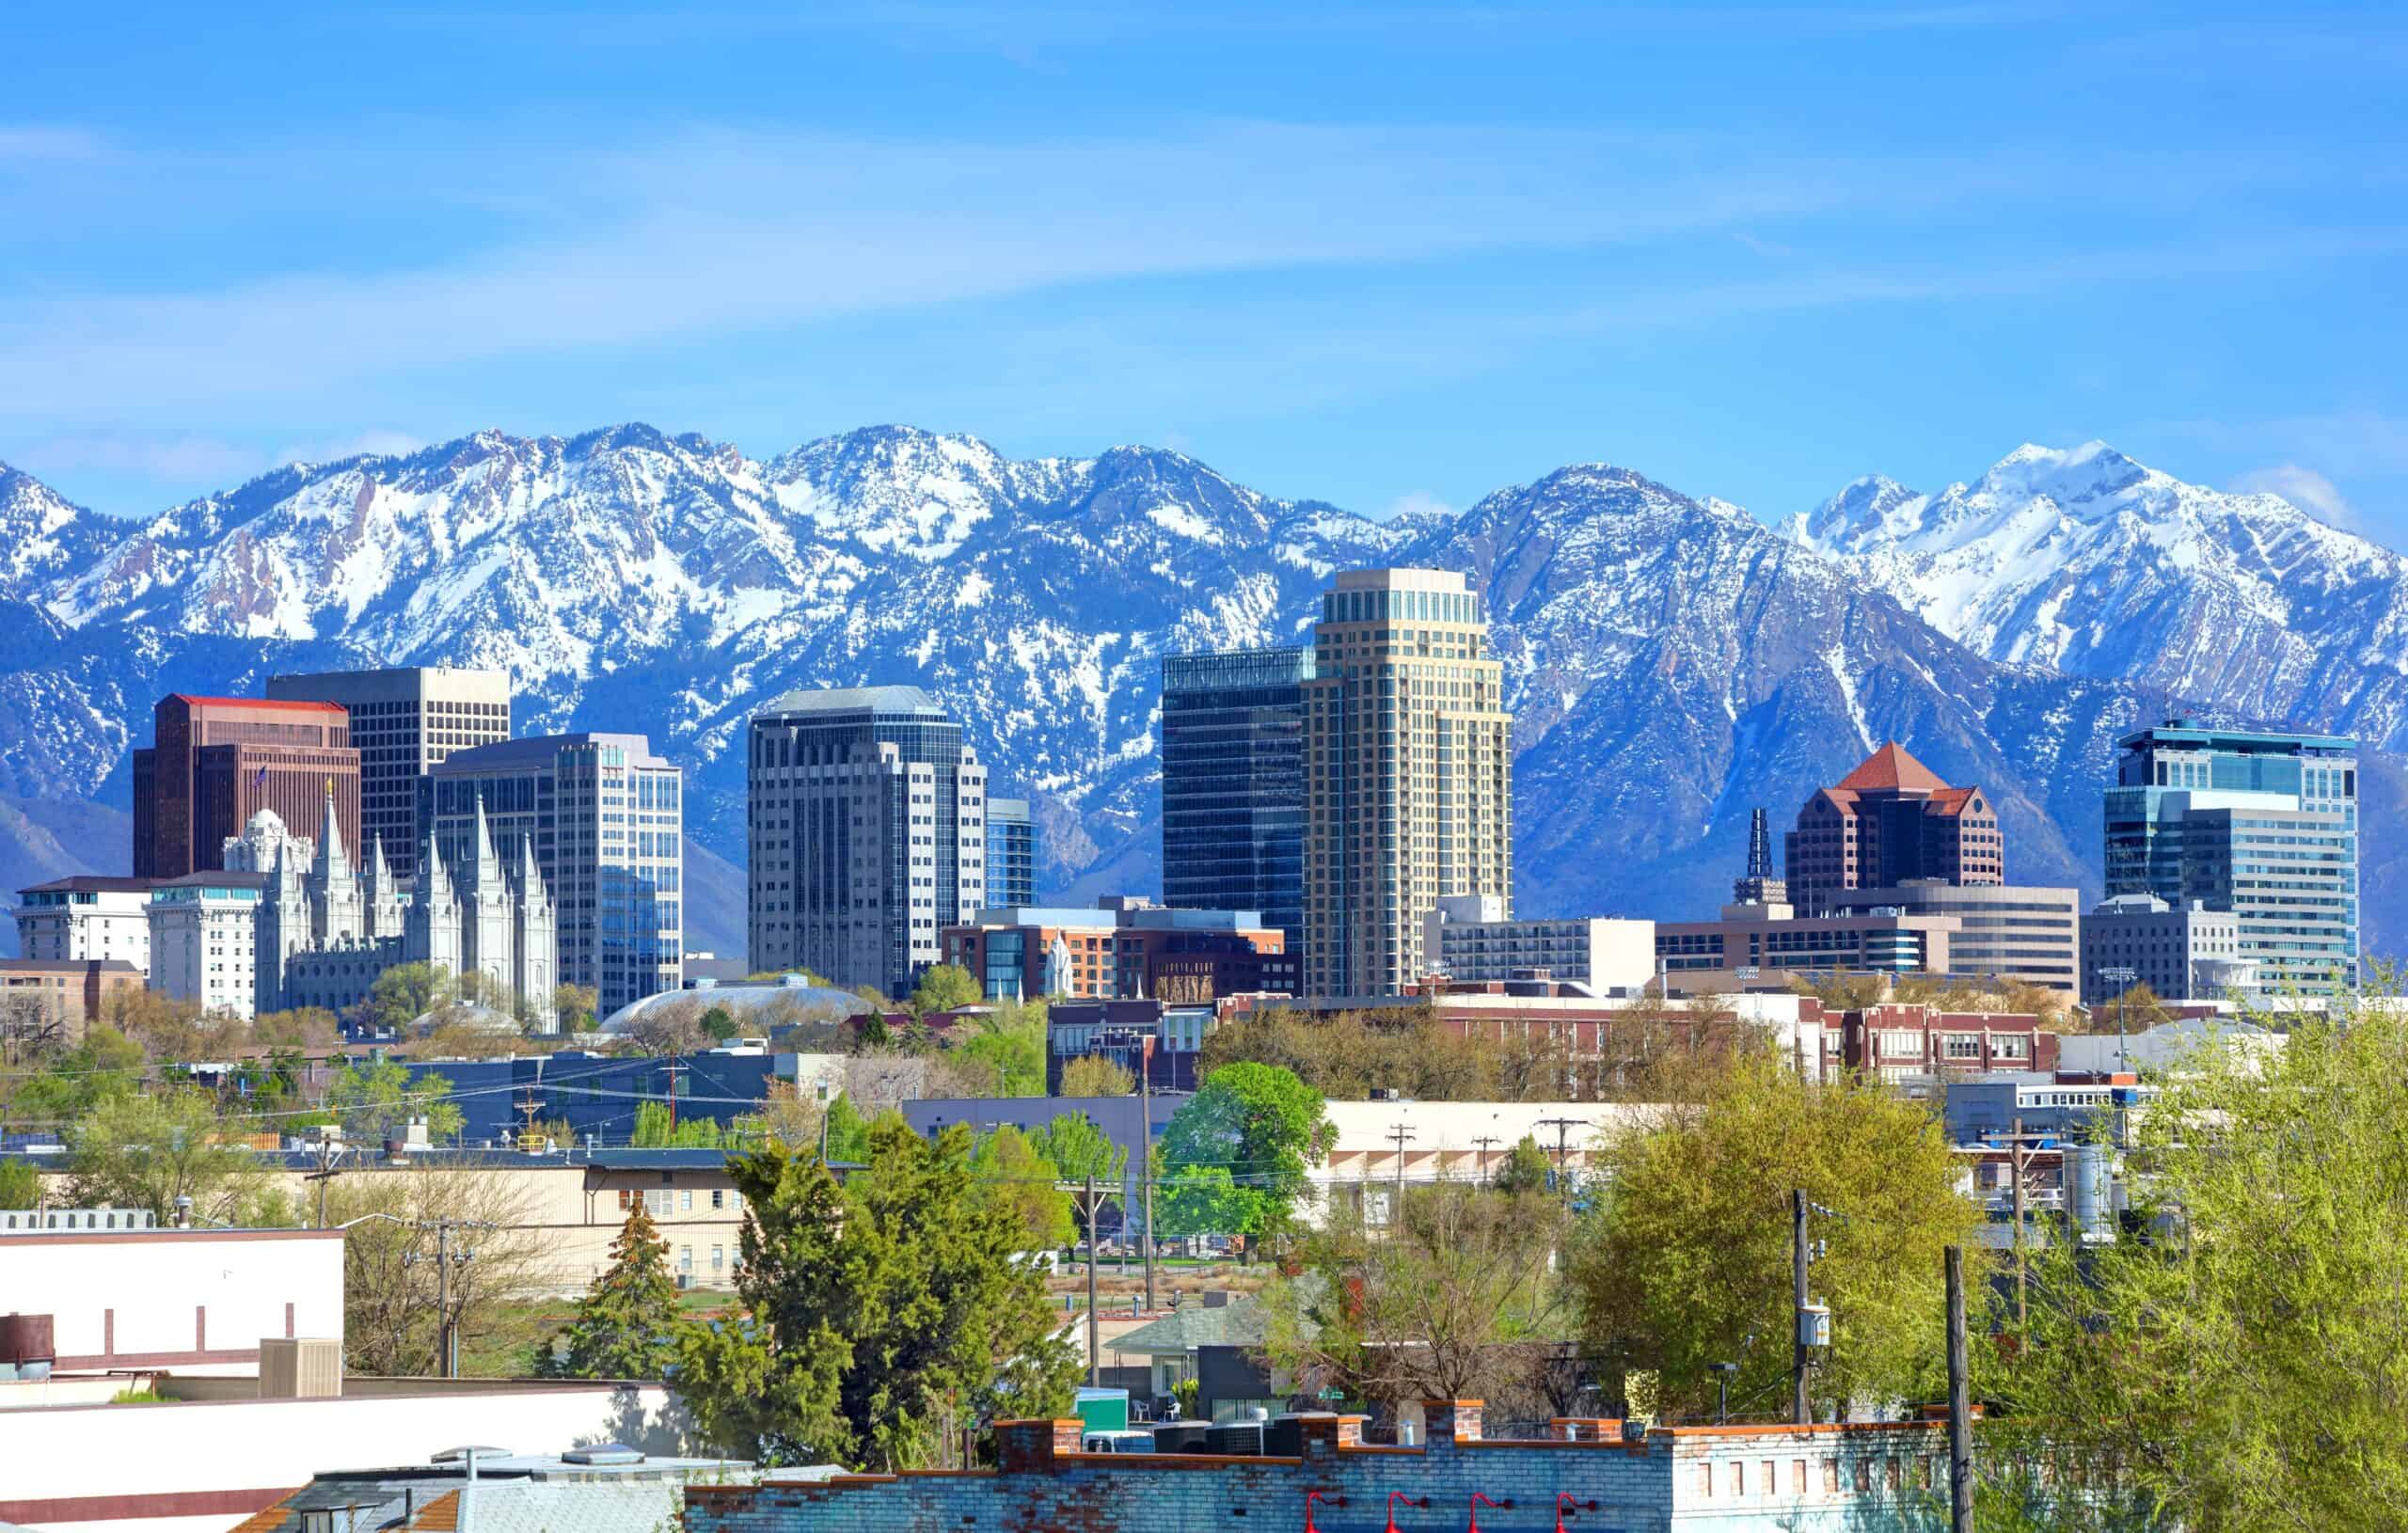
- Motor-vehicle fatality rate: 69.5 per 100,000 people 15 and older (69.8 per 100,000 statewide)
- Alcohol-related driving death rate: 10.7 per 100,000 people 15 and older (11.1 per 100,000 statewide)
- Vehicle theft rate in 2022: 379.0 per 100,000 people (209.5 per 100,000 statewide)
- Total vehicle thefts reported in 2022: 4,799 (7,082 statewide)
- Avg. commute time in 2022: : 22.8 minutes (21.6 minutes statewide)
- Metro areas considered in state: 5
Vermont: Burlington-South Burlington
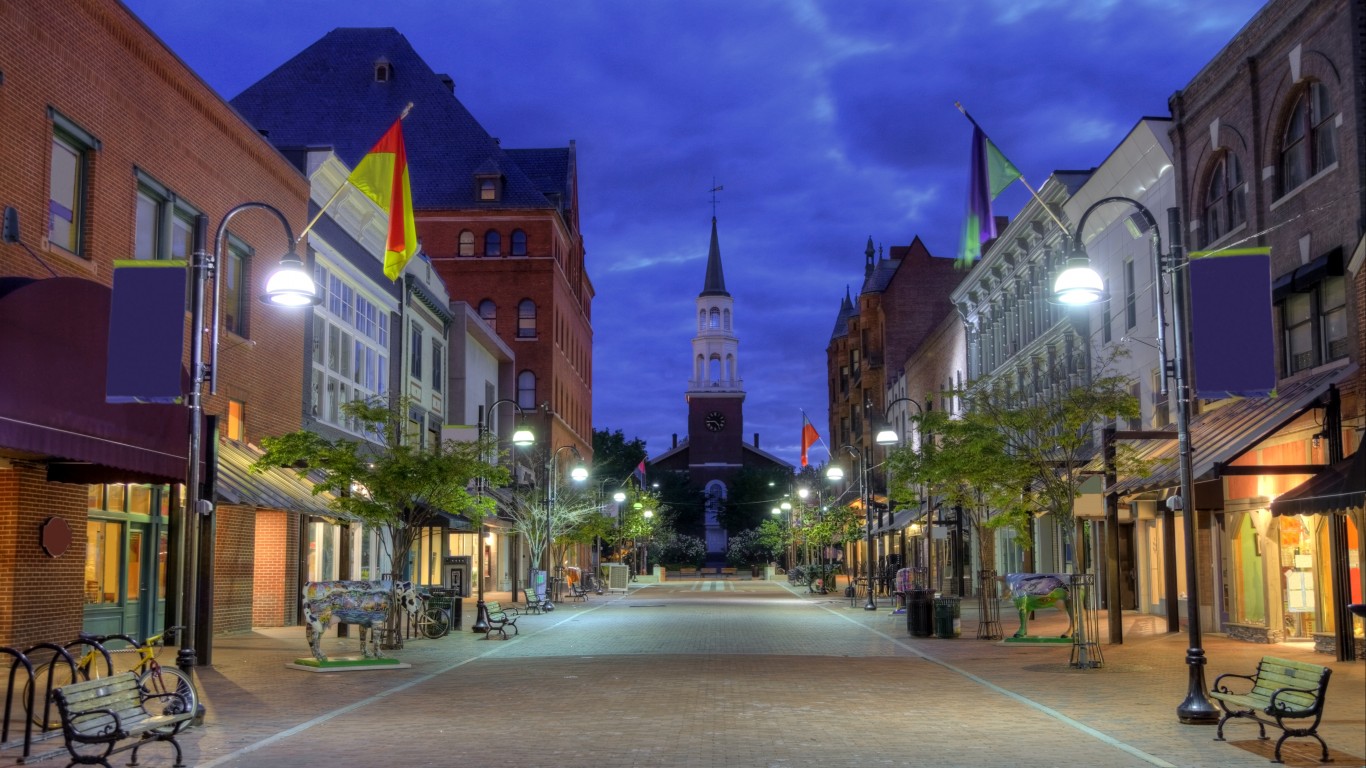
- Motor-vehicle fatality rate: 52.9 per 100,000 people 15 and older (73.0 per 100,000 statewide)
- Alcohol-related driving death rate: 12.3 per 100,000 people 15 and older (19.7 per 100,000 statewide)
- Vehicle theft rate in 2022: 268.6 per 100,000 people (160.6 per 100,000 statewide)
- Total vehicle thefts reported in 2022: 611 (1,039 statewide)
- Avg. commute time in 2022: : 22.1 minutes (23.2 minutes statewide)
- Metro areas considered in state: 1
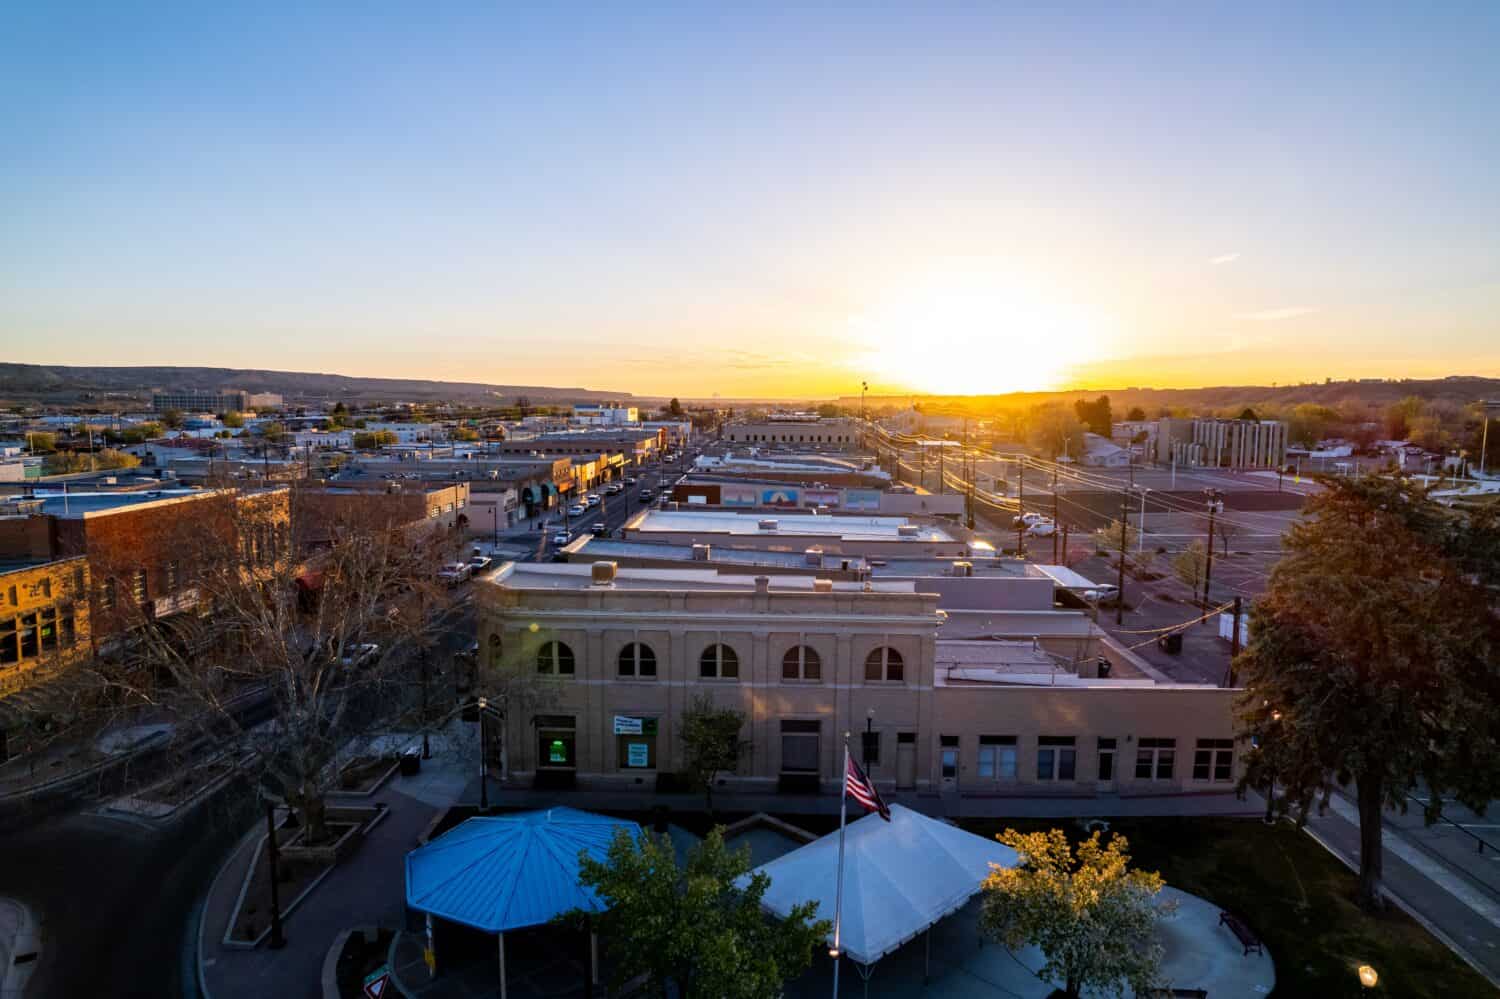
Virginia: Winchester
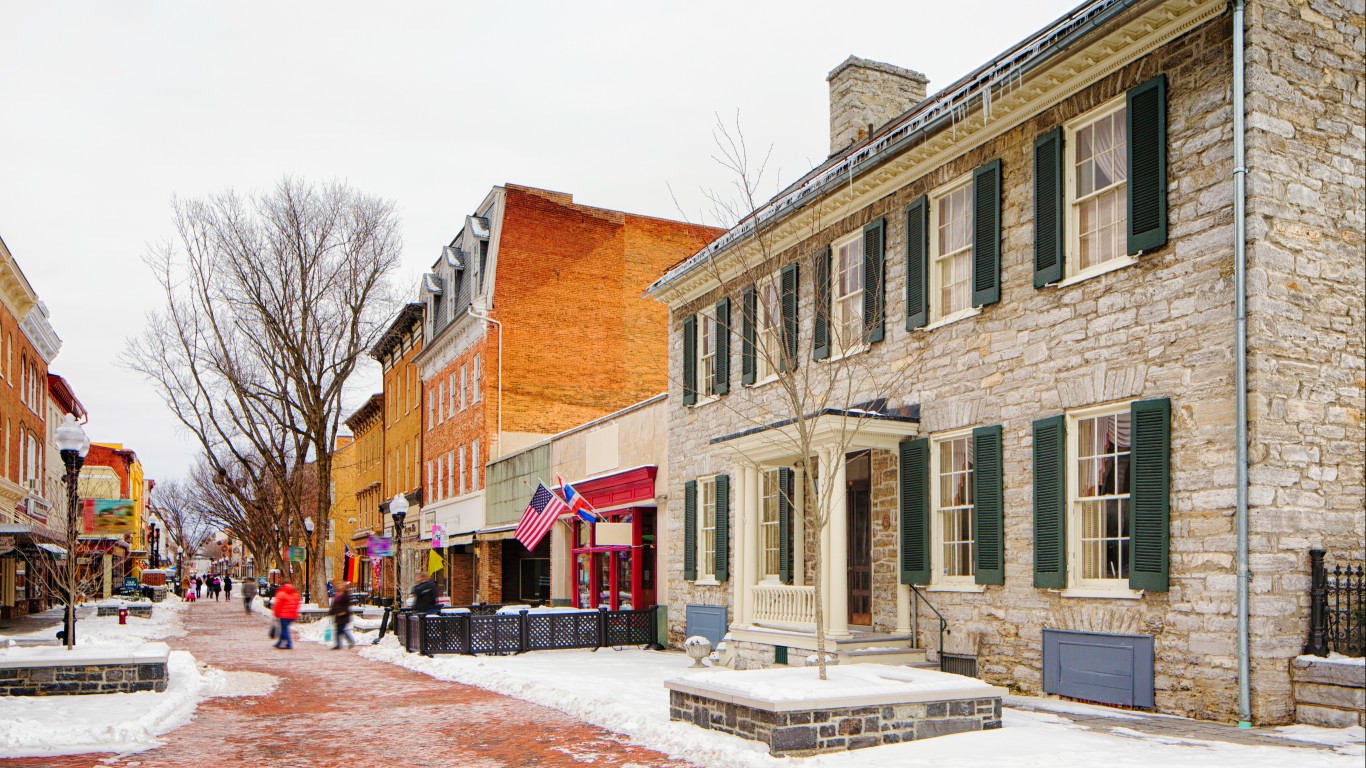
- Motor-vehicle fatality rate: 120.2 per 100,000 people 15 and older (82.0 per 100,000 statewide)
- Alcohol-related driving death rate: 28.6 per 100,000 people 15 and older (17.4 per 100,000 statewide)
- Vehicle theft rate in 2022: 62.8 per 100,000 people (164.2 per 100,000 statewide)
- Total vehicle thefts reported in 2022: 92 (14,256 statewide)
- Avg. commute time in 2022: : 30.6 minutes (27.1 minutes statewide)
- Metro areas considered in state: 9
Washington: Yakima
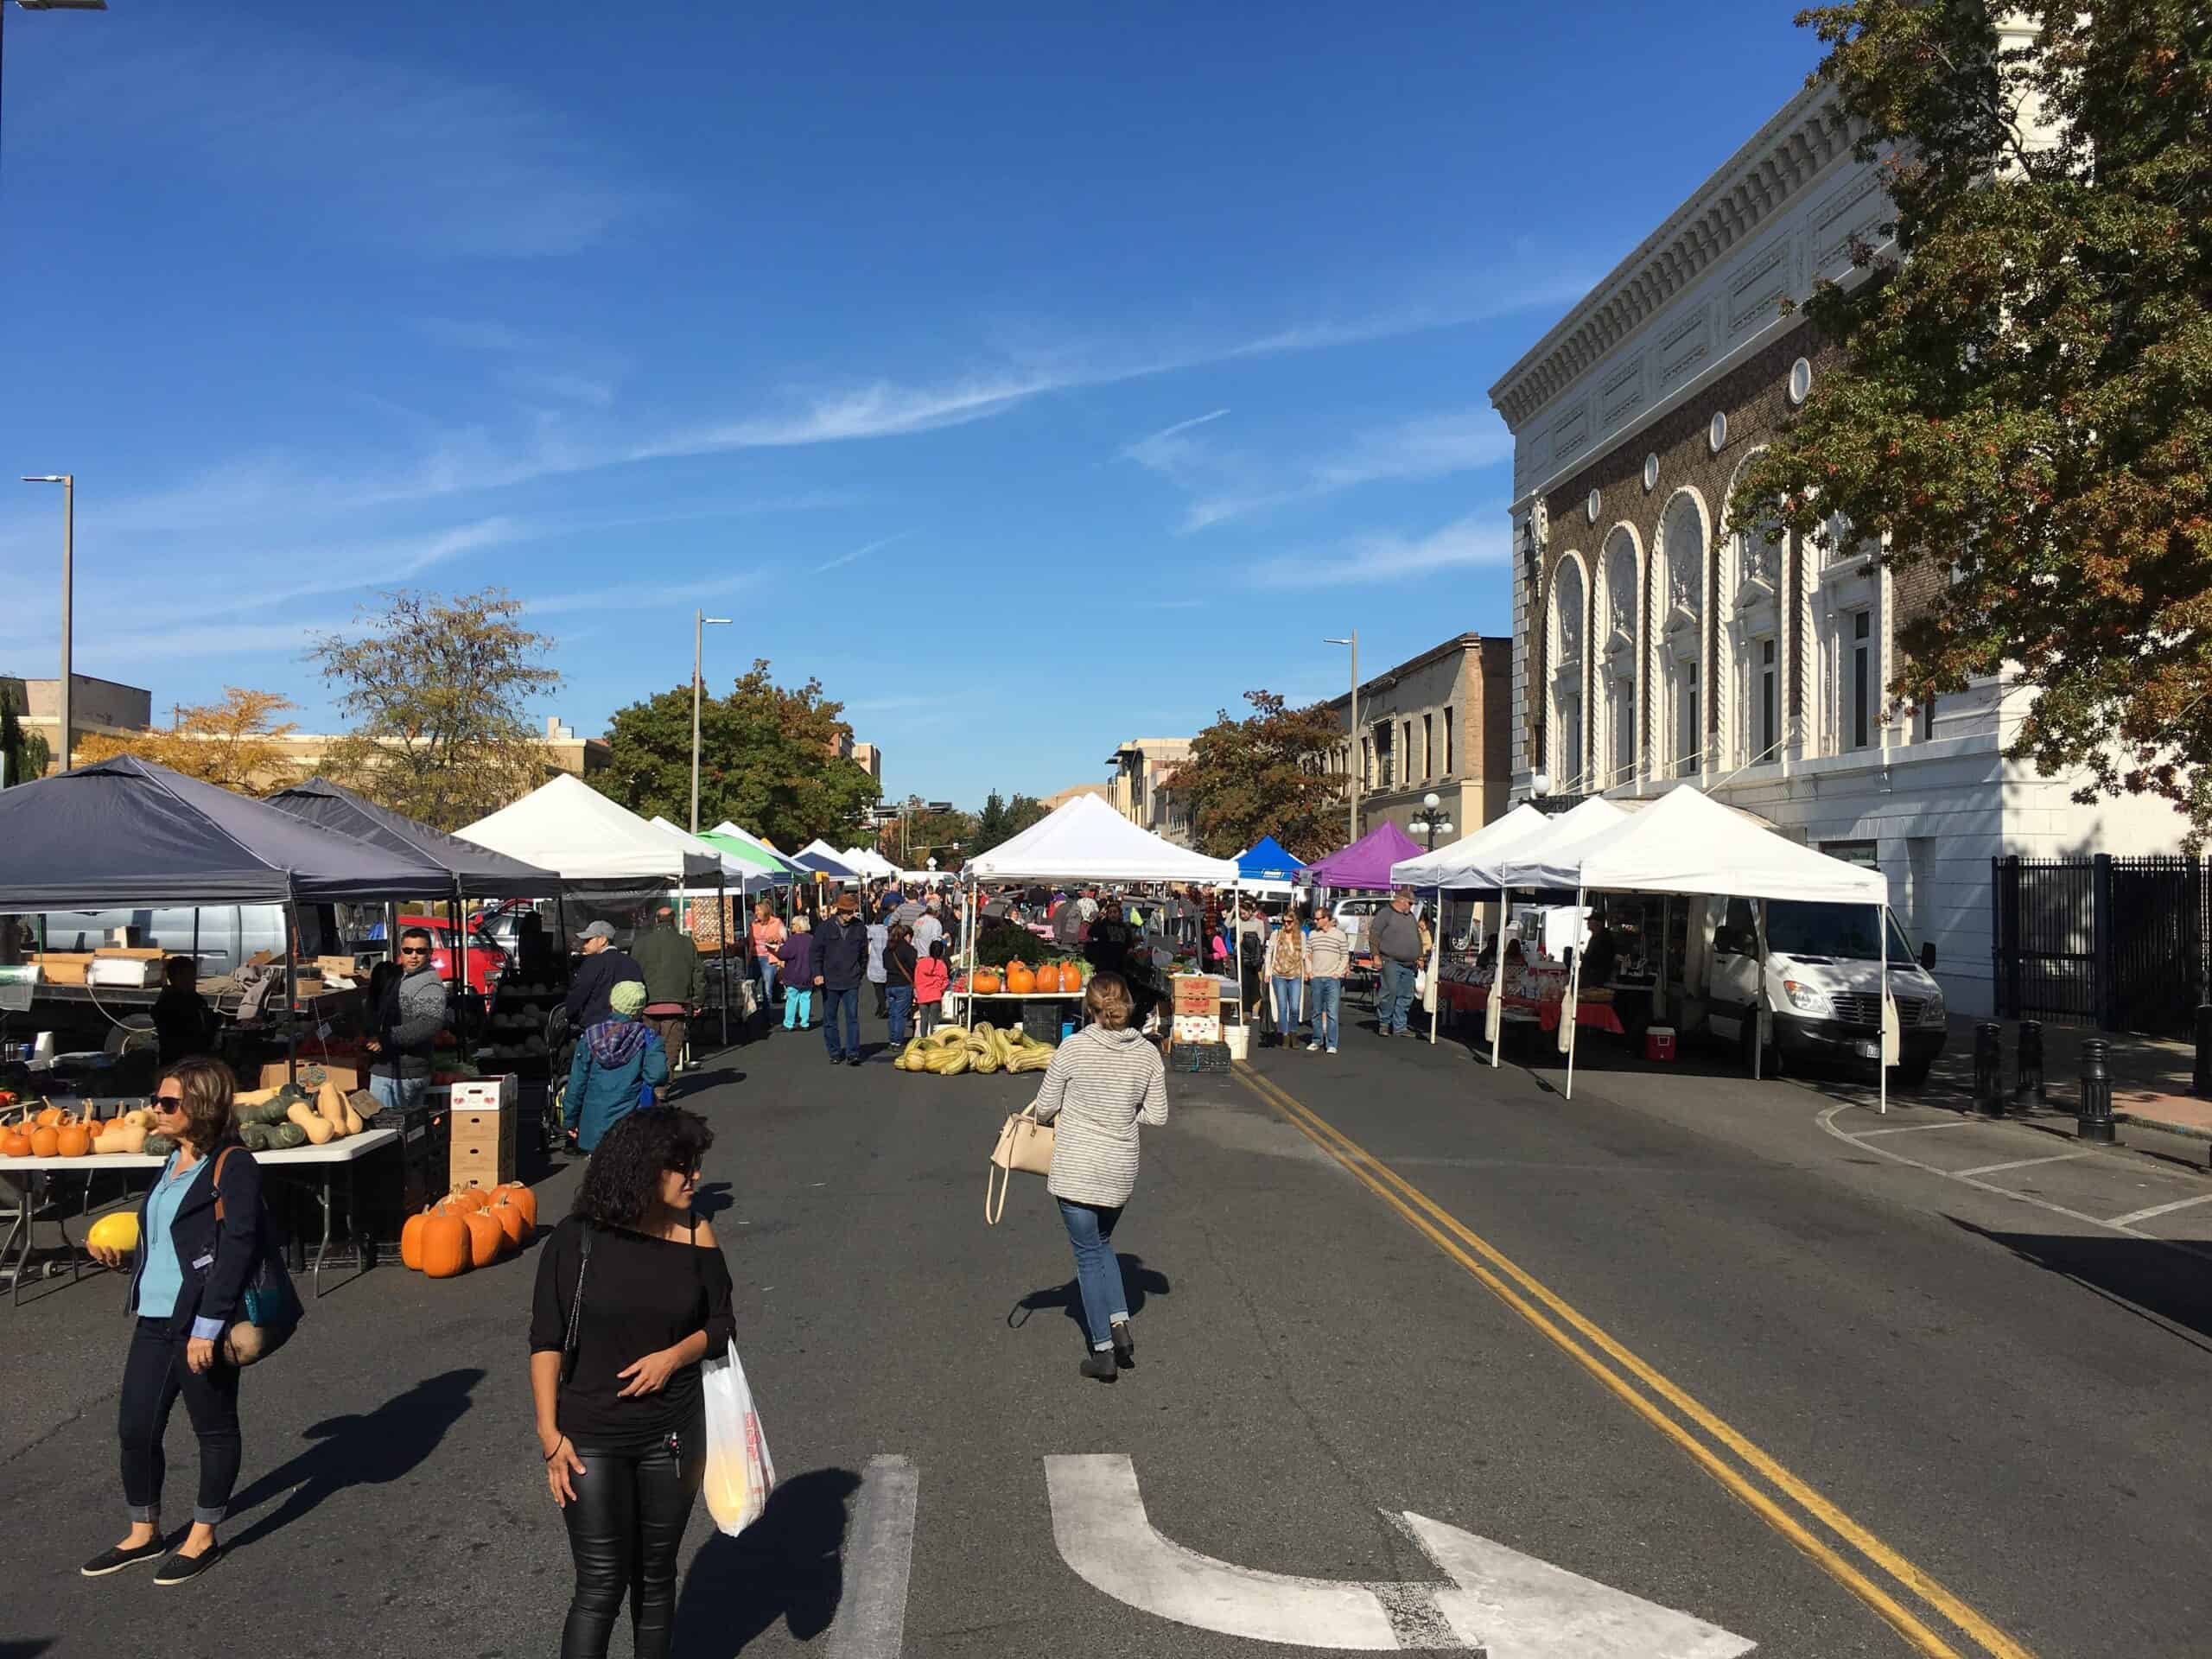
- Motor-vehicle fatality rate: 141.6 per 100,000 people 15 and older (66.1 per 100,000 statewide)
- Alcohol-related driving death rate: 33.6 per 100,000 people 15 and older (13.9 per 100,000 statewide)
- Vehicle theft rate in 2022: 532.7 per 100,000 people (603.5 per 100,000 statewide)
- Total vehicle thefts reported in 2022: 1,369 (46,990 statewide)
- Avg. commute time in 2022: : 19.6 minutes (26.3 minutes statewide)
- Metro areas considered in state: 11
West Virginia: Charleston
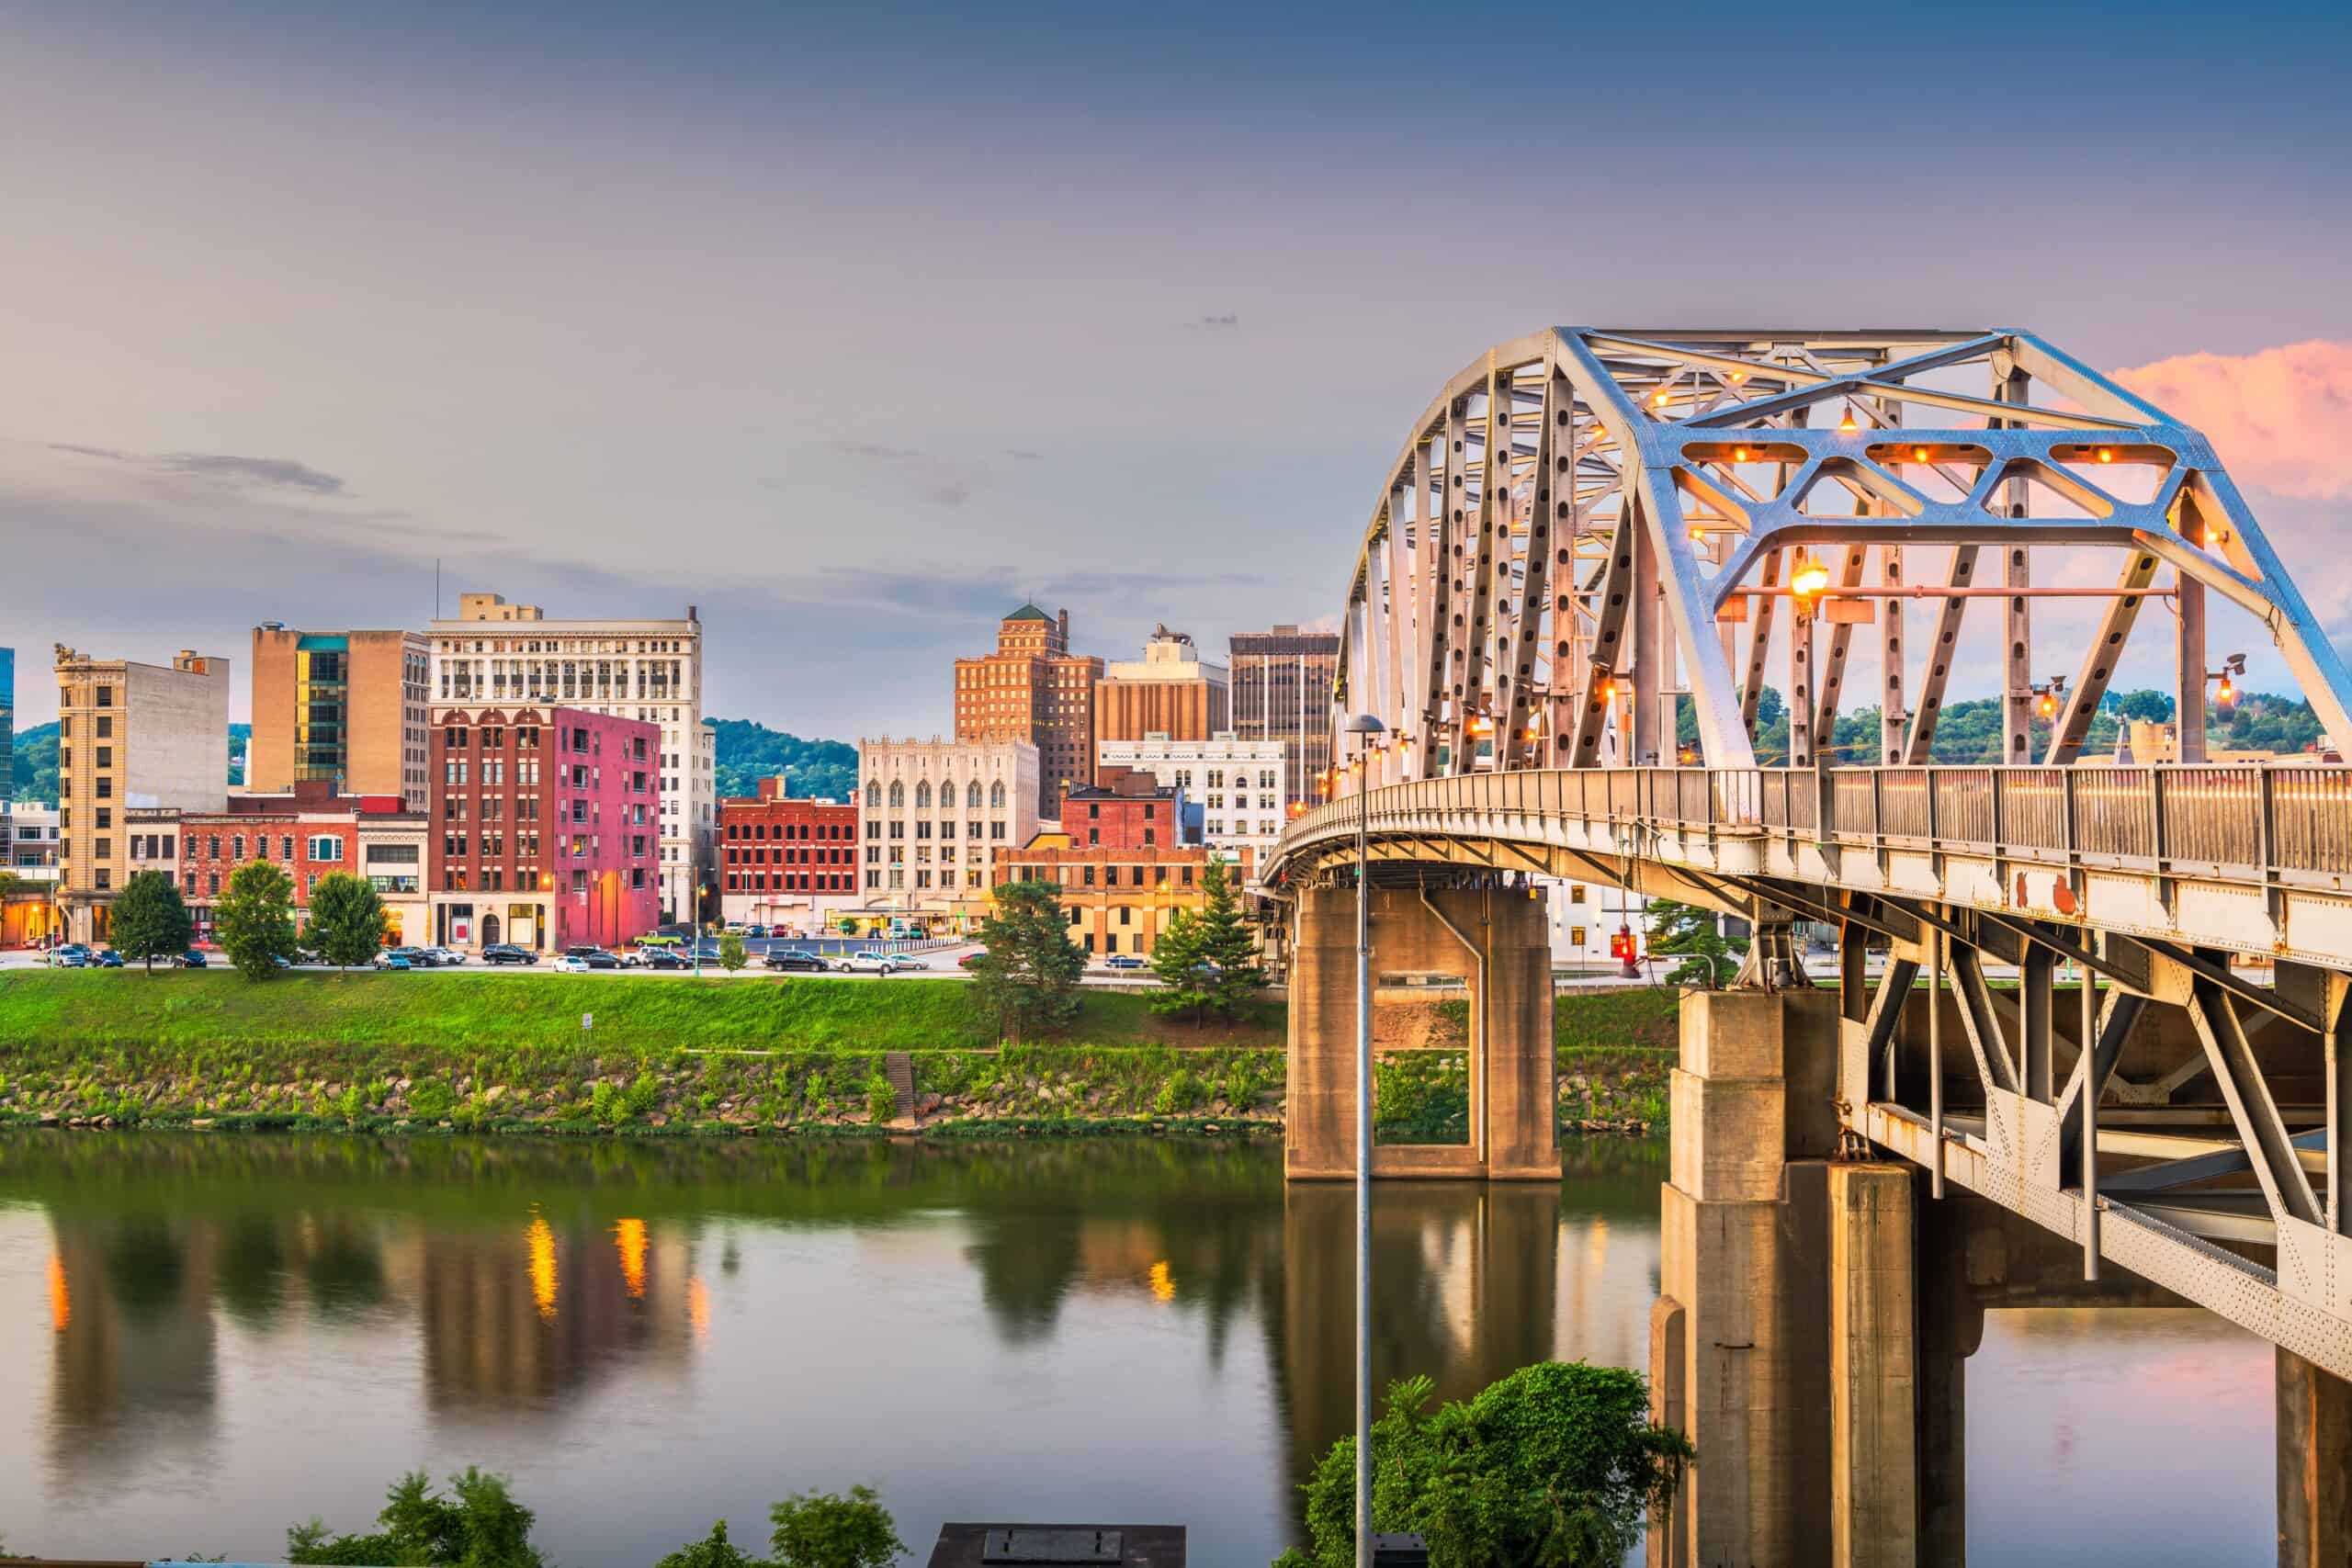
- Motor-vehicle fatality rate: 145.3 per 100,000 people 15 and older (136.0 per 100,000 statewide)
- Alcohol-related driving death rate: 19.7 per 100,000 people 15 and older (24.5 per 100,000 statewide)
- Vehicle theft rate in 2022: 208.8 per 100,000 people (115.3 per 100,000 statewide)
- Total vehicle thefts reported in 2022: 526 (2,046 statewide)
- Avg. commute time in 2022: : 26.4 minutes (26.9 minutes statewide)
- Metro areas considered in state: 7
Wisconsin: Janesville-Beloit
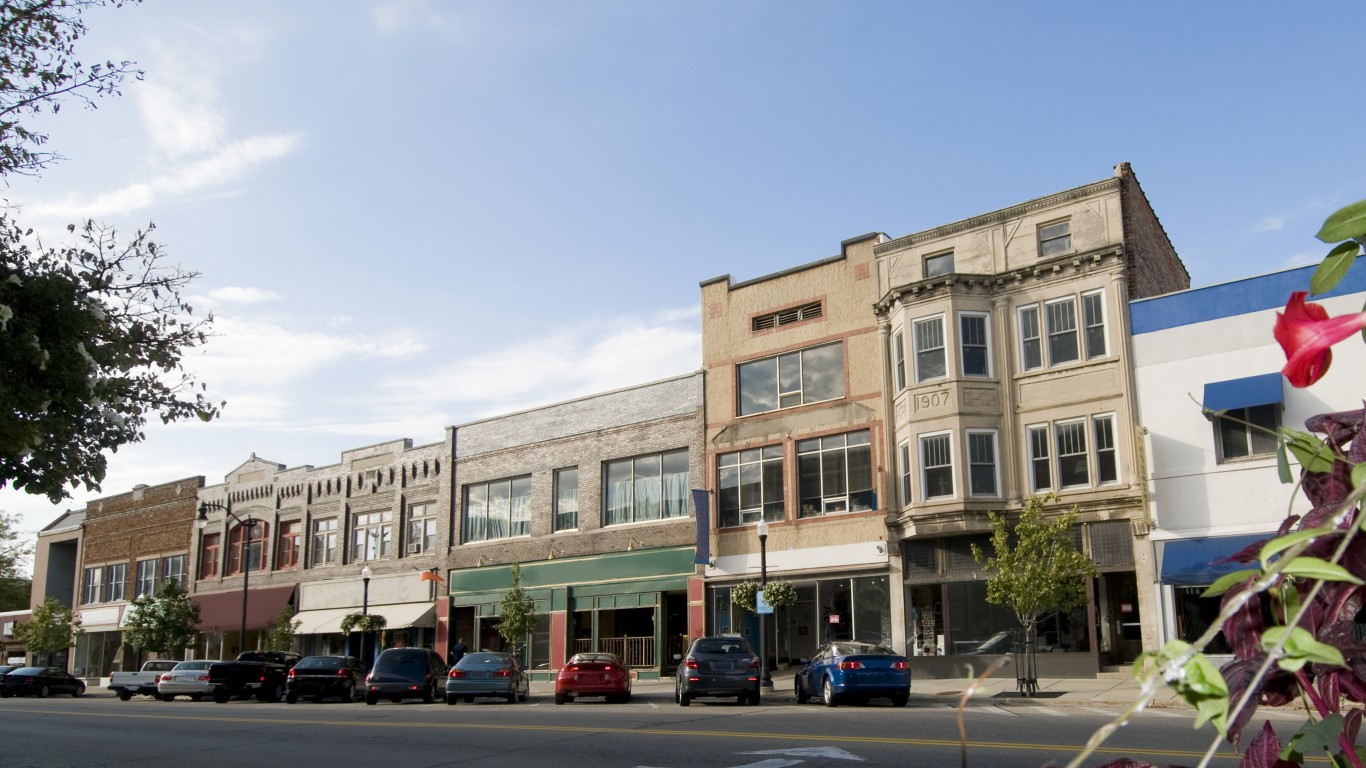
- Motor-vehicle fatality rate: 95.6 per 100,000 people 15 and older (84.4 per 100,000 statewide)
- Alcohol-related driving death rate: 36.3 per 100,000 people 15 and older (21.8 per 100,000 statewide)
- Vehicle theft rate in 2022: 140.8 per 100,000 people (198.7 per 100,000 statewide)
- Total vehicle thefts reported in 2022: 231 (11,709 statewide)
- Avg. commute time in 2022: : 23.9 minutes (22.2 minutes statewide)
- Metro areas considered in state: 12
Wyoming: Cheyenne
- Motor-vehicle fatality rate: 119.5 per 100,000 people 15 and older (155.0 per 100,000 statewide)
- Alcohol-related driving death rate: 26.8 per 100,000 people 15 and older (41.5 per 100,000 statewide)
- Vehicle theft rate in 2022: 283.0 per 100,000 people (132.4 per 100,000 statewide)
- Total vehicle thefts reported in 2022: 285 (770 statewide)
- Avg. commute time in 2022: : 16.3 minutes (18.0 minutes statewide)
- Metro areas considered in state: 2
The Average American Has No Idea How Much Money You Can Make Today (Sponsor)
The last few years made people forget how much banks and CD’s can pay. Meanwhile, interest rates have spiked and many can afford to pay you much more, but most are keeping yields low and hoping you won’t notice.
But there is good news. To win qualified customers, some accounts are paying almost 10x the national average! That’s an incredible way to keep your money safe and earn more at the same time. Our top pick for high yield savings accounts includes other benefits as well. You can earn up to 3.80% with a Checking & Savings Account today Sign up and get up to $300 with direct deposit. No account fees. FDIC Insured.
Click here to see how much more you could be earning on your savings today. It takes just a few minutes to open an account to make your money work for you.
Our top pick for high yield savings accounts includes other benefits as well. You can earn up to 4.00% with a Checking & Savings Account from Sofi. Sign up and get up to $300 with direct deposit. No account fees. FDIC Insured.
Thank you for reading! Have some feedback for us?
Contact the 24/7 Wall St. editorial team.
Latest from 24/7


Our expert who first called NVIDIA in 2009 is predicting 2025 will see a historic AI breakthrough.
You can follow him investing $500,000 of his own money on our top AI stocks for free.