24/7 Wall St. Insights
- Traffic can reduce your overall quality-of-life, increase gas prices, harm your car, and cause environmental damage.
- Also: 2 Dividend Legends to Hold Forever
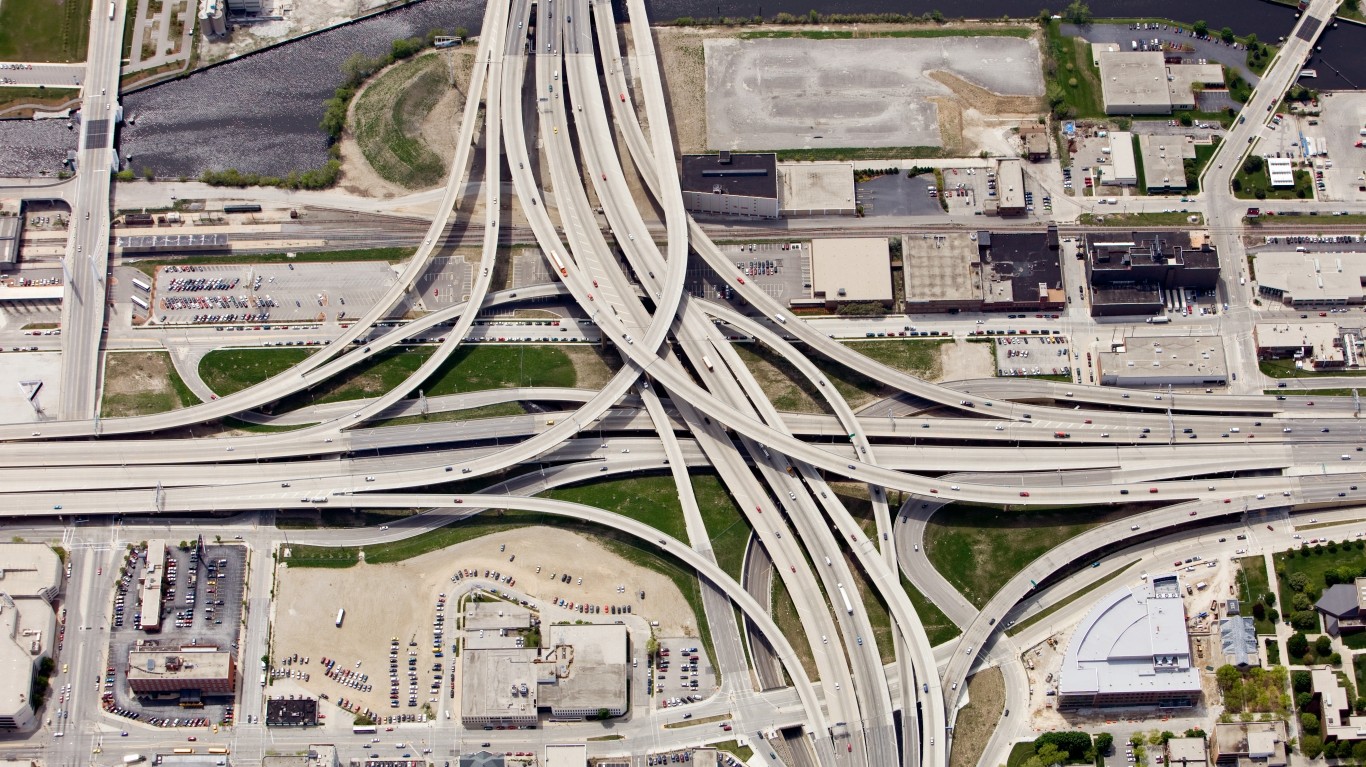
Traffic congestion isn’t equal in every state. But knowing where traffic can be the worst is important, as sitting in long lines of cars can slowly damage your vehicle over time. Traffic also contributes to worsening pollution and reduces an area’s economic health, as it can make people late for work or school, and lead to other issues down the line. In some areas, though, congestion is hard to avoid because of smaller roadways or population growth without infrastructure improvement. (Here are the states with the worst highways.)
To identify the state with the worst traffic congestion in America, 24/7 Wall St. reviewed libertarian Reason Foundation’s 28th Annual Highway Report, which provides data for 2022. The report includes a congestion measure from INRIX’s 2023 Global Traffic Scorecard. The measure, annual hours of delay per auto commuter, evaluates “the extra travel time endured throughout the year by auto commuters who make trips during the peak period” in urbanized areas. As of the time of publication, this is the most recent data available.
24/7 Wall St. ranked states from the least amount of time delayed while sitting in peak-hour congestion, to the most amount of time delayed. As it highly correlates to traffic congestion, we also added population density per square mile of land of each state from the Census Bureau.
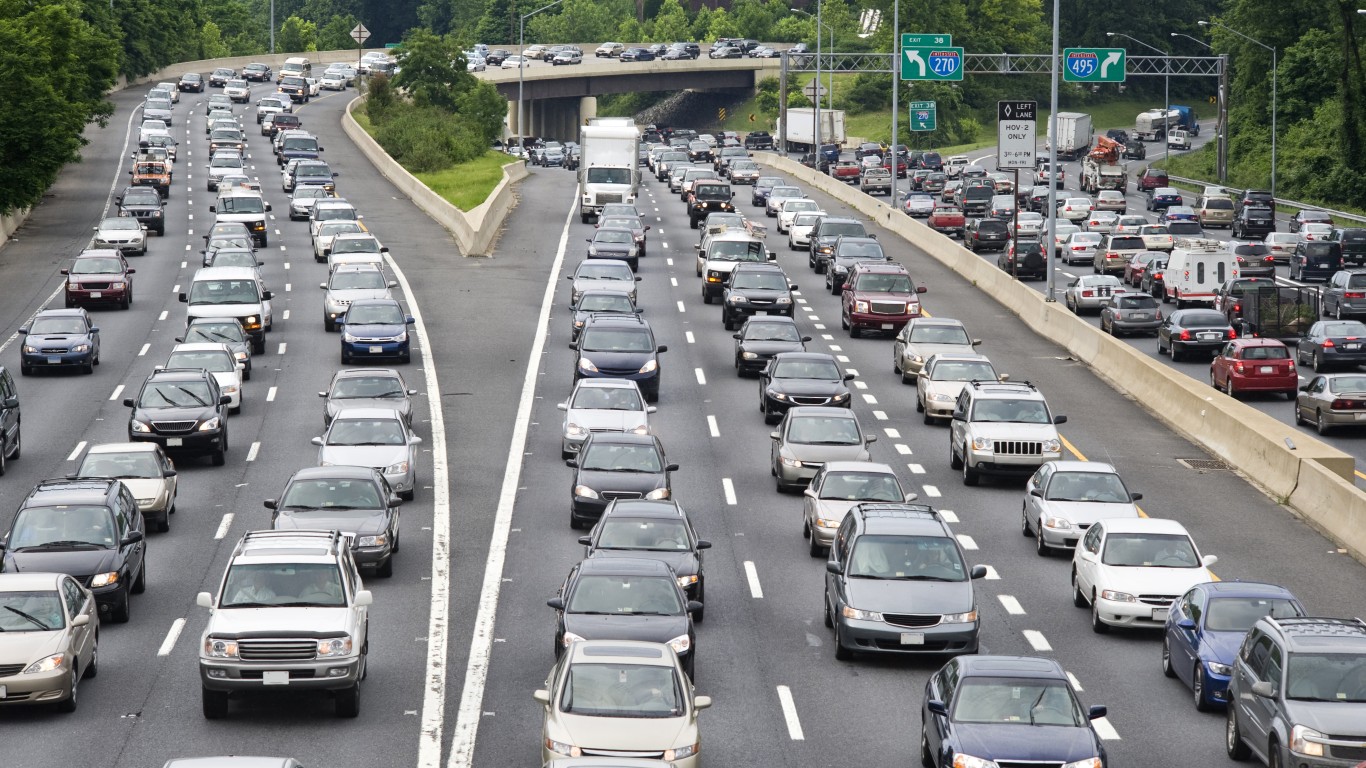
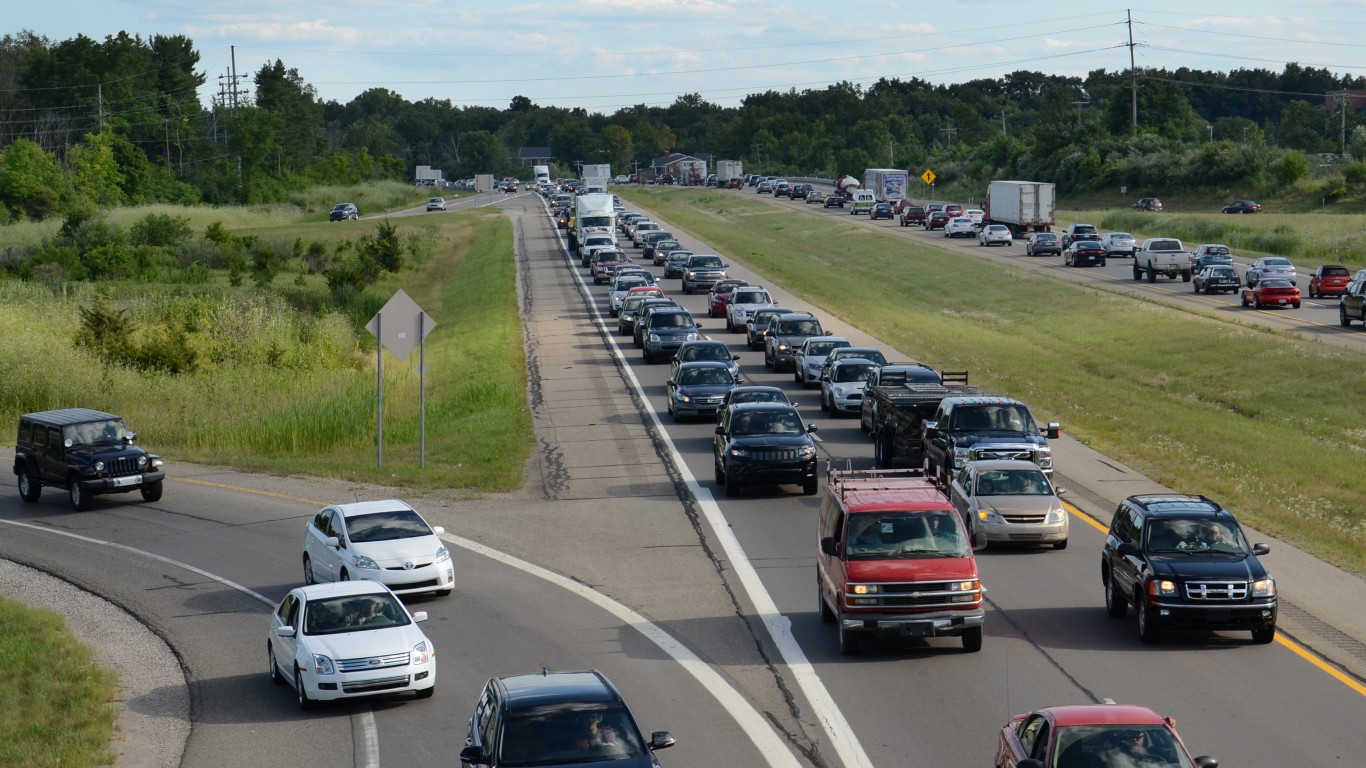
Nationwide, commuters spent an average of 41.33 hours driving in congested traffic in urbanized areas in 2022. The congestion problem is naturally primarily concentrated in major cities, and states that have larger metropolitan areas tend to rank lower on the list. While commuters in eleven states spent fewer than 10 hours sitting in peak-hour congestion, and commuters in 37 other states spent less than 40 hours, commuters in New Jersey, Delaware, and Massachusetts spent more than 80 hours of delay per year in traffic congestion. If you’re looking to move and really hate traffic, these probably are not the states for you.
This post was updated on August 28, 2025 to include the most up-to-date information.
Why We’re Covering This

Dealing with traffic might be annoying, but it also has some pretty serious environmental and economic effects. Quality-of-life may also suffer, with traffic making it difficult to get around. By looking at the states where traffic congestion is worst, you can see where urban planning and infrastructure improvements are needed.
50. North Dakota

- Annual peak hours spent in congestion per auto commuter: 4.23
49. Maine
- Annual peak hours spent in congestion per auto commuter: 6.65
48. Iowa
- Annual peak hours spent in congestion per auto commuter: 6.73
47. Arkansas
- Annual peak hours spent in congestion per auto commuter: 6.93
46. Kansas
- Annual peak hours spent in congestion per auto commuter: 7.1
45. Mississippi
- Annual peak hours spent in congestion per auto commuter: 7.3
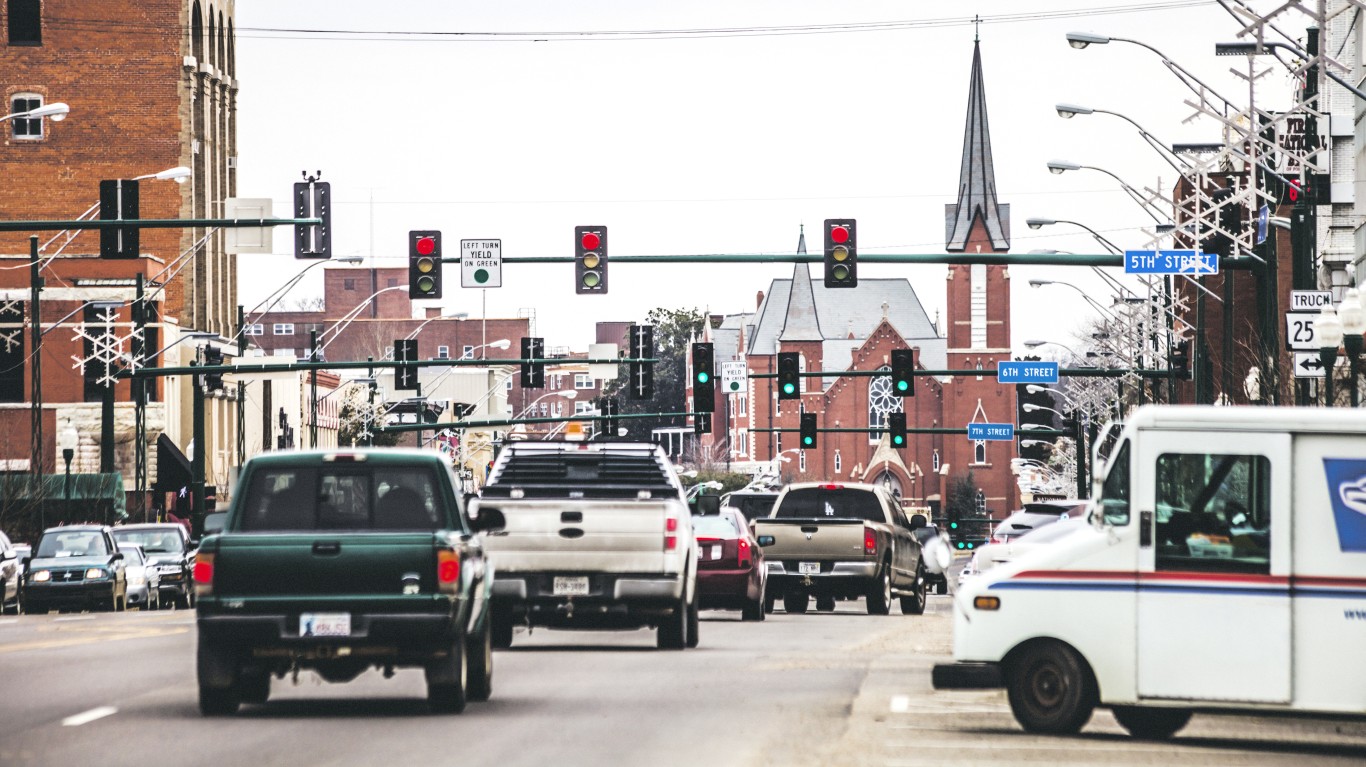
44. Idaho
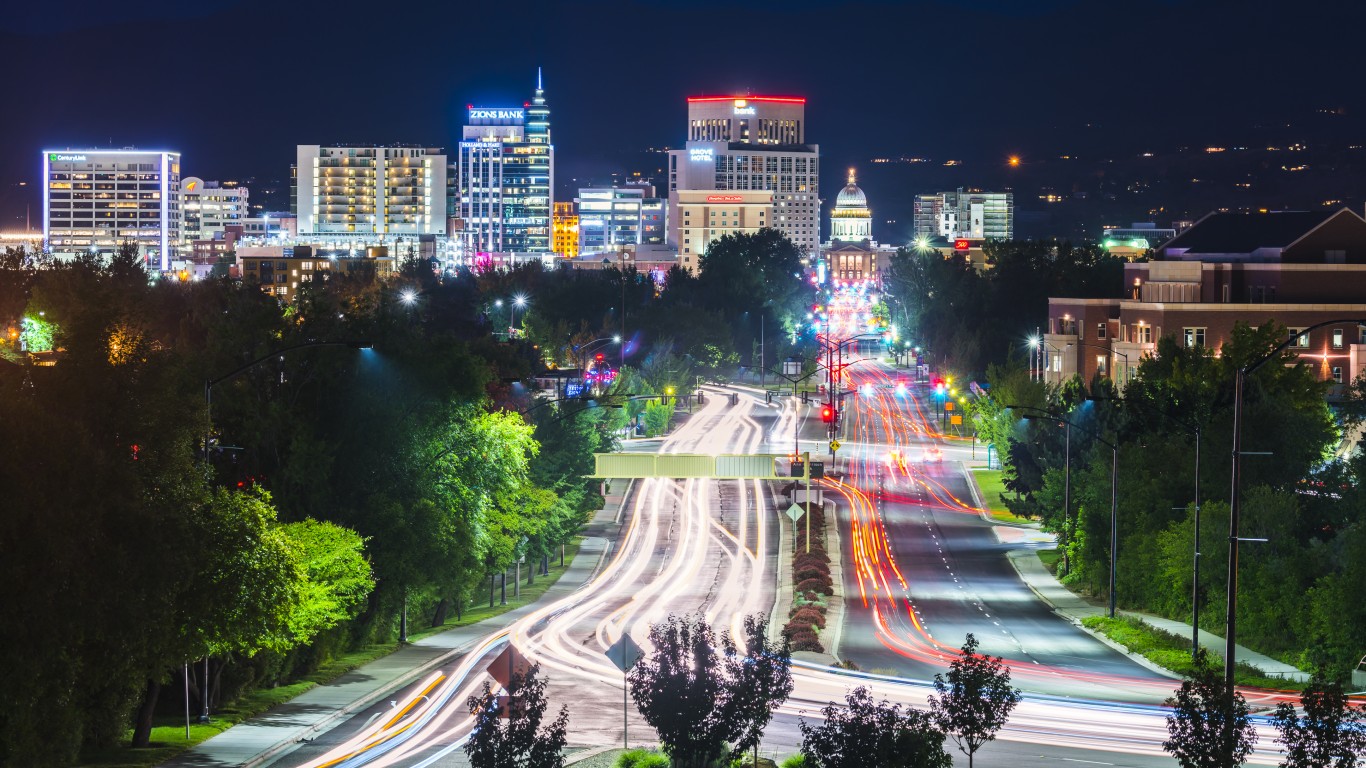
- Annual peak hours spent in congestion per auto commuter: 7.45
43. Wyoming
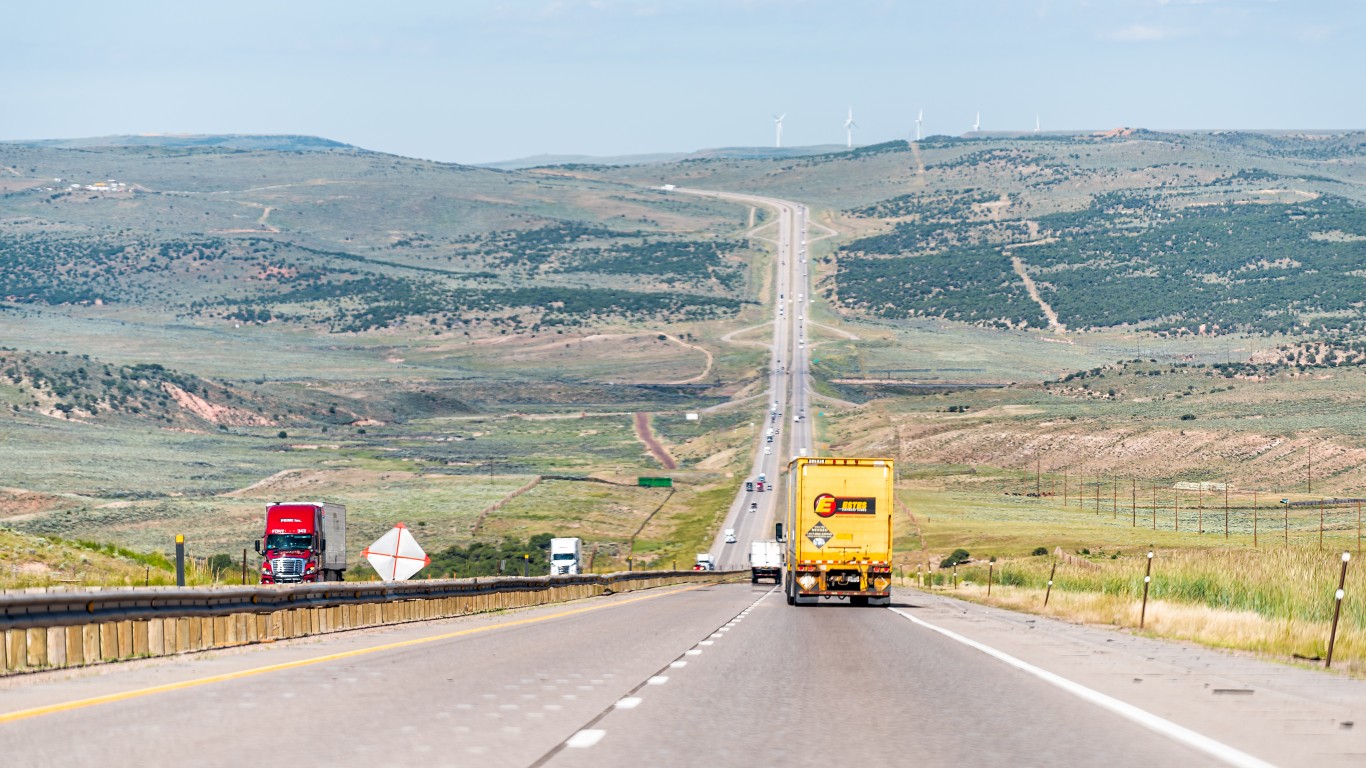
- Annual peak hours spent in congestion per auto commuter: 7.74
42. Vermont
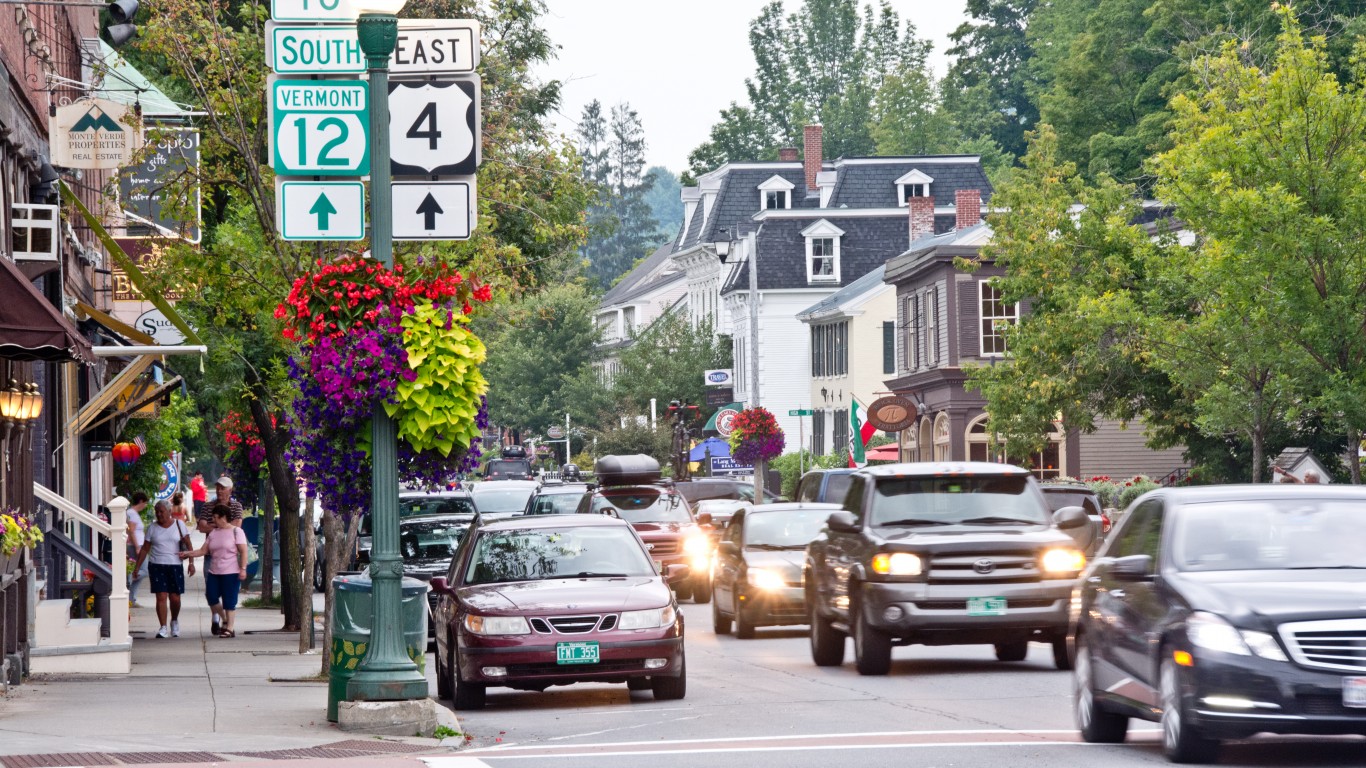
- Annual peak hours spent in congestion per auto commuter: 9.15
41. West Virginia
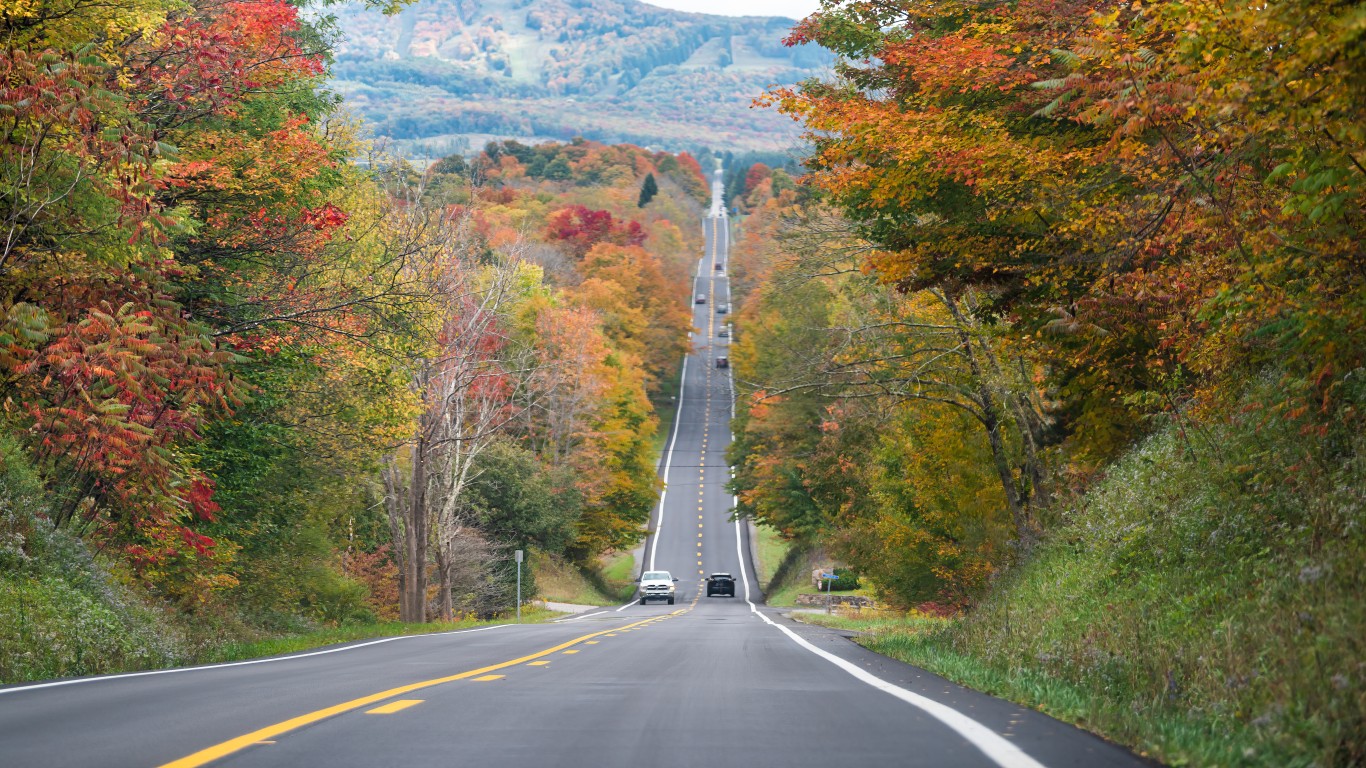
- Annual peak hours spent in congestion per auto commuter: 9.2
40. South Dakota
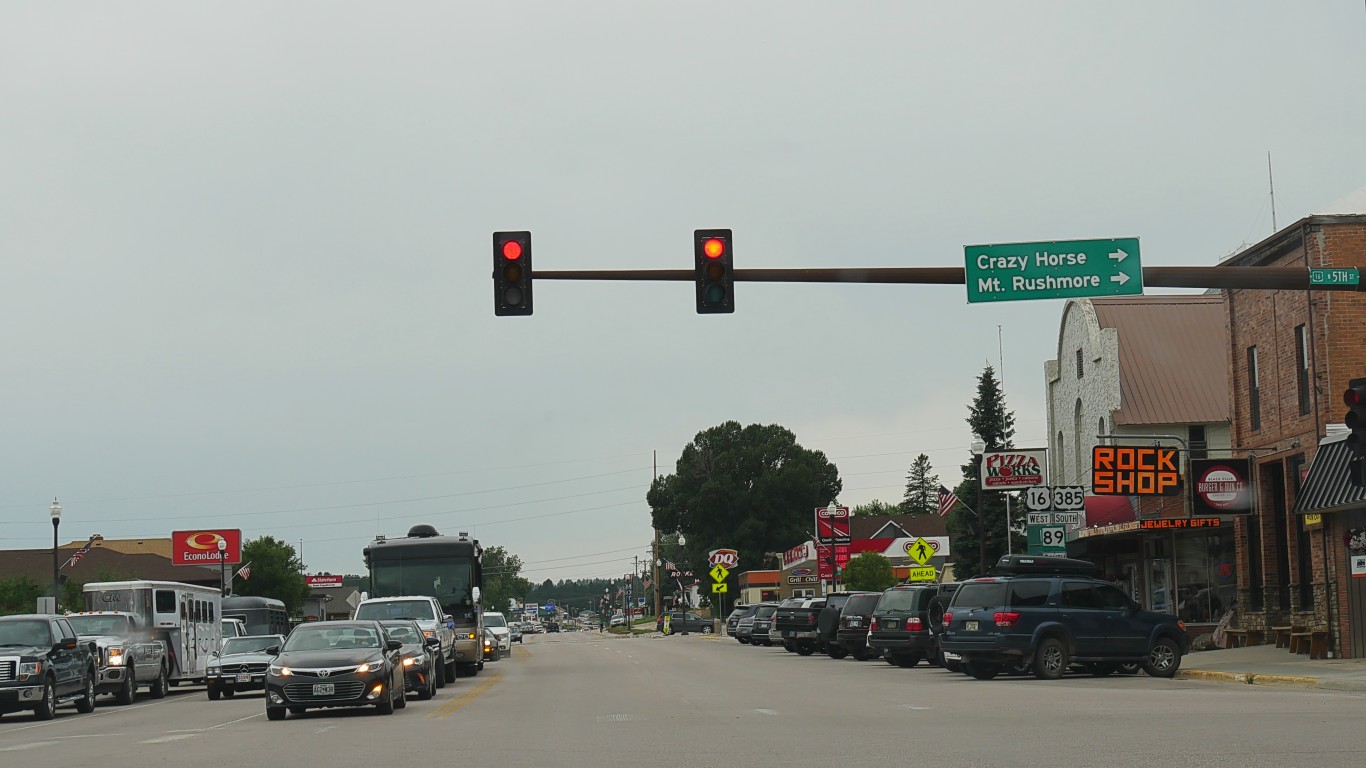
- Annual peak hours spent in congestion per auto commuter: 9.62
39. Oklahoma
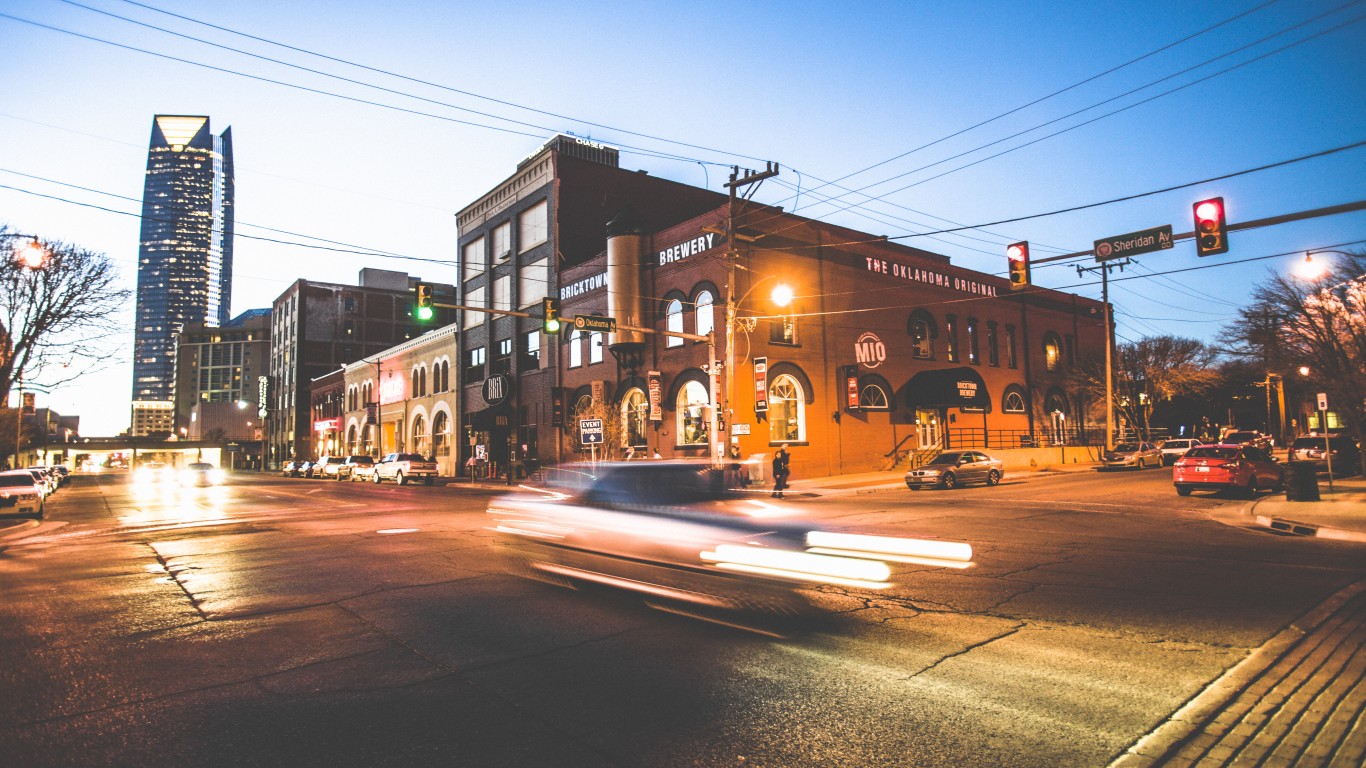
- Annual peak hours spent in congestion per auto commuter: 10.12
38. Alaska
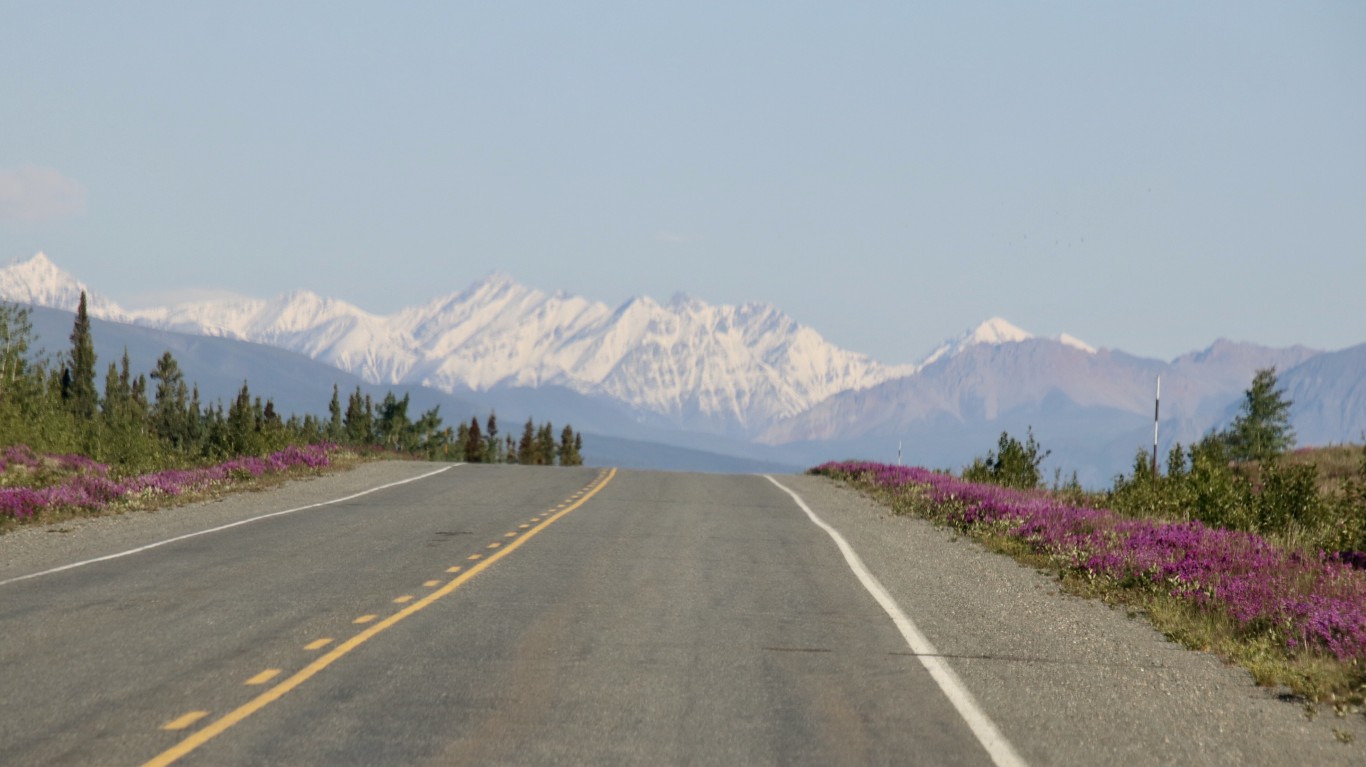
- Annual peak hours spent in congestion per auto commuter: 10.16
37. Ohio
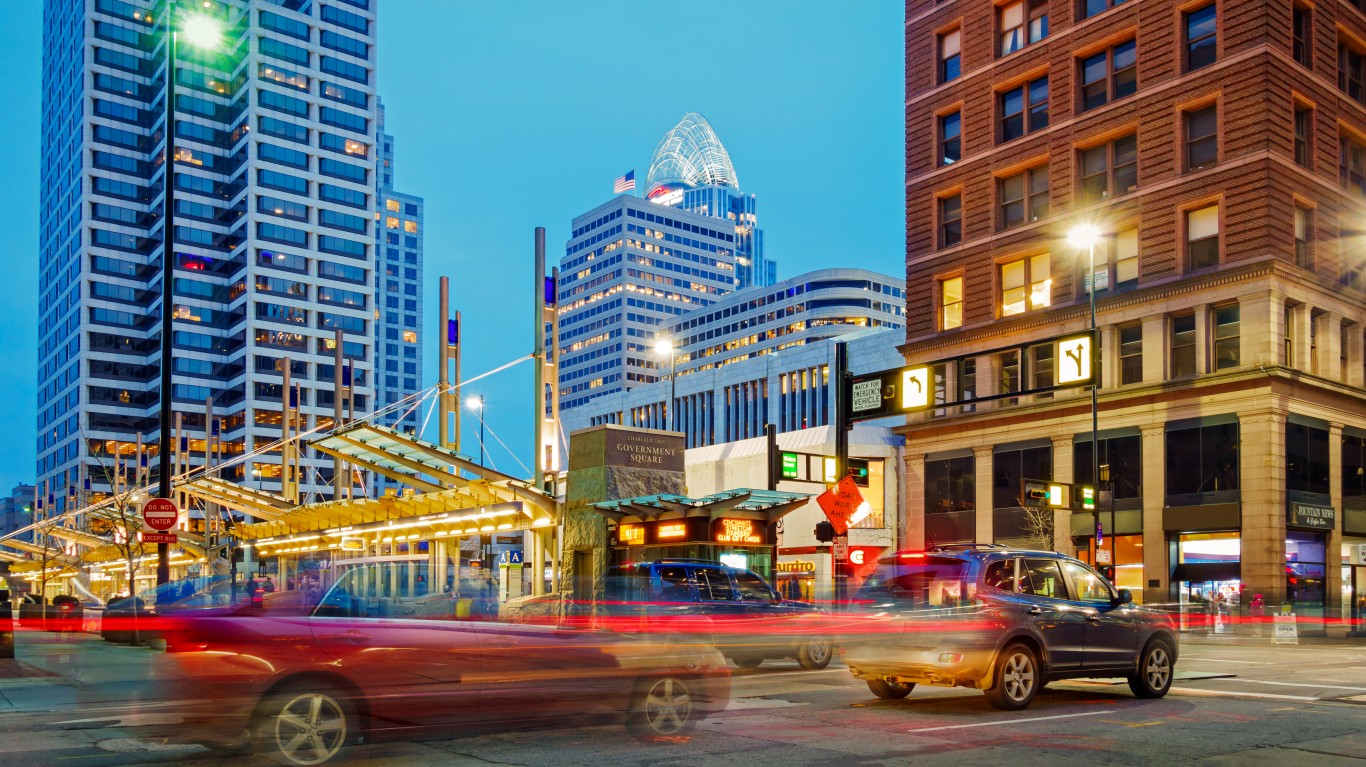
- Annual peak hours spent in congestion per auto commuter: 11.53
36. Nebraska
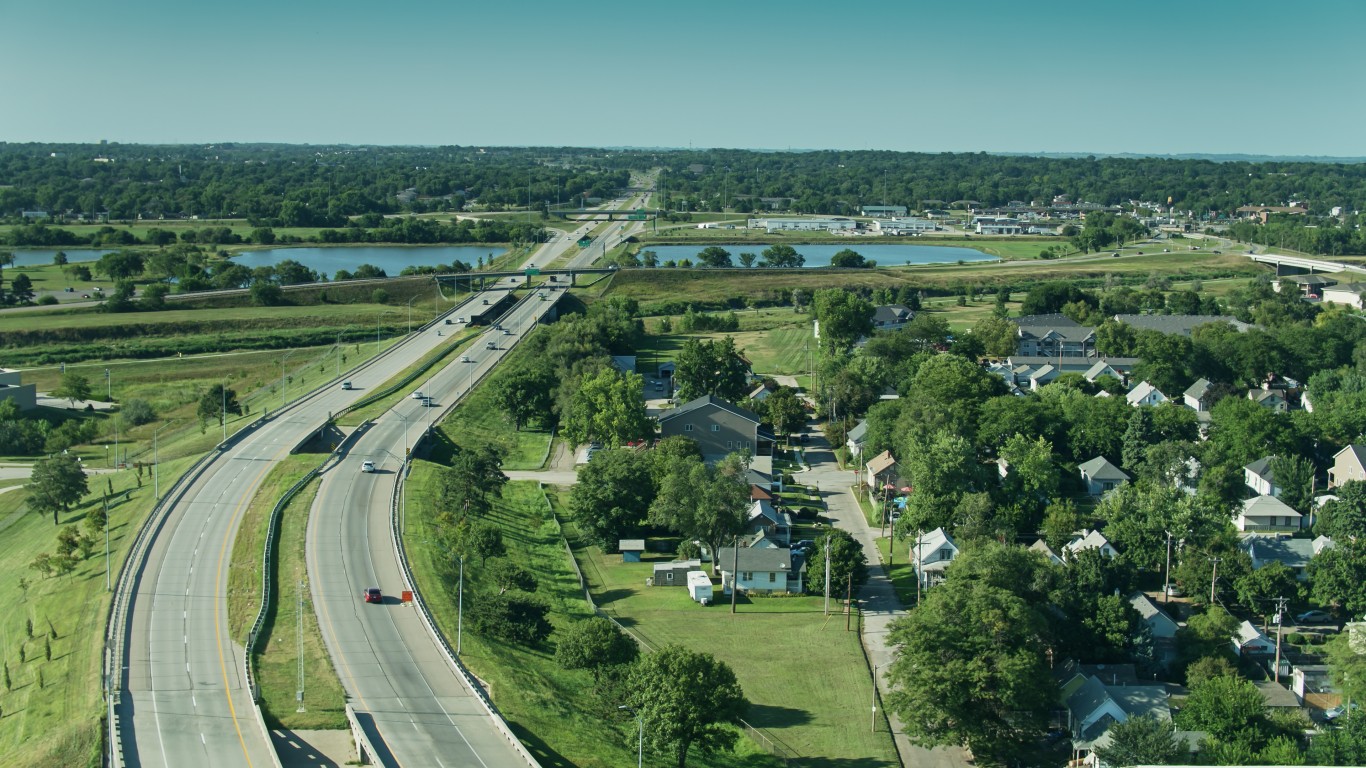
- Annual peak hours spent in congestion per auto commuter: 11.68
35. Utah
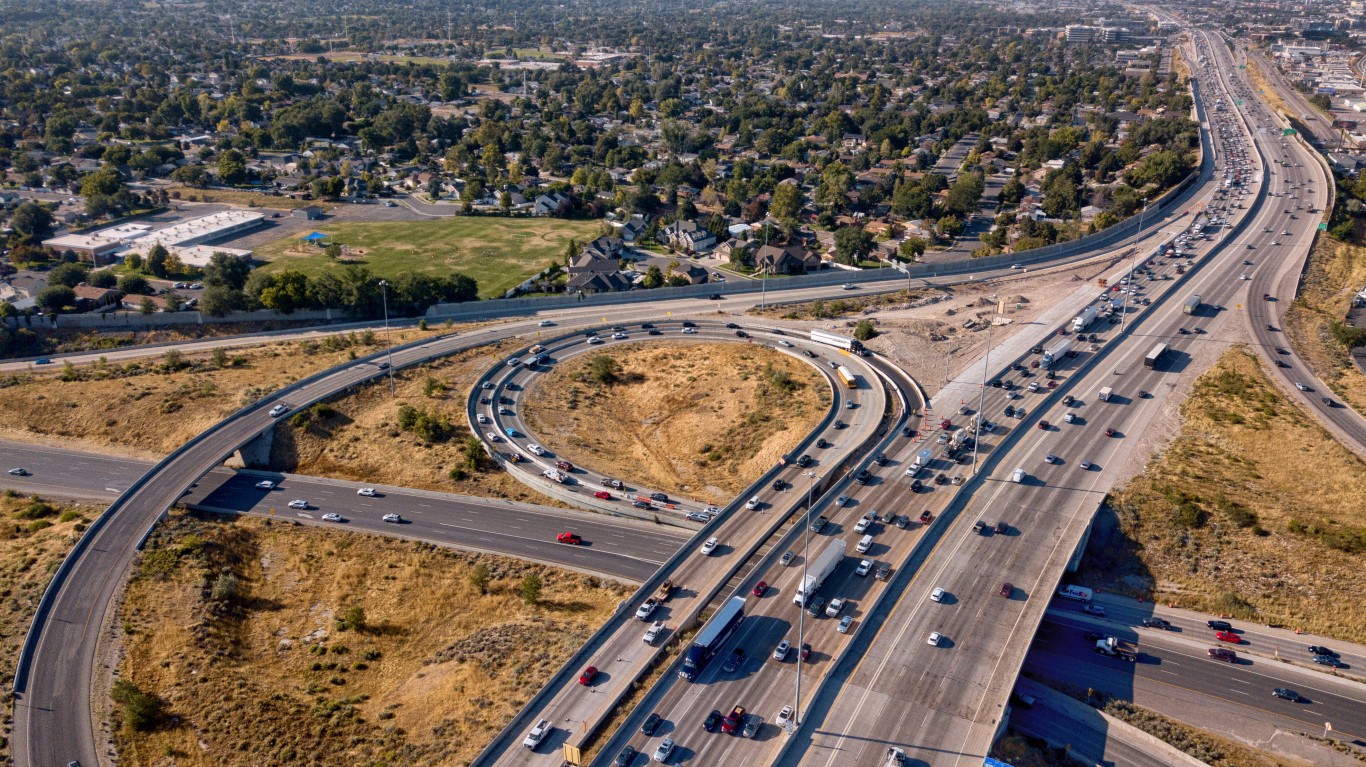
- Annual peak hours spent in congestion per auto commuter: 12.5
34. Alabama
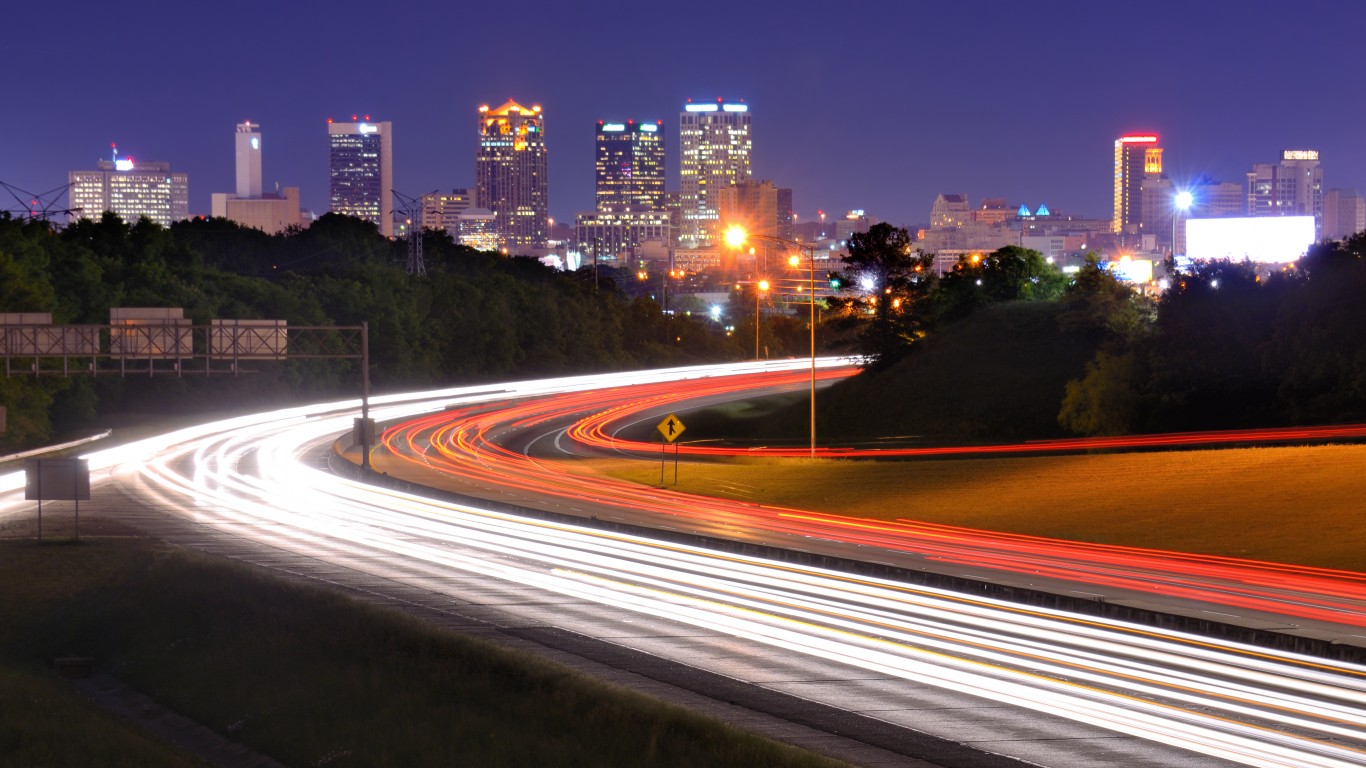
- Annual peak hours spent in congestion per auto commuter: 13.48
33. Montana
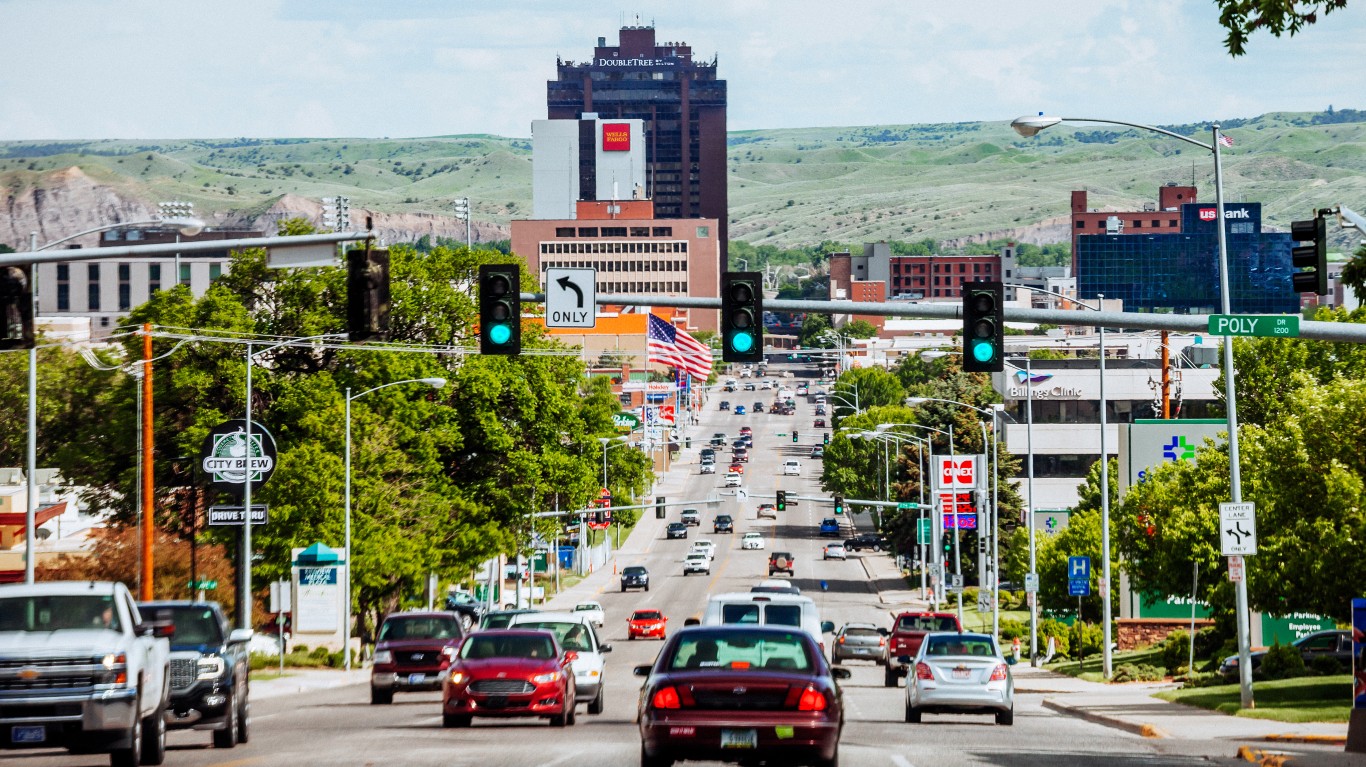
- Annual peak hours spent in congestion per auto commuter: 13.65
32. Hawaii
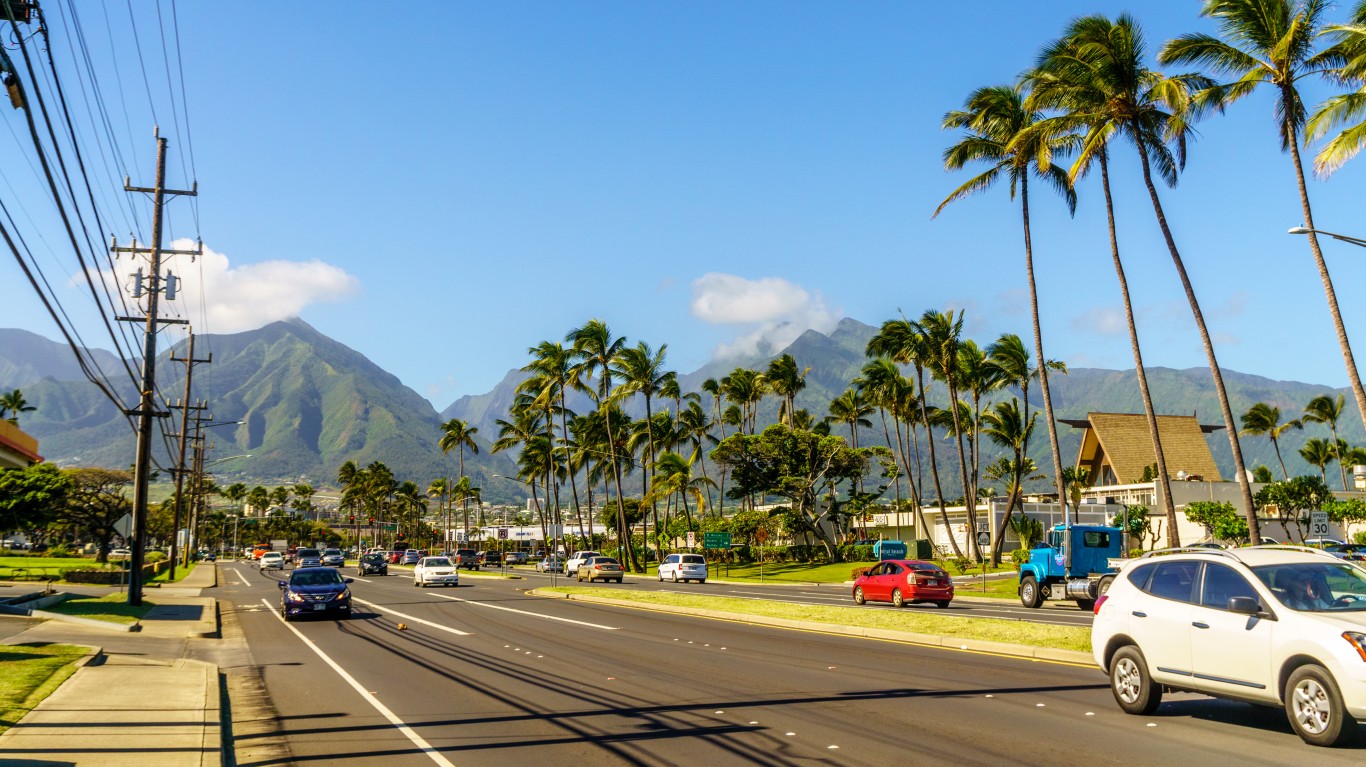
- Annual peak hours spent in congestion per auto commuter: 14.86
31. Missouri
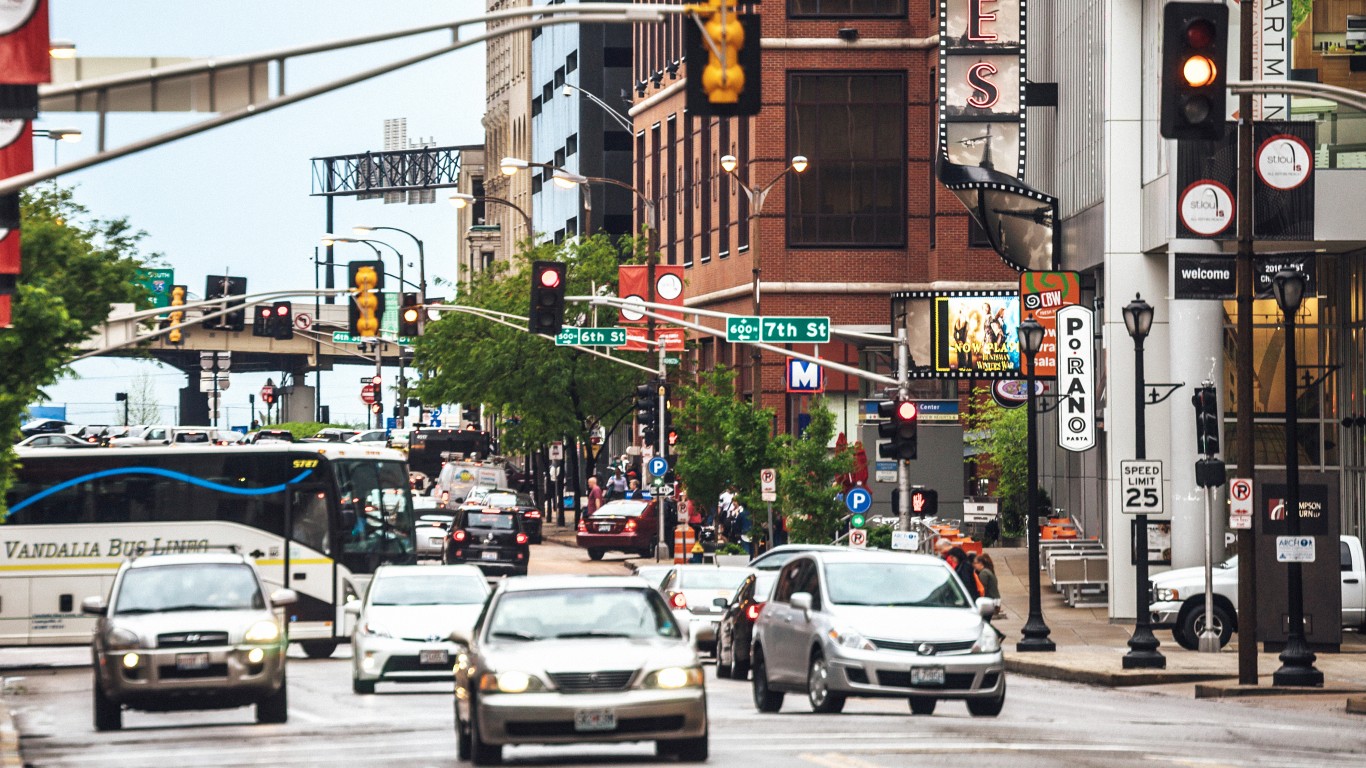
- Annual peak hours spent in congestion per auto commuter: 15.16
30. North Carolina
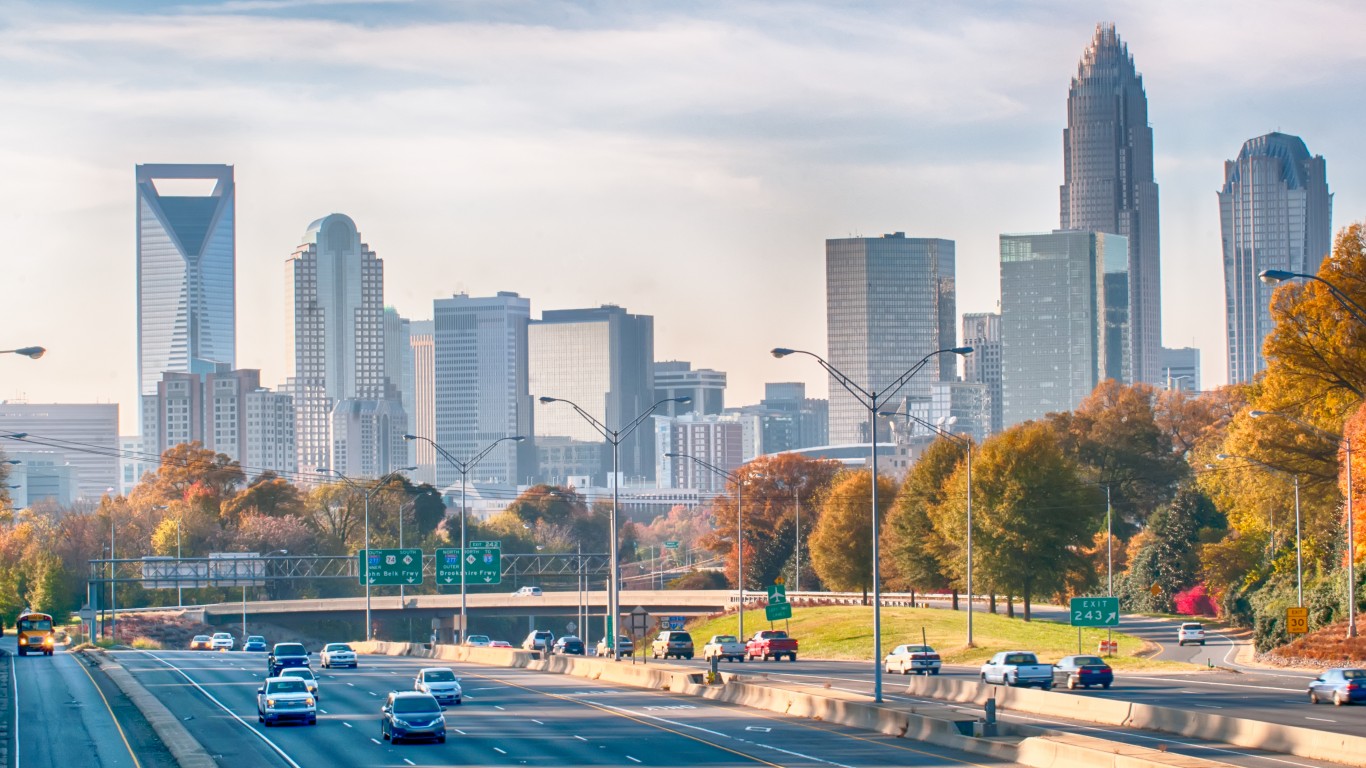
- Annual peak hours spent in congestion per auto commuter: 15.28
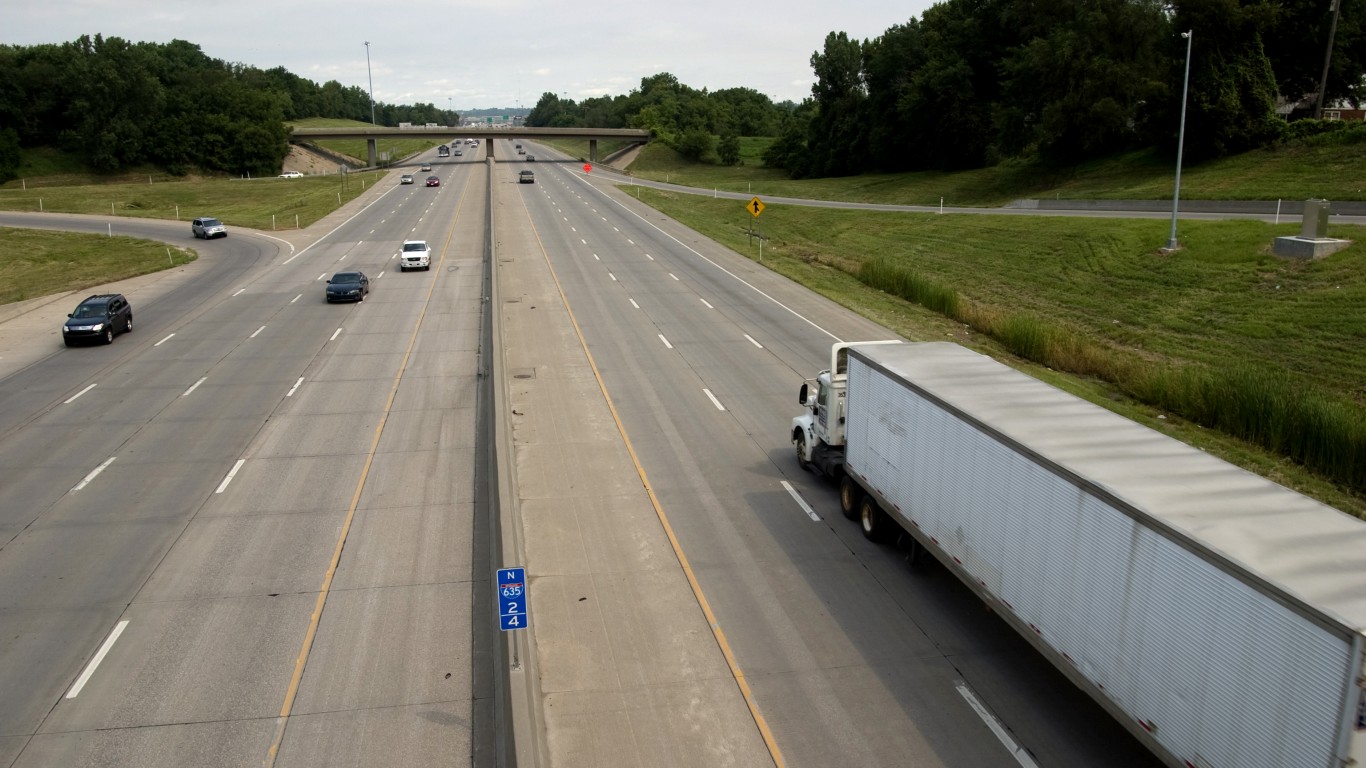
29. Kentucky
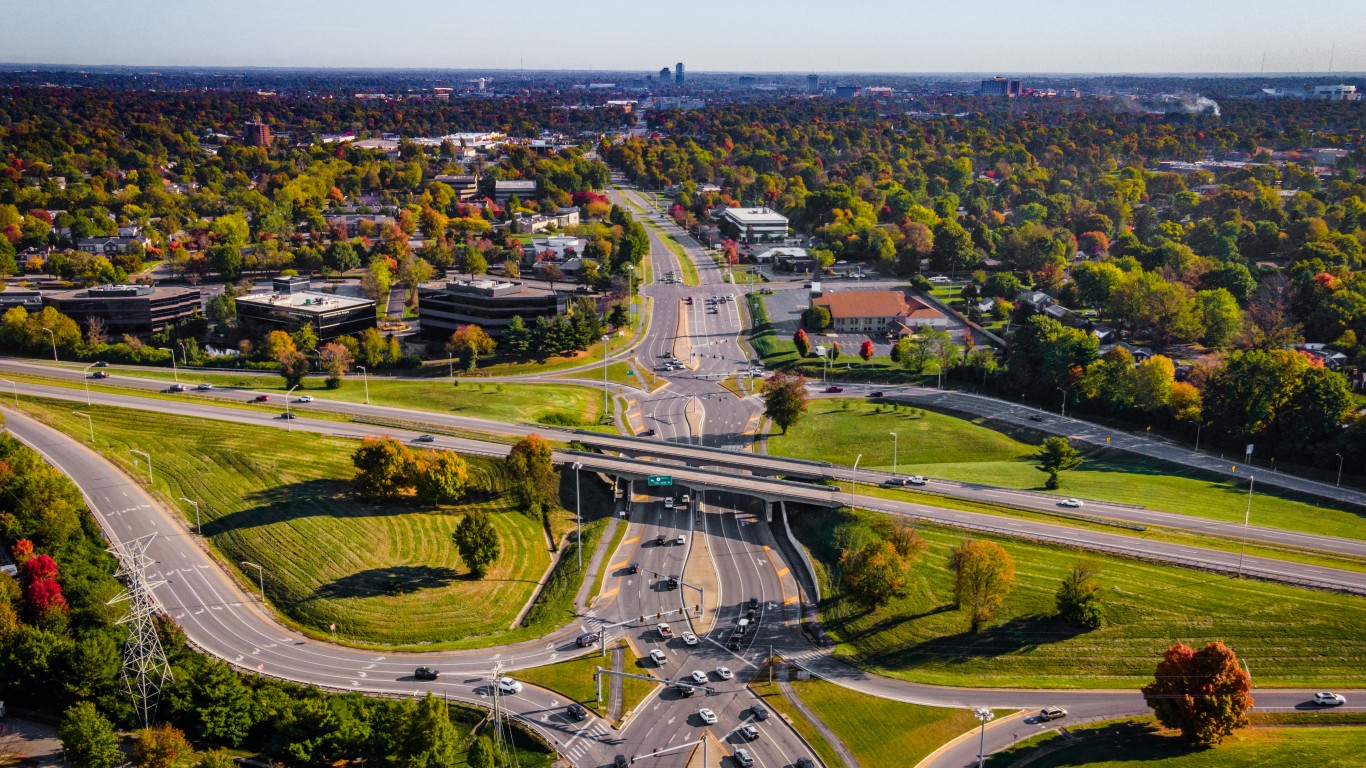
- Annual peak hours spent in congestion per auto commuter: 16.23
28. South Carolina
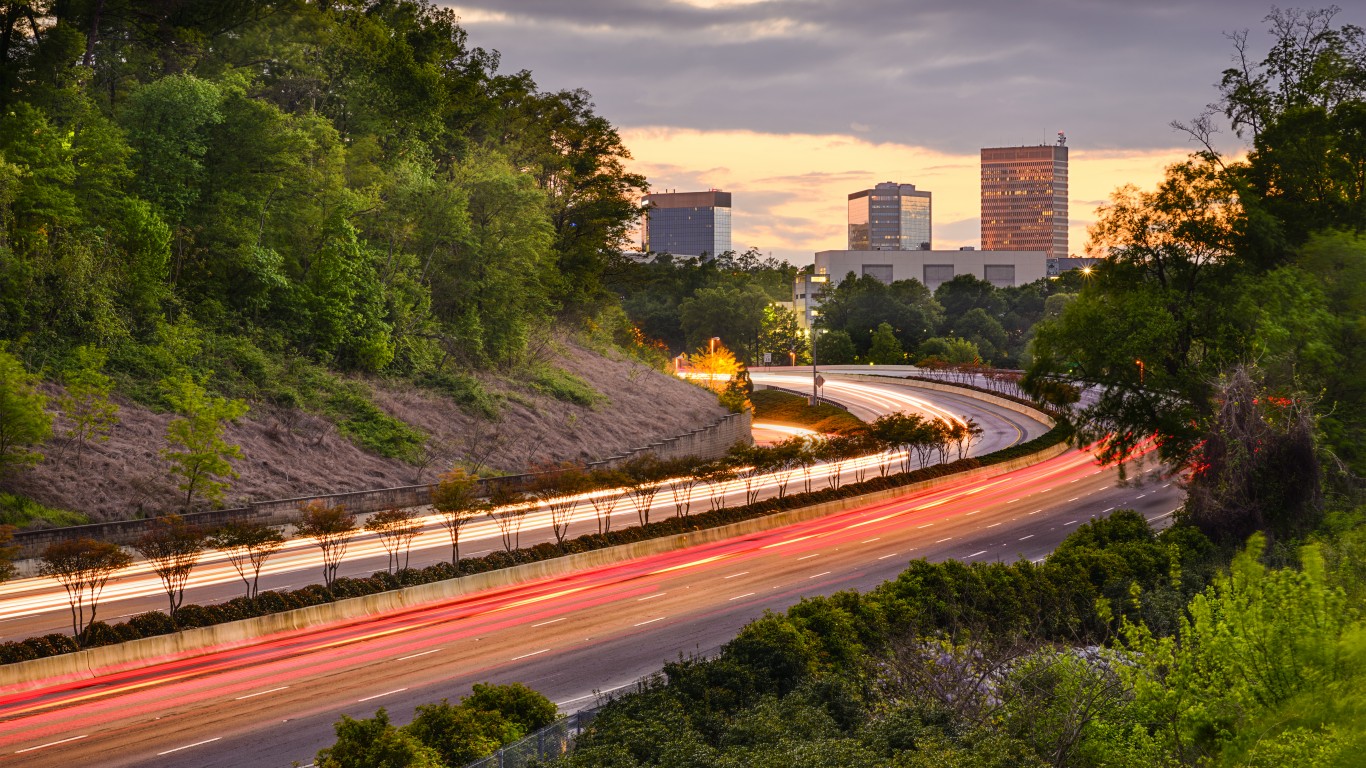
- Annual peak hours spent in congestion per auto commuter: 16.64
27. Wisconsin
- Annual peak hours spent in congestion per auto commuter: 16.72
26. New Mexico
- Annual peak hours spent in congestion per auto commuter: 16.8
25. Michigan
- Annual peak hours spent in congestion per auto commuter: 16.8
24. Tennessee
- Annual peak hours spent in congestion per auto commuter: 20.16
23. Indiana
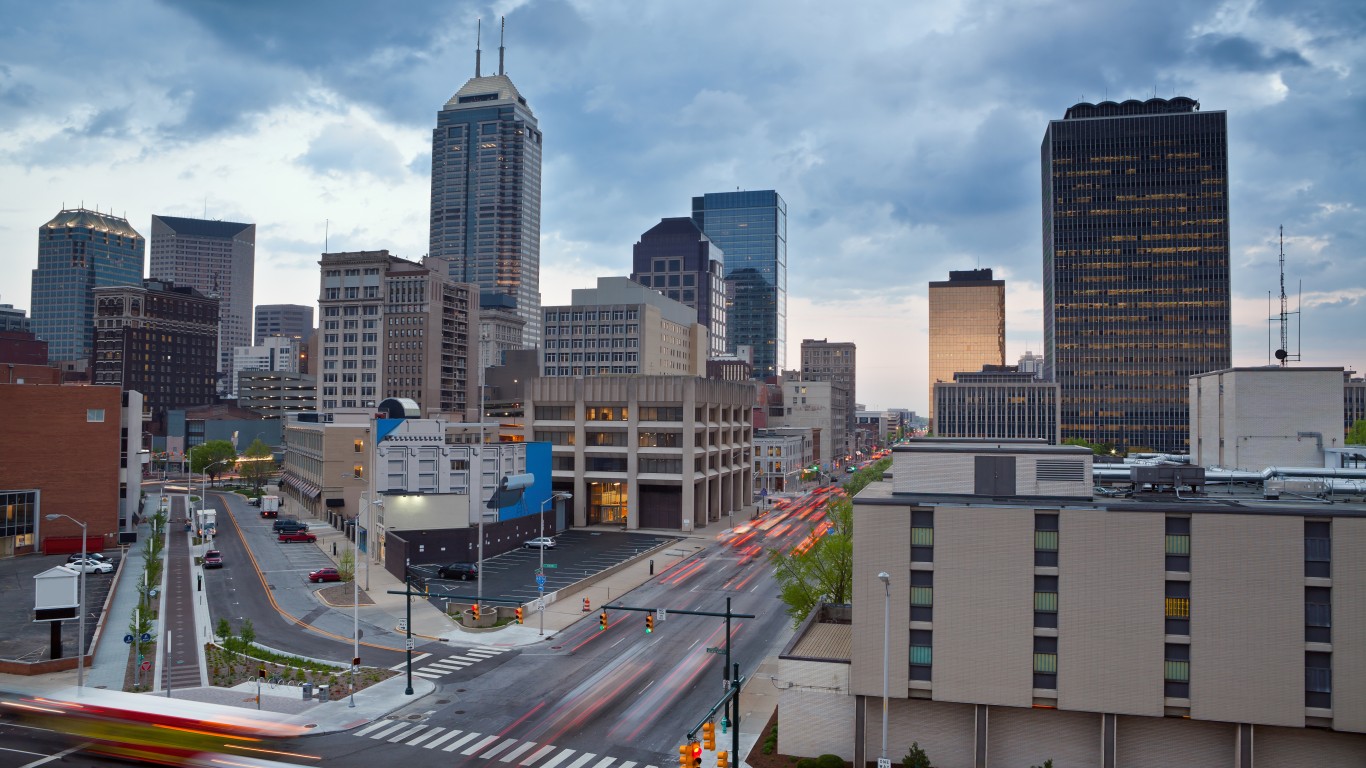
- Annual peak hours spent in congestion per auto commuter: 22.38
22. Minnesota
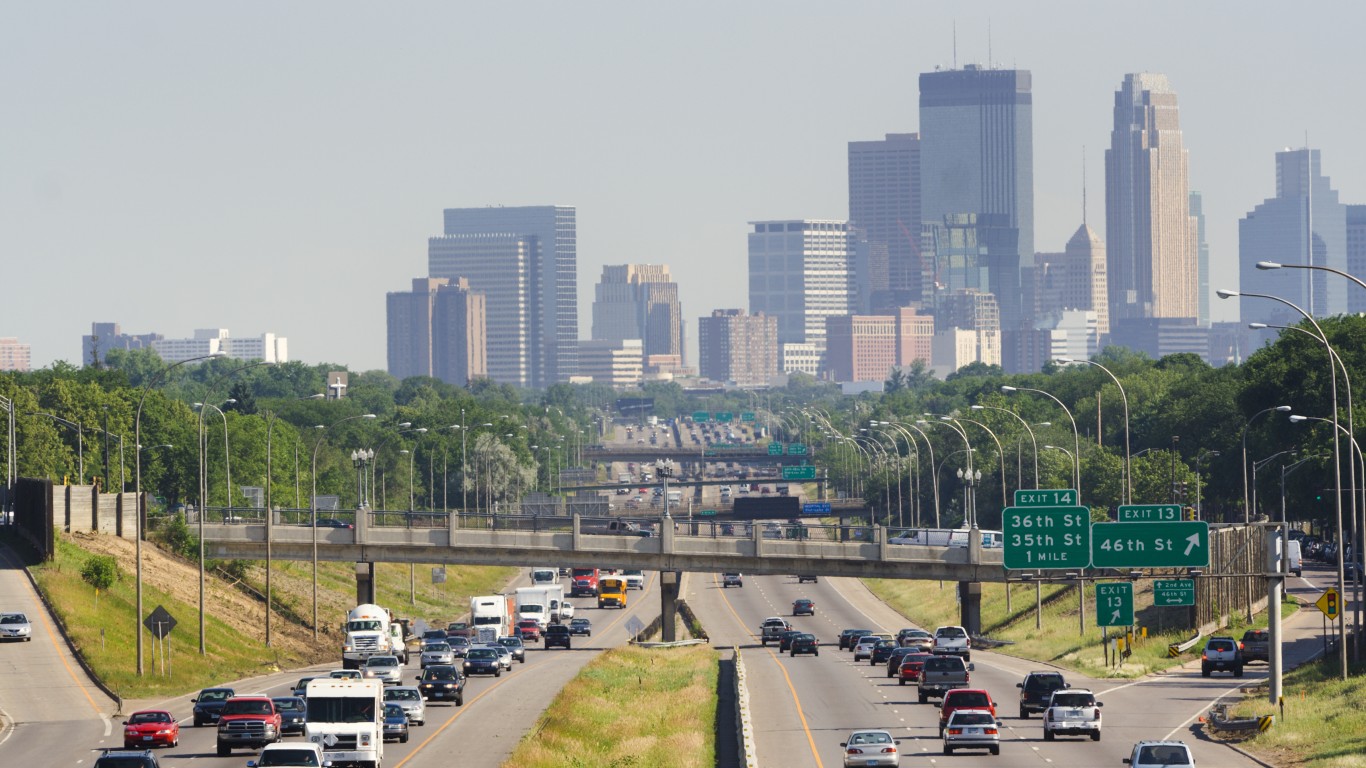
- Annual peak hours spent in congestion per auto commuter: 22.48
21. Arizona
- Annual peak hours spent in congestion per auto commuter: 23.36
20. Washington
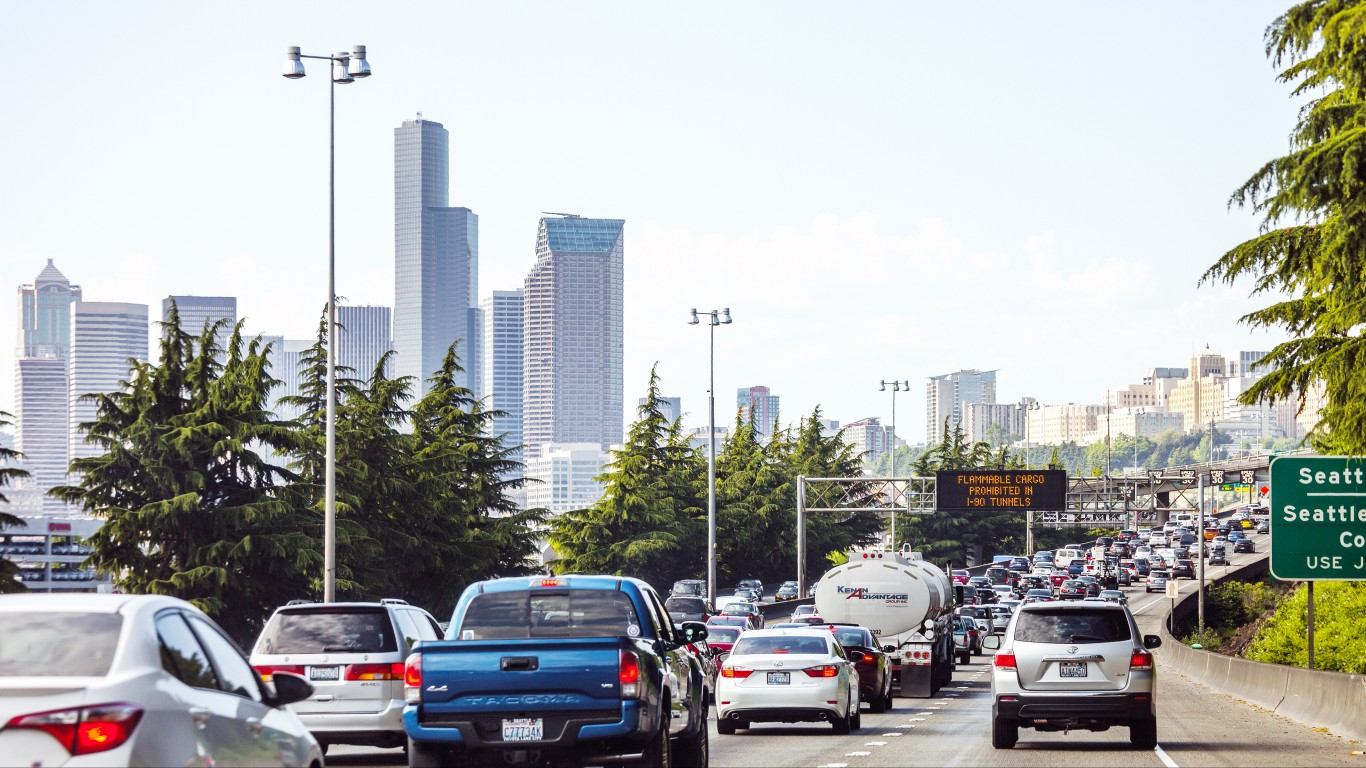
- Annual peak hours spent in congestion per auto commuter: 27.76
19. Connecticut
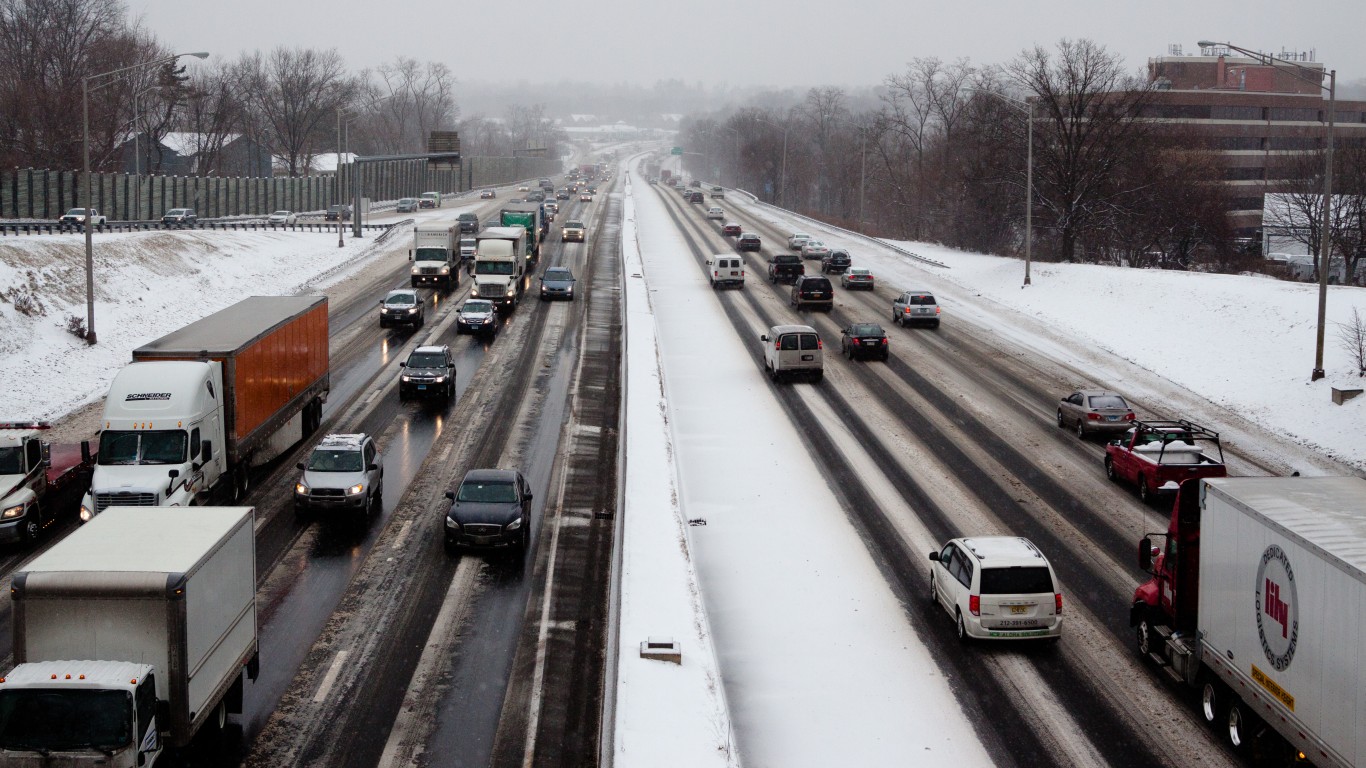
- Annual peak hours spent in congestion per auto commuter: 28.58
18. New Hampshire
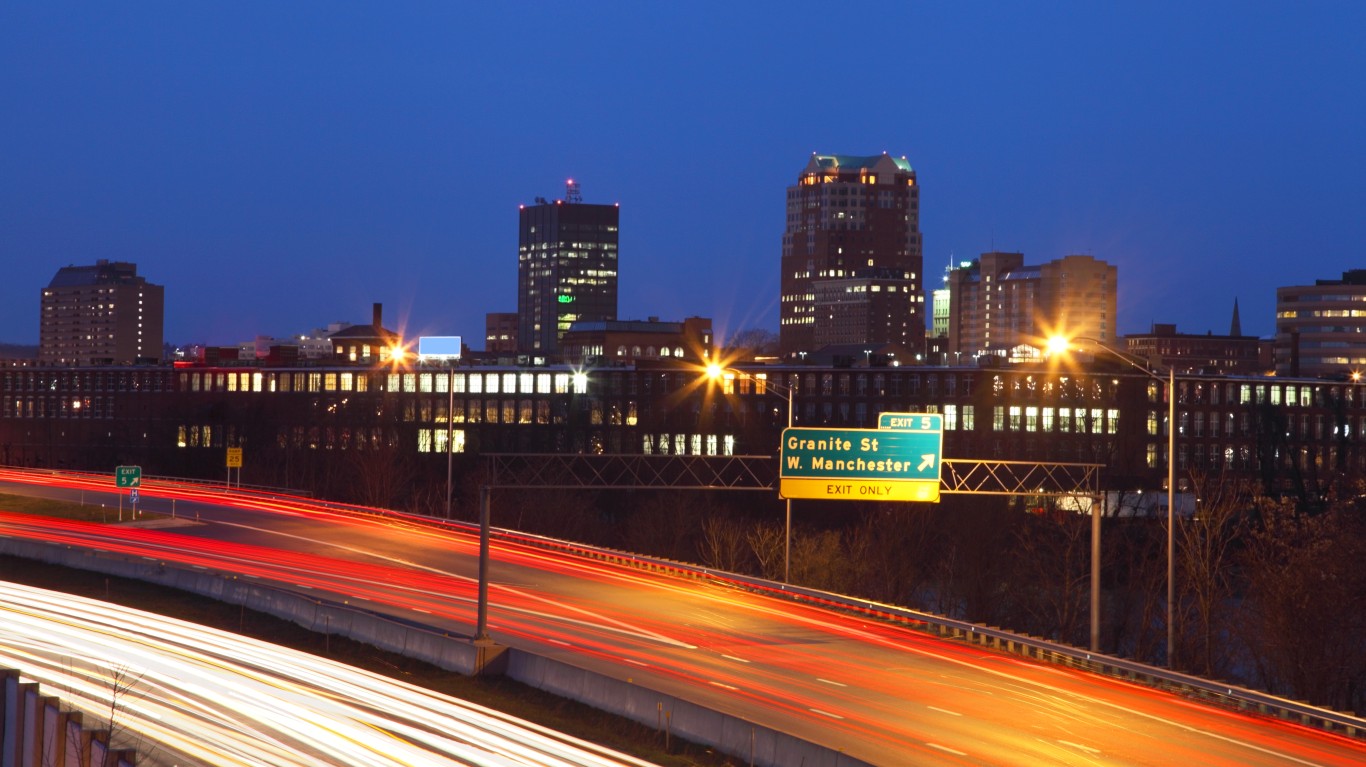
- Annual peak hours spent in congestion per auto commuter: 32.91
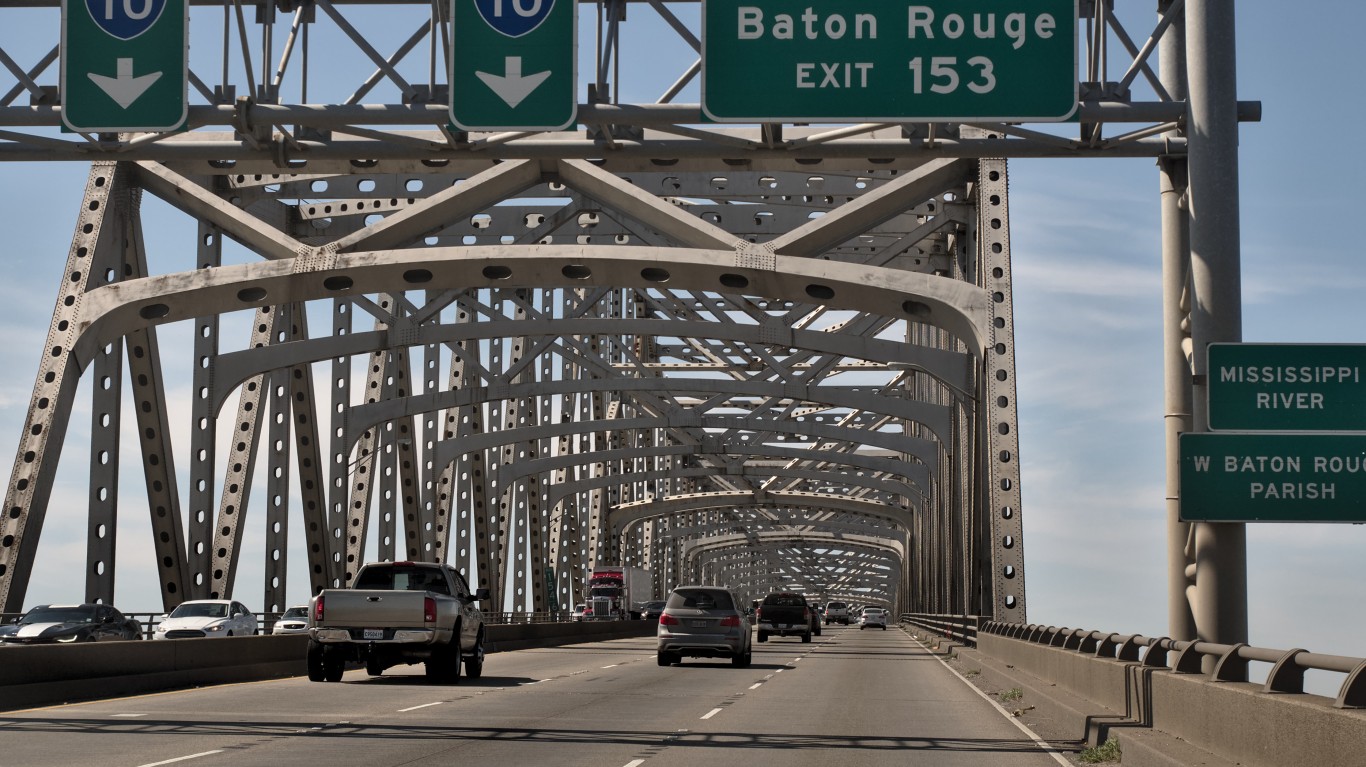
17. Louisiana
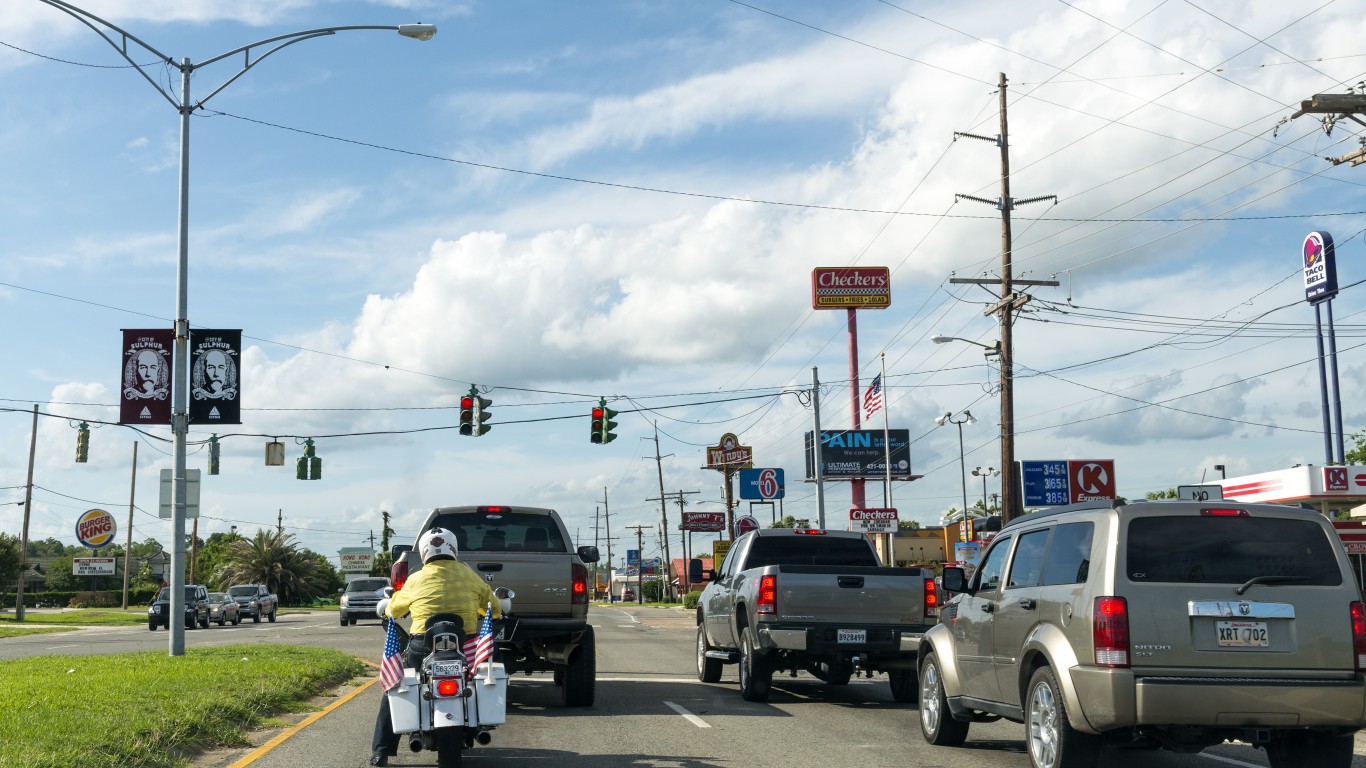
- Annual peak hours spent in congestion per auto commuter: 34.27
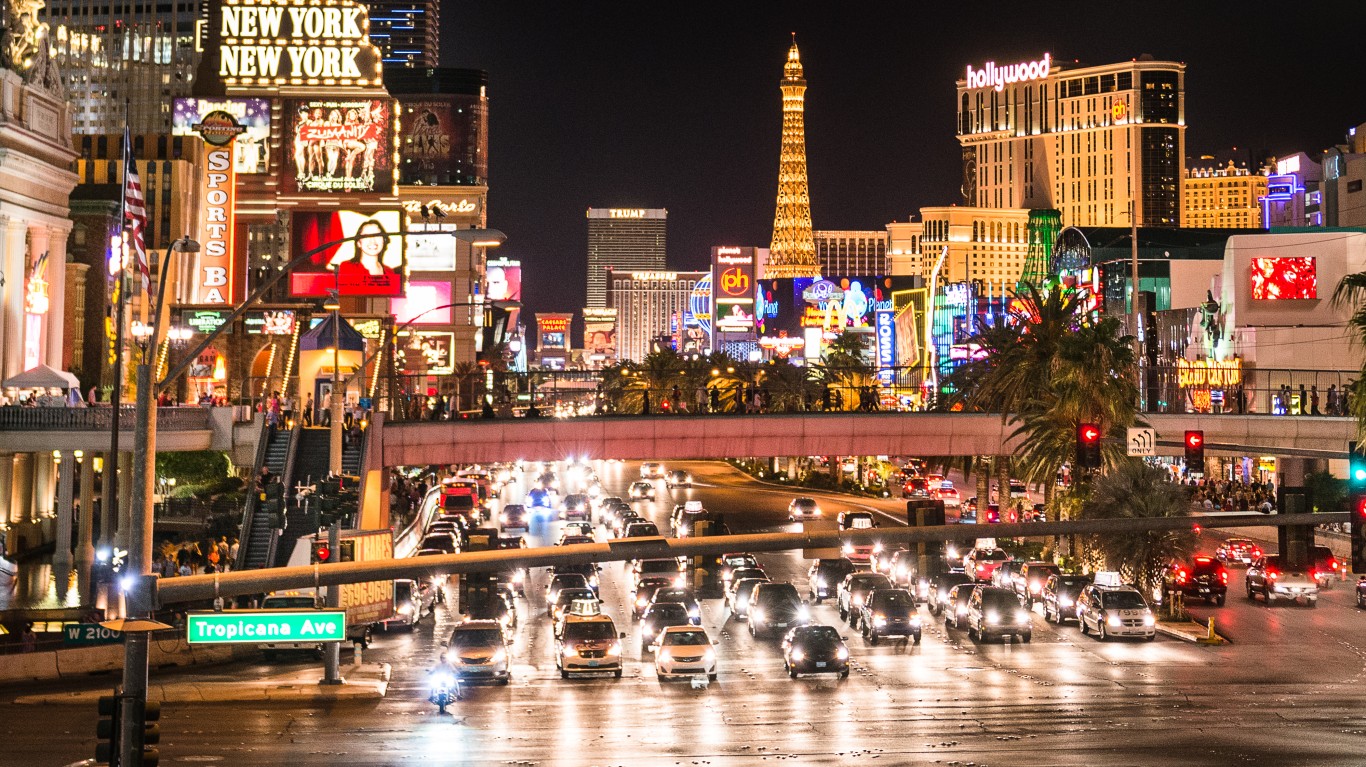
16. Nevada
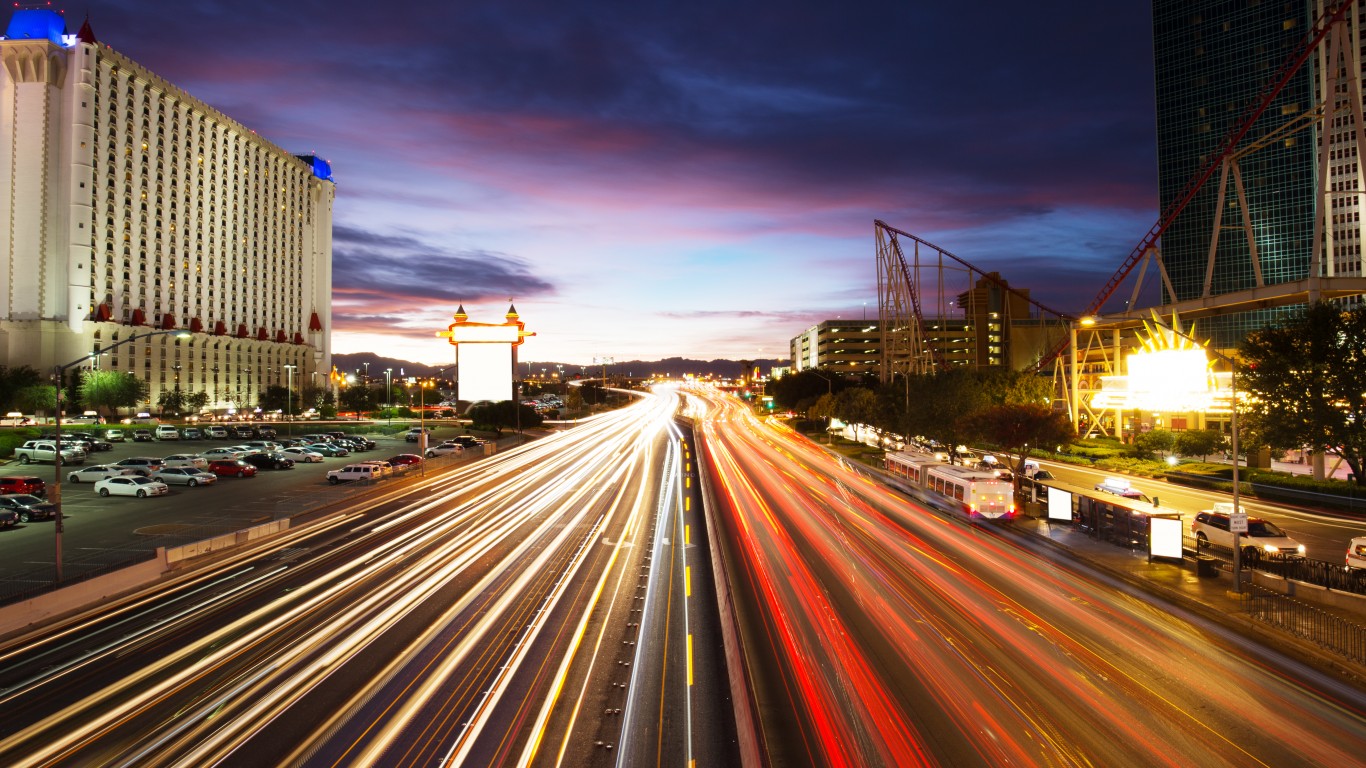
- Annual peak hours spent in congestion per auto commuter: 36.06
15. Colorado
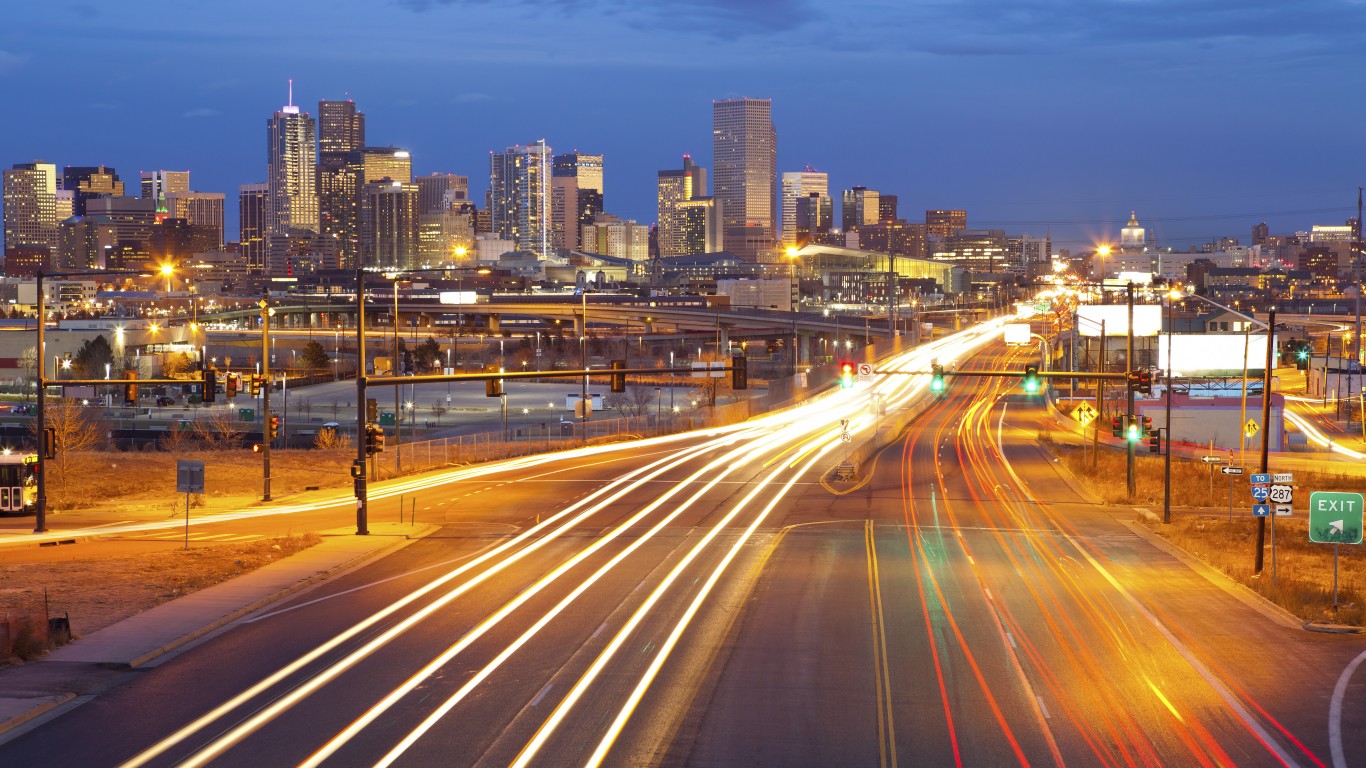
- Annual peak hours spent in congestion per auto commuter: 36.21
14. Virginia
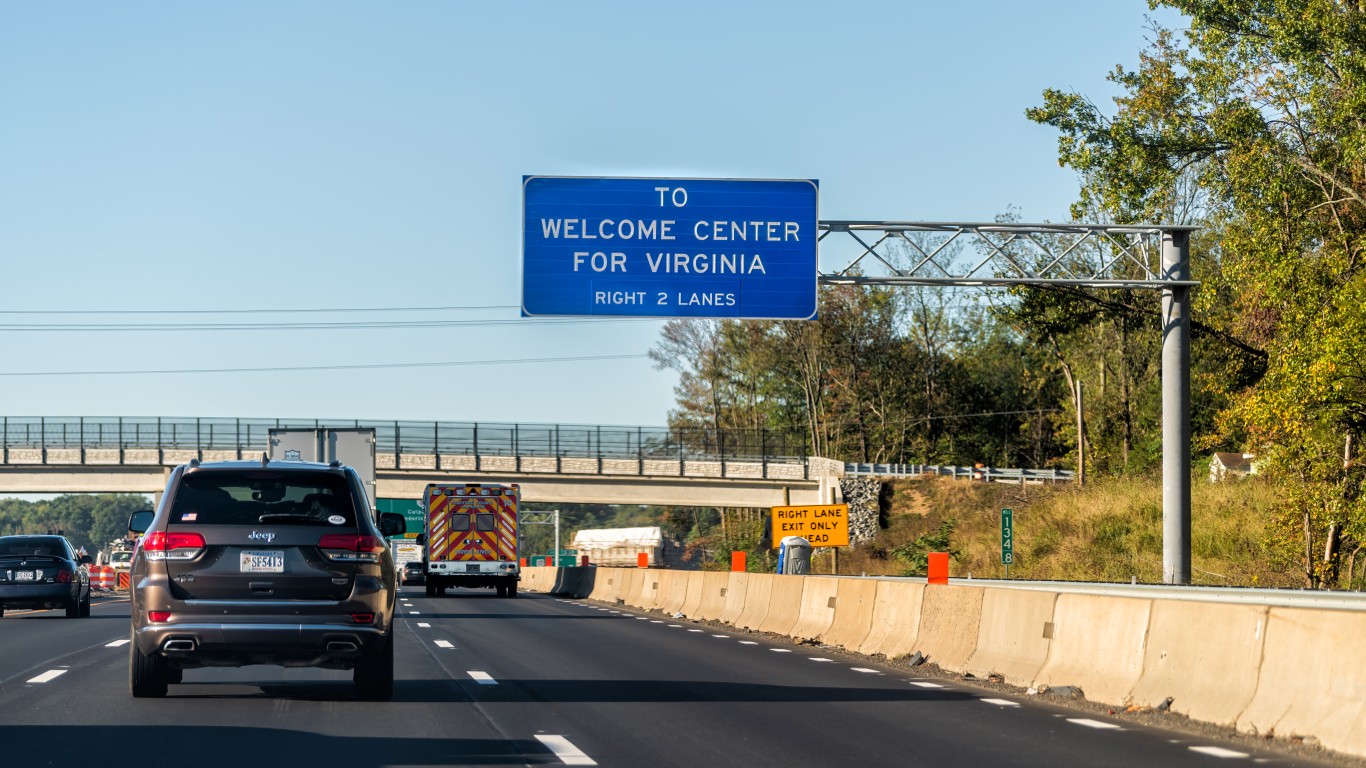
- Annual peak hours spent in congestion per auto commuter: 39.18
13. Rhode Island
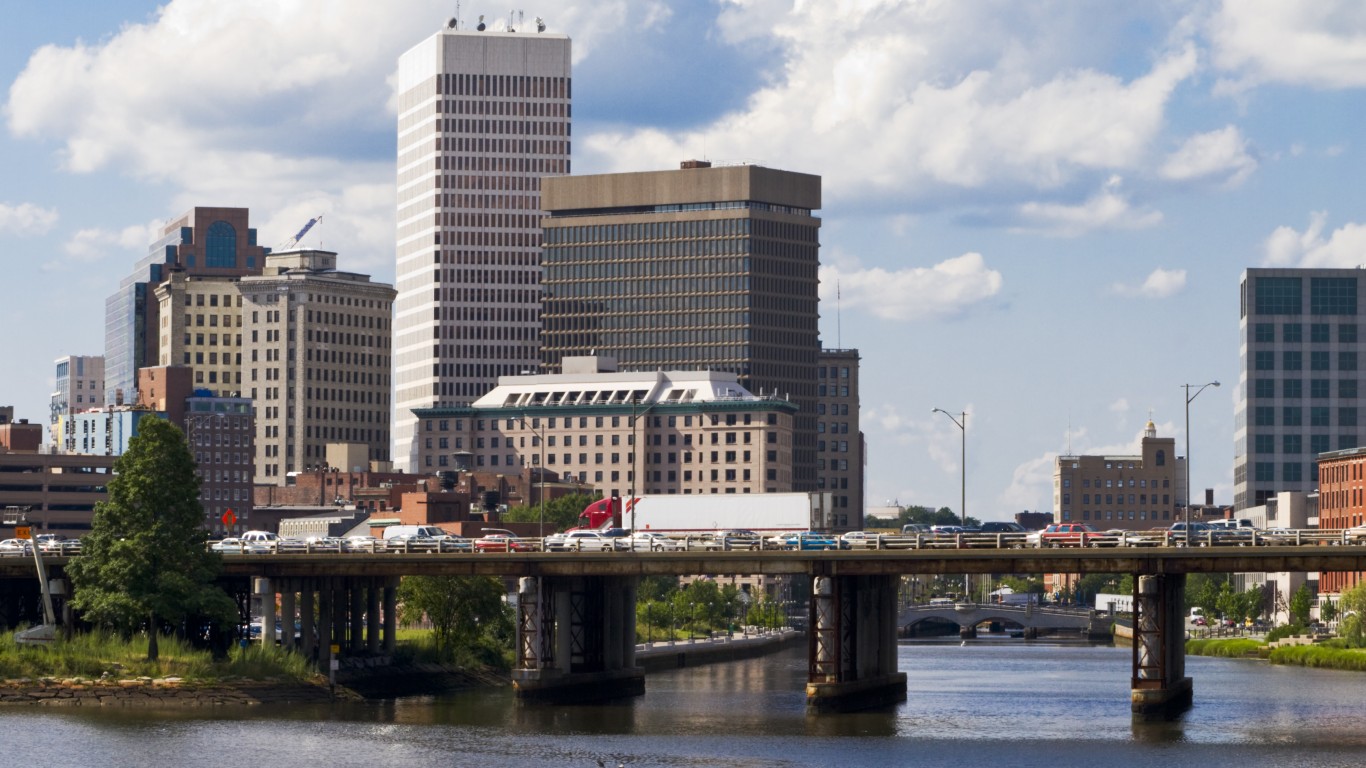
- Annual peak hours spent in congestion per auto commuter: 41.51
12. Florida
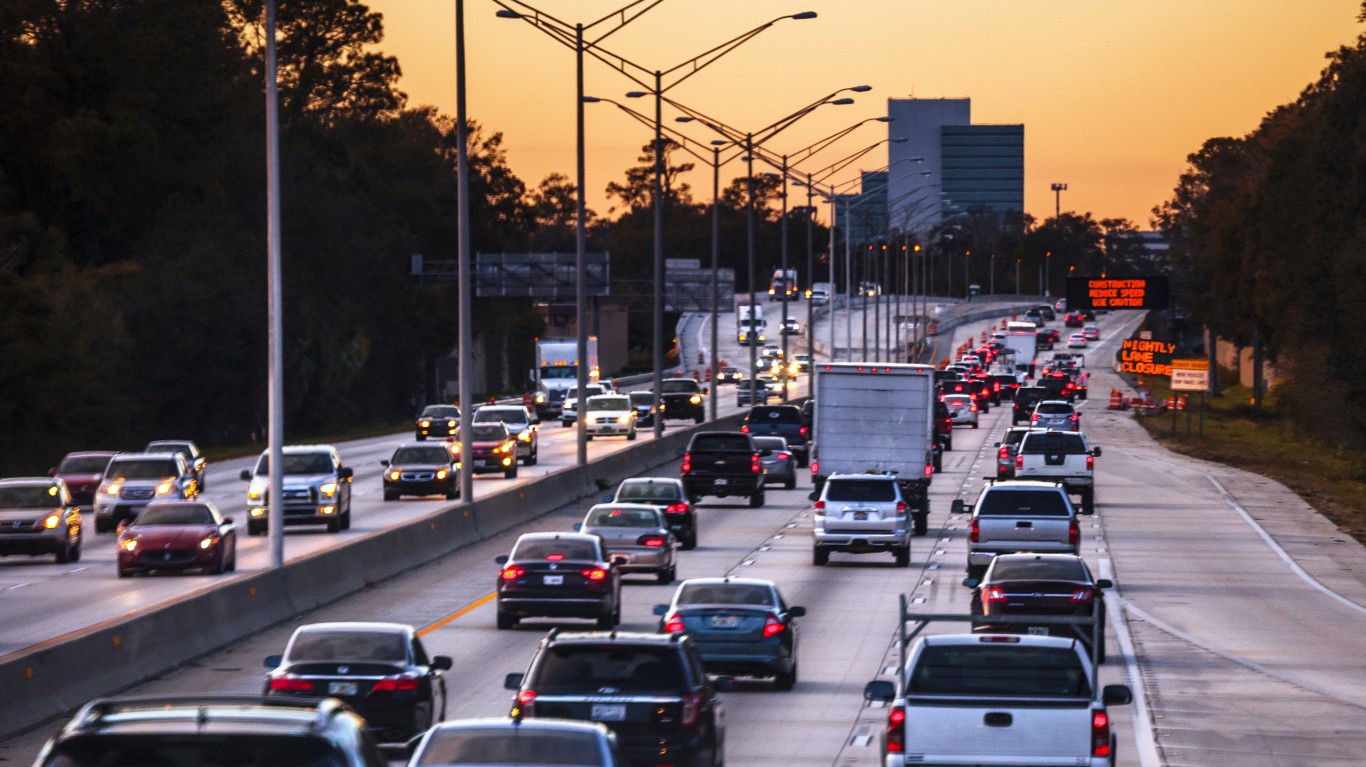
- Annual peak hours spent in congestion per auto commuter: 44.95
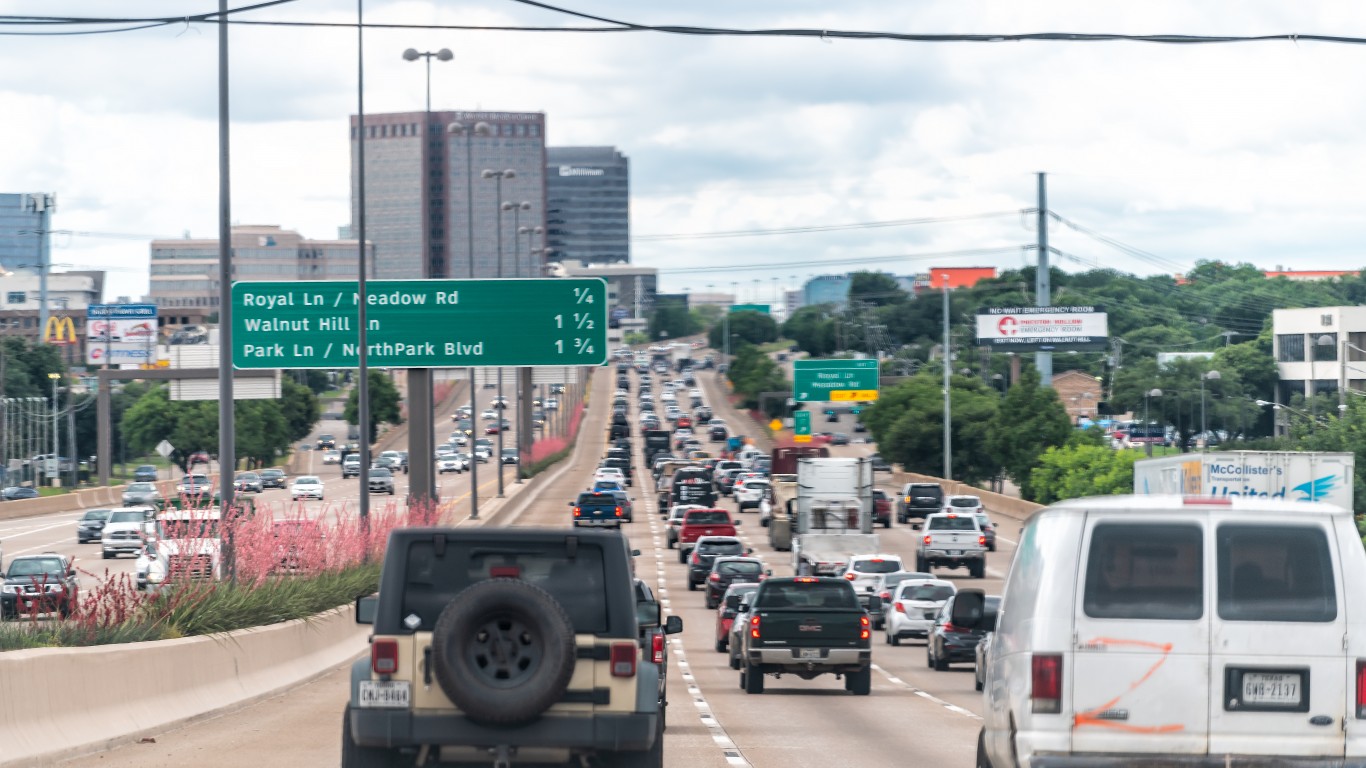
11. Texas
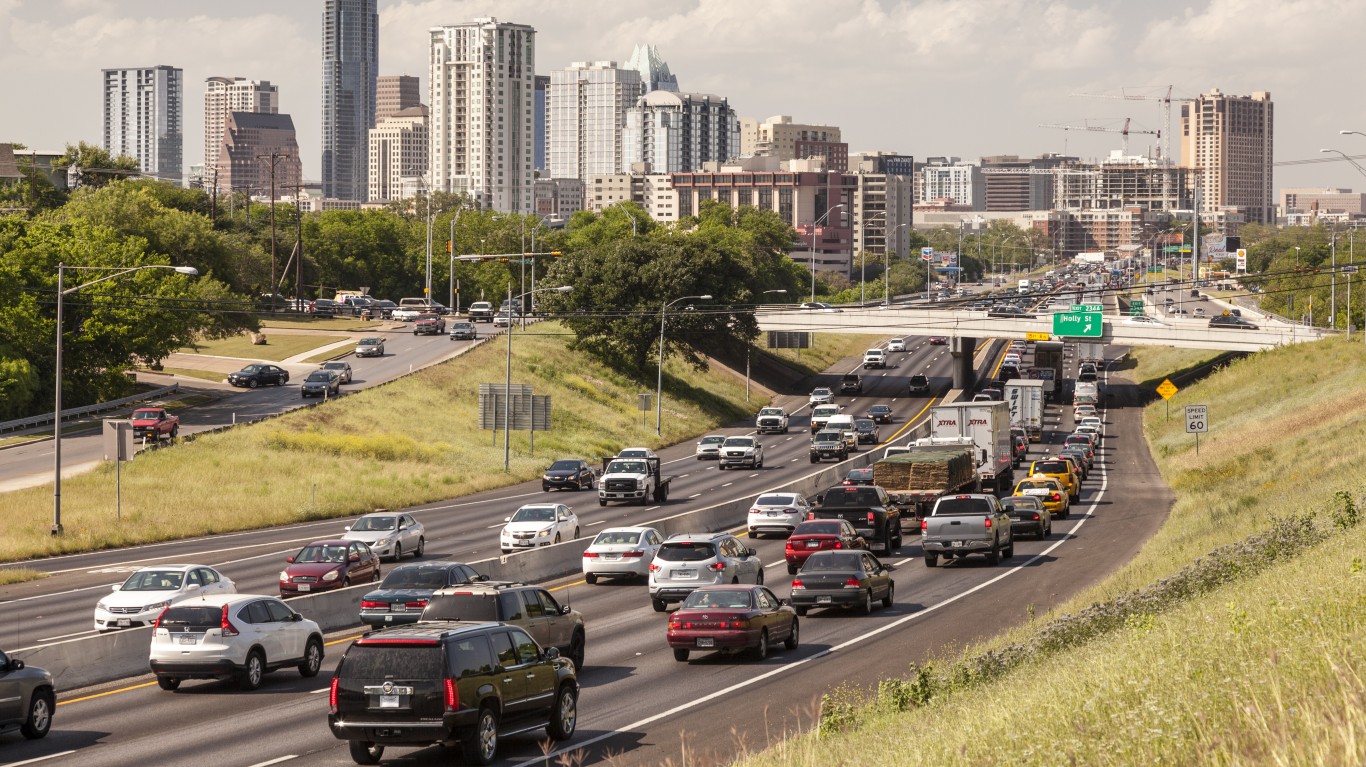
- Annual peak hours spent in congestion per auto commuter: 45.91
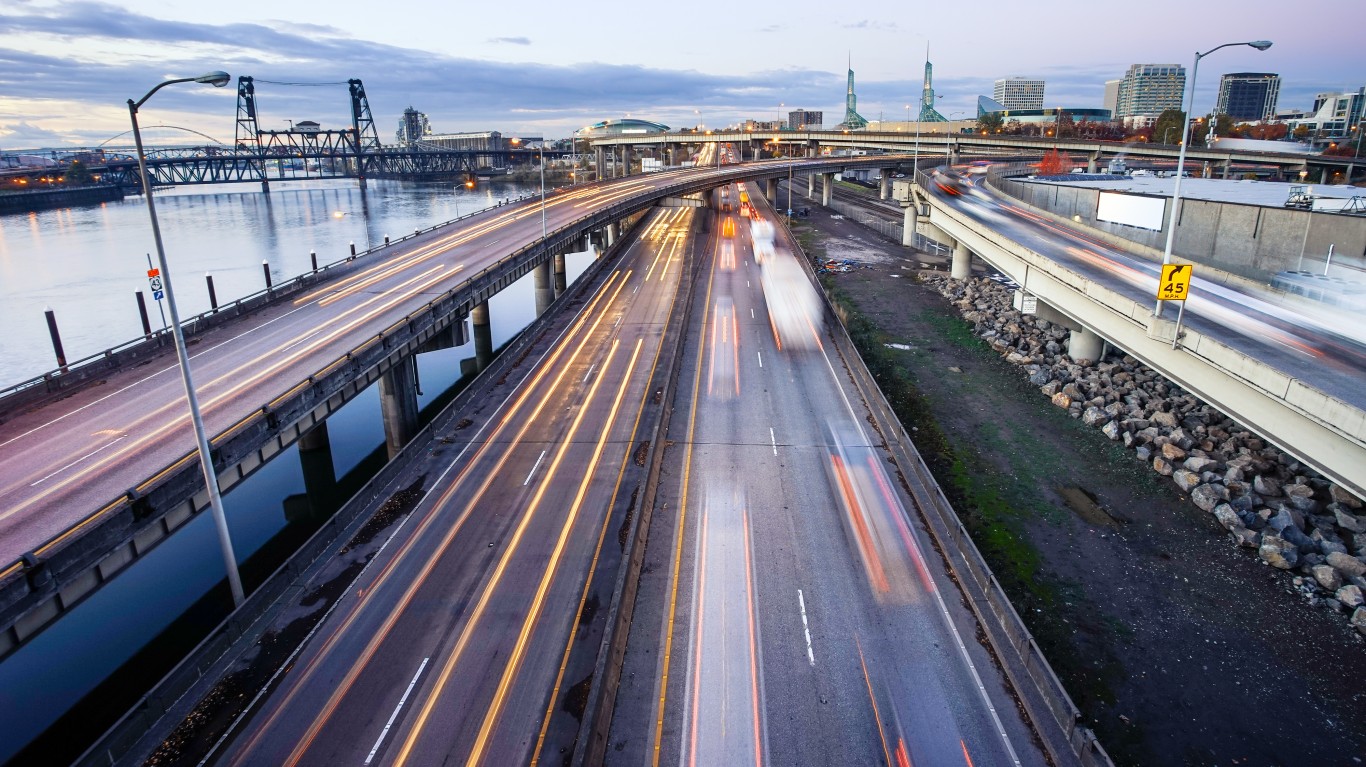
10. Oregon
- Annual peak hours spent in congestion per auto commuter: 47.22
9. Pennsylvania
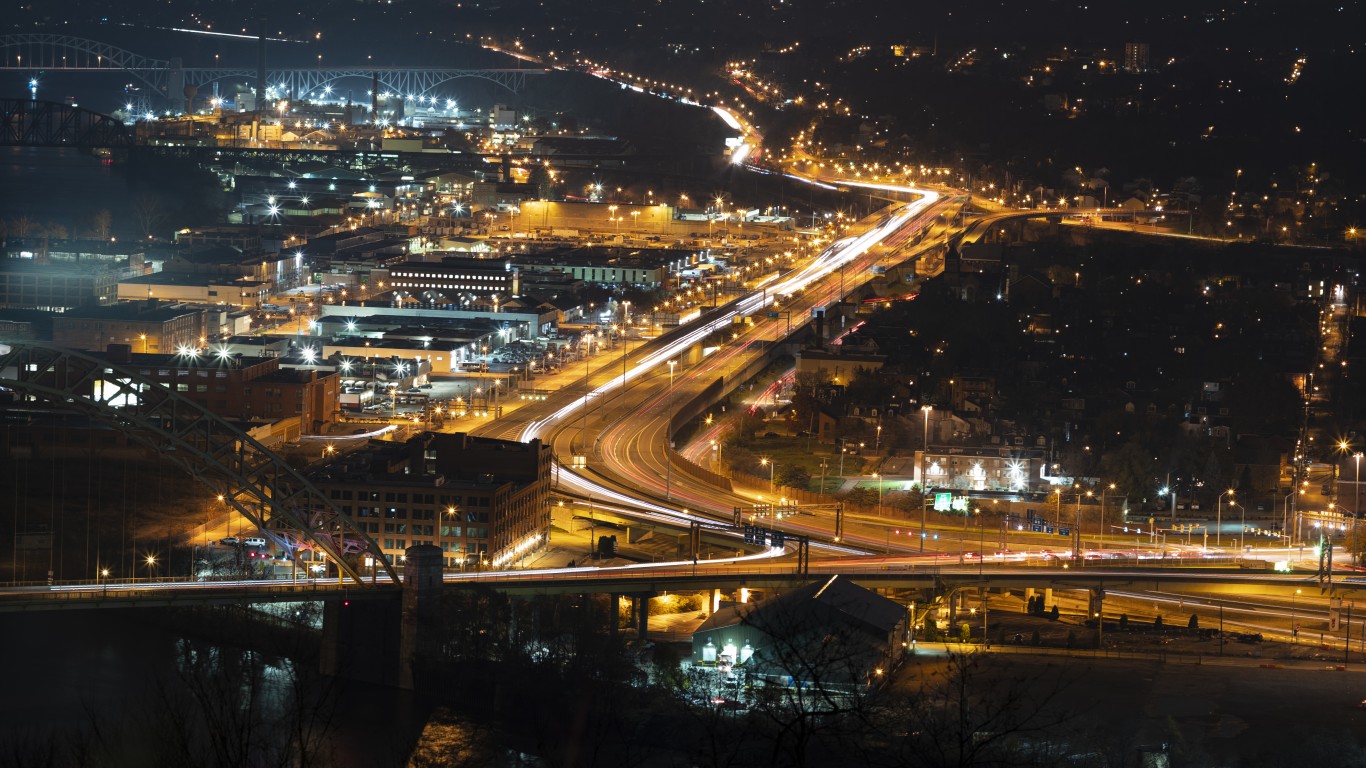
- Annual peak hours spent in congestion per auto commuter: 47.28
8. Georgia
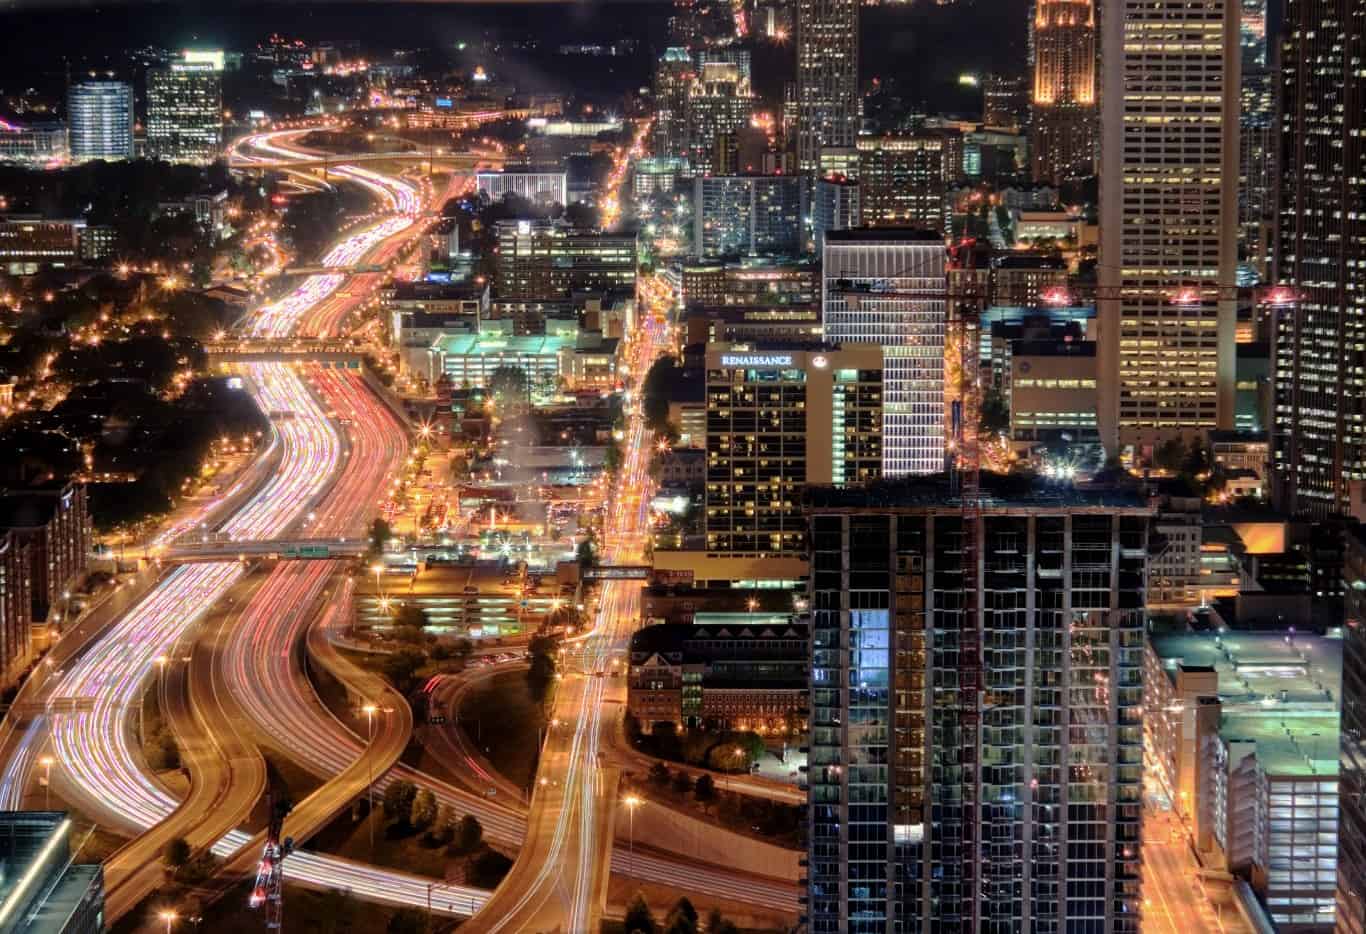
- Annual peak hours spent in congestion per auto commuter: 53.83
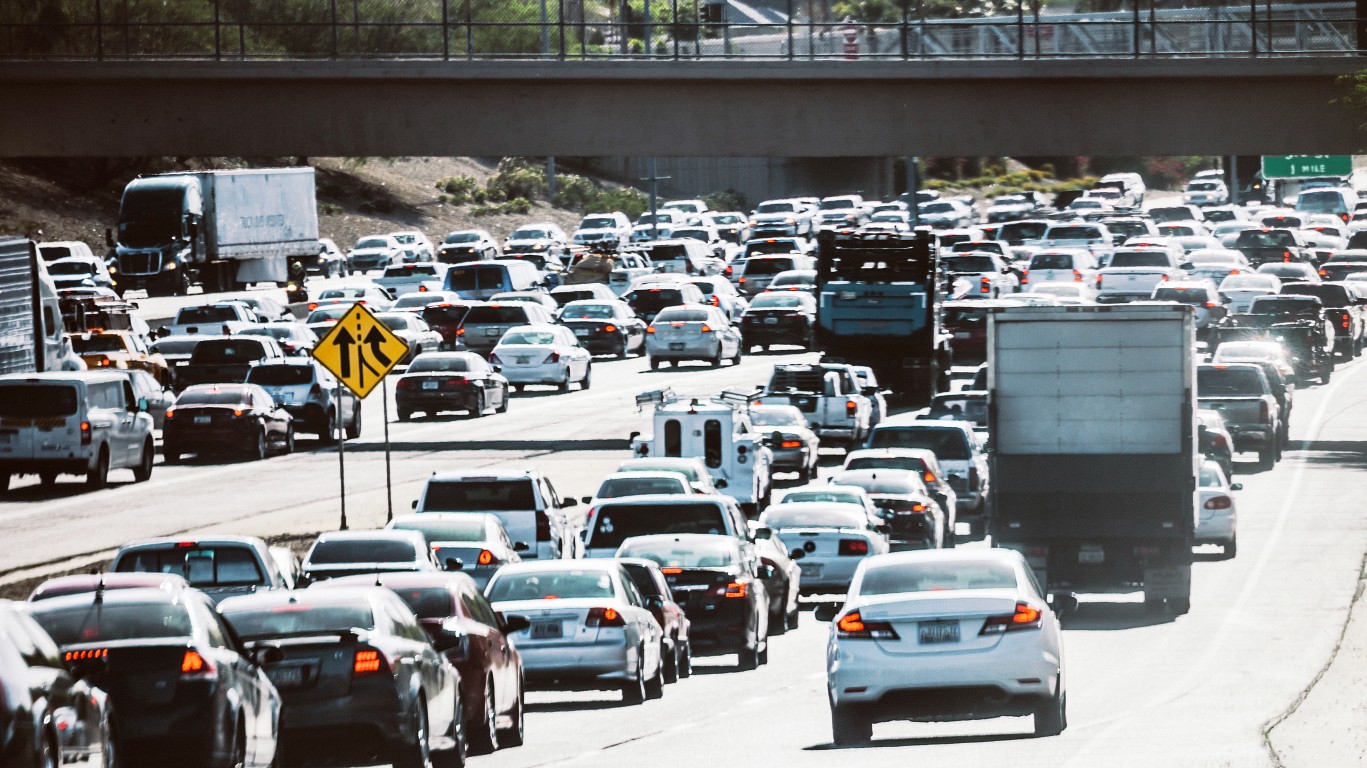
7. California
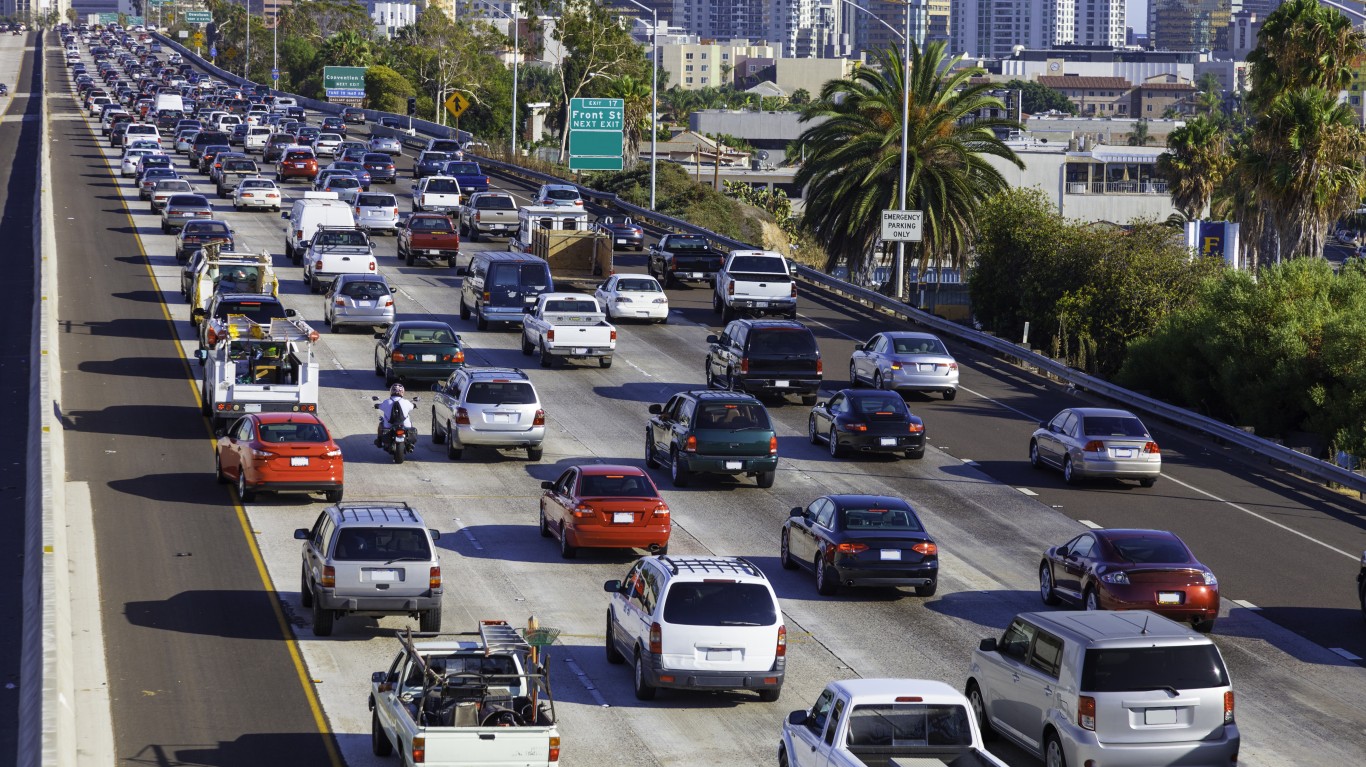
- Annual peak hours spent in congestion per auto commuter: 60.27
6. Maryland
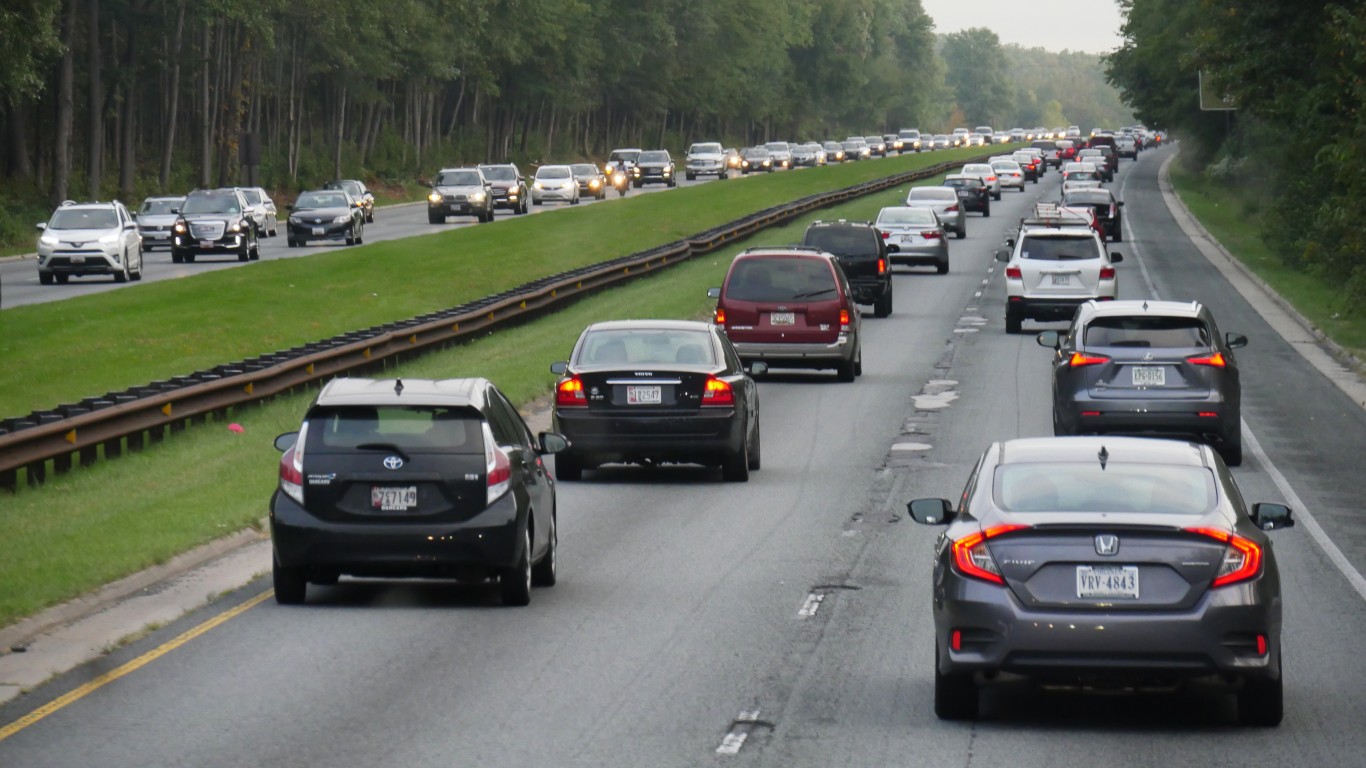
- Annual peak hours spent in congestion per auto commuter: 61.77
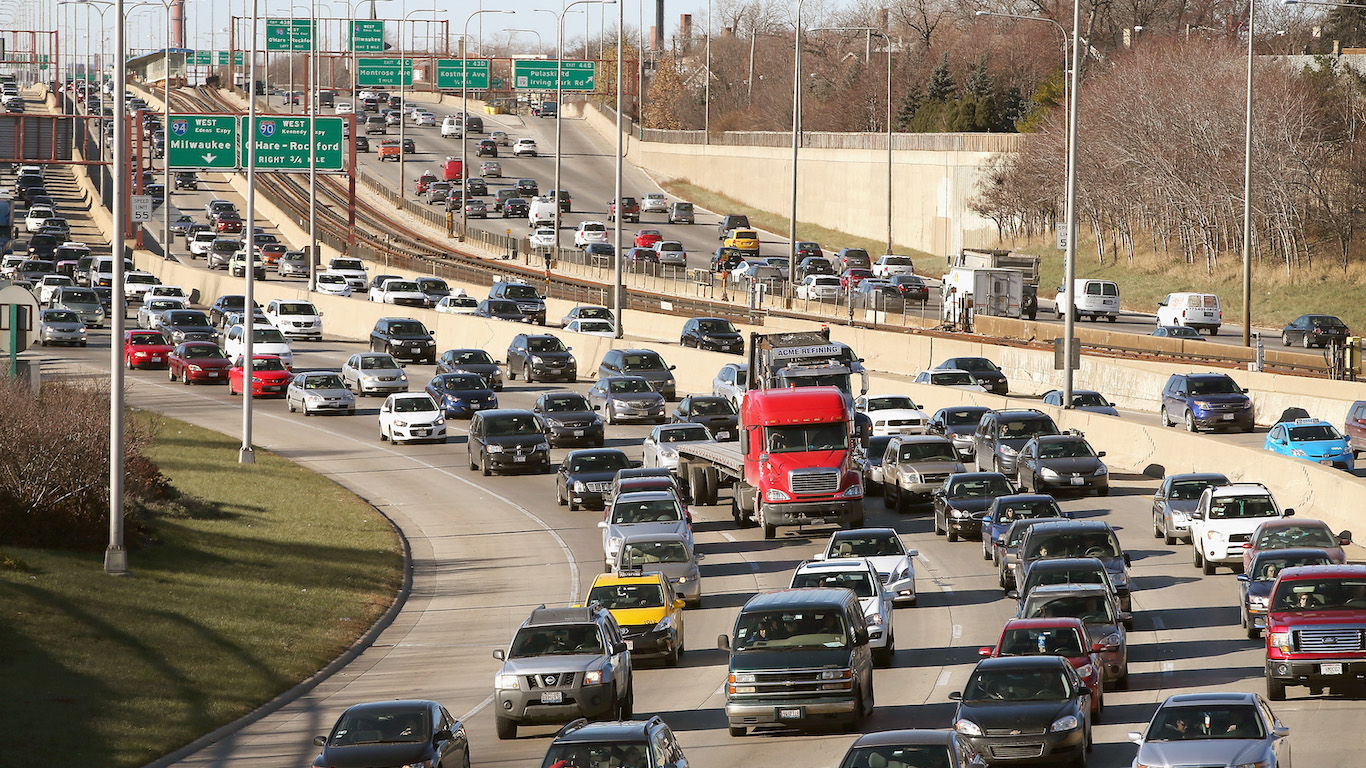
5. Illinois
- Annual peak hours spent in congestion per auto commuter: 64.6
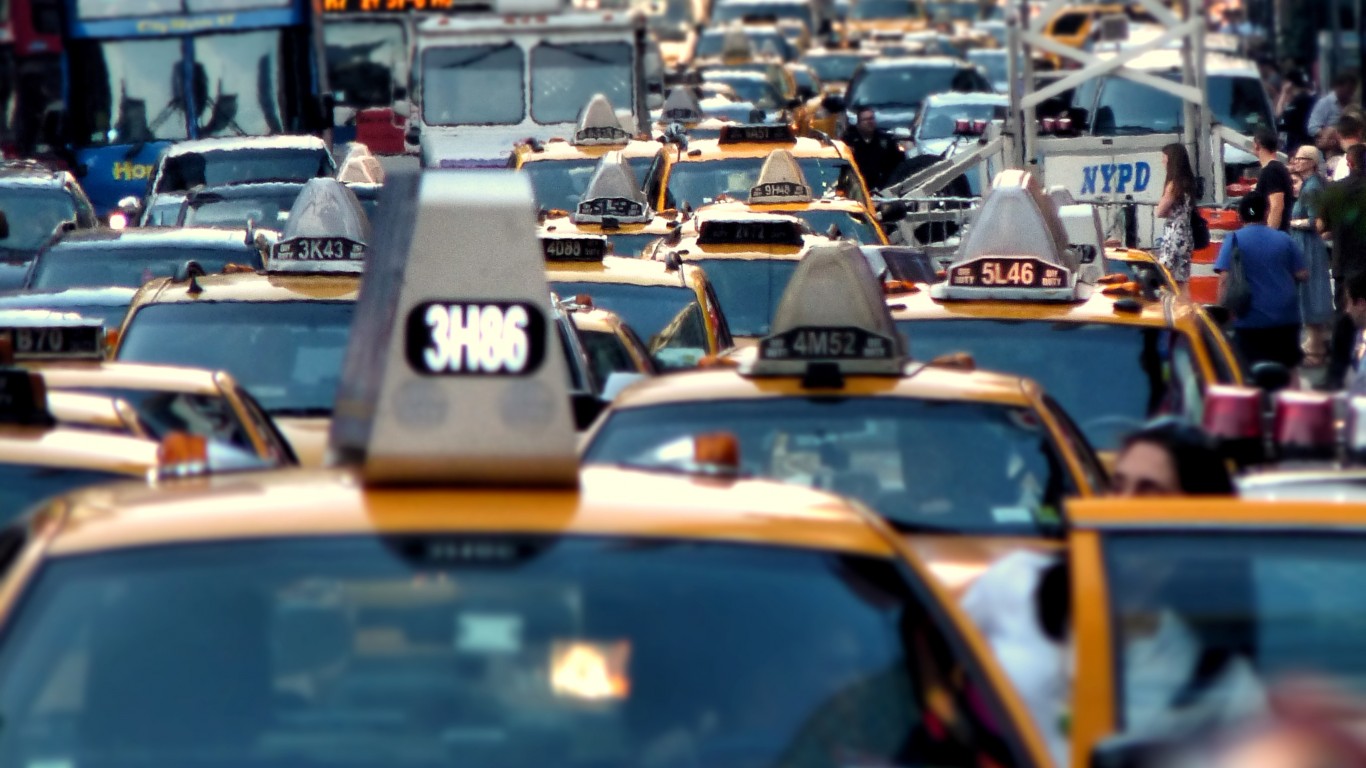
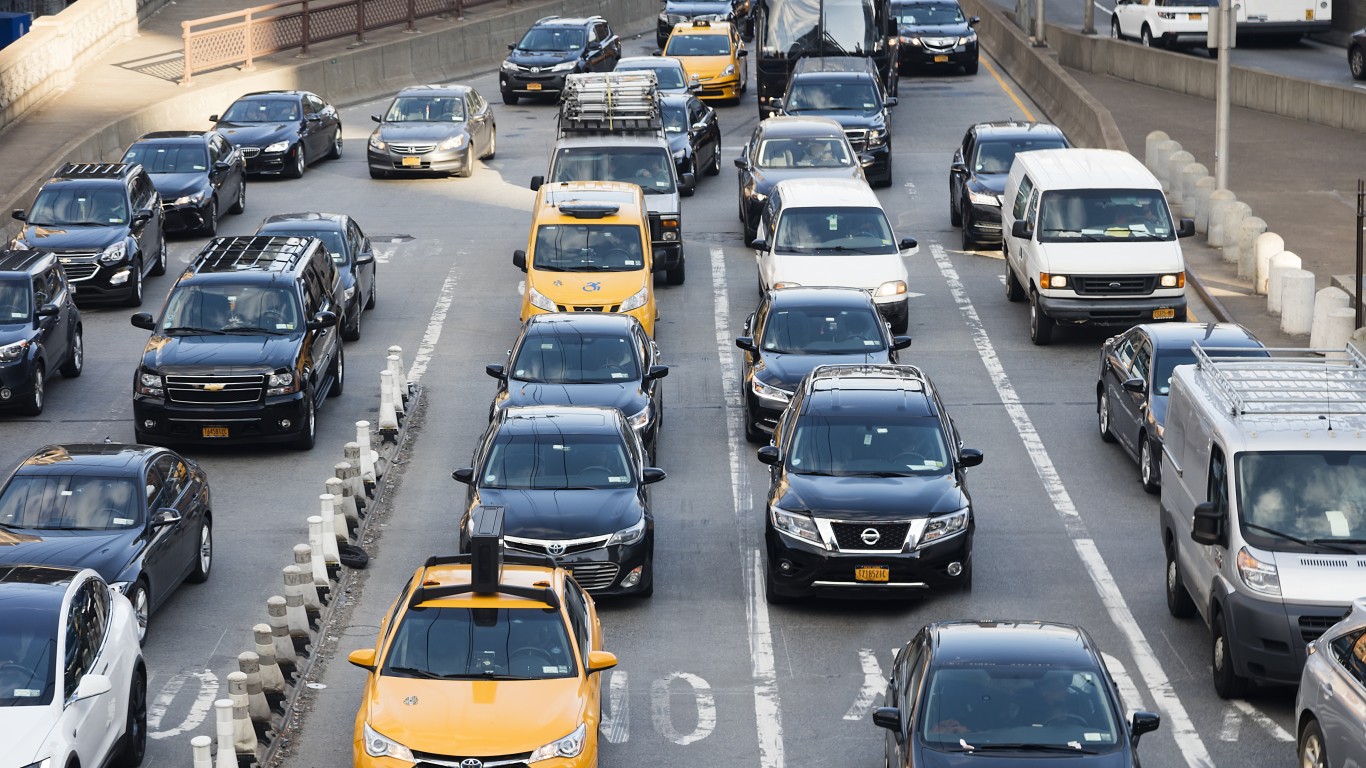
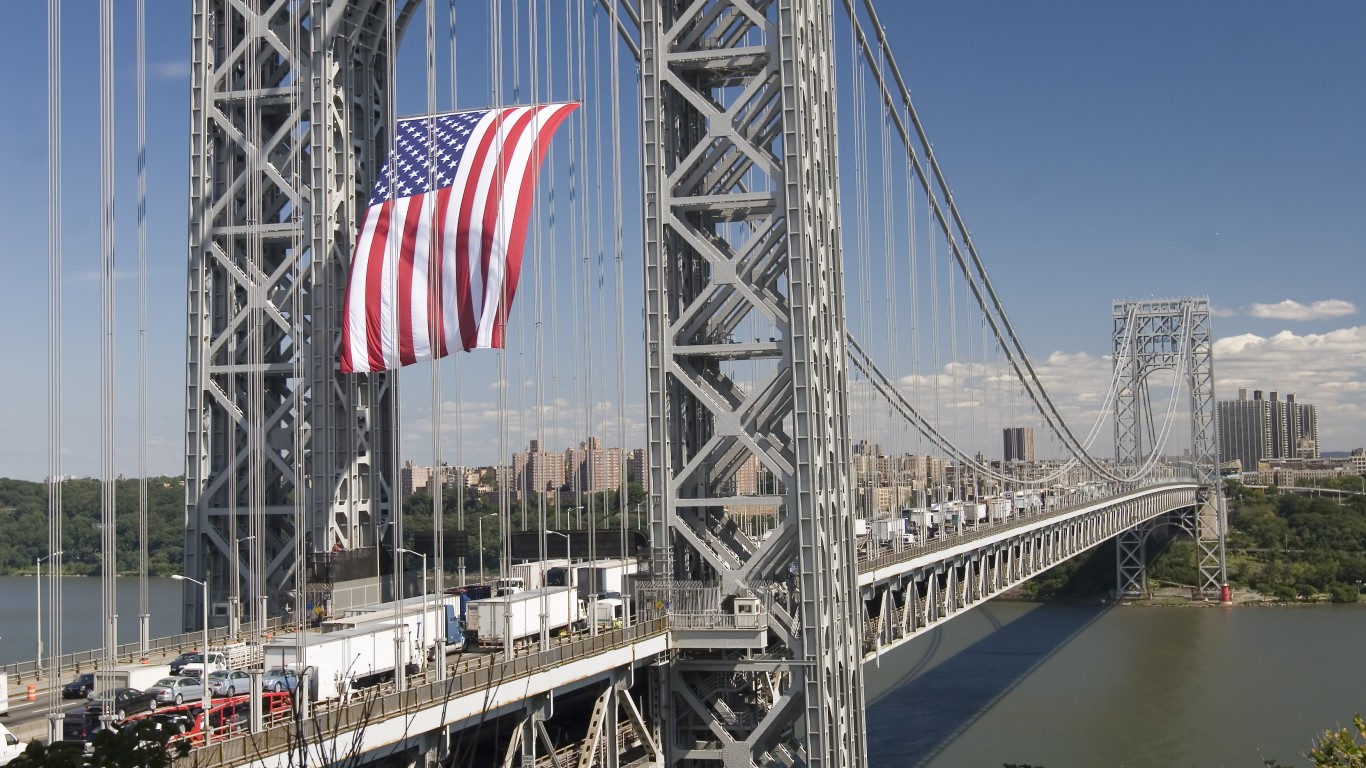
4. New York

- Annual peak hours spent in congestion per auto commuter: 67.92
3. Delaware
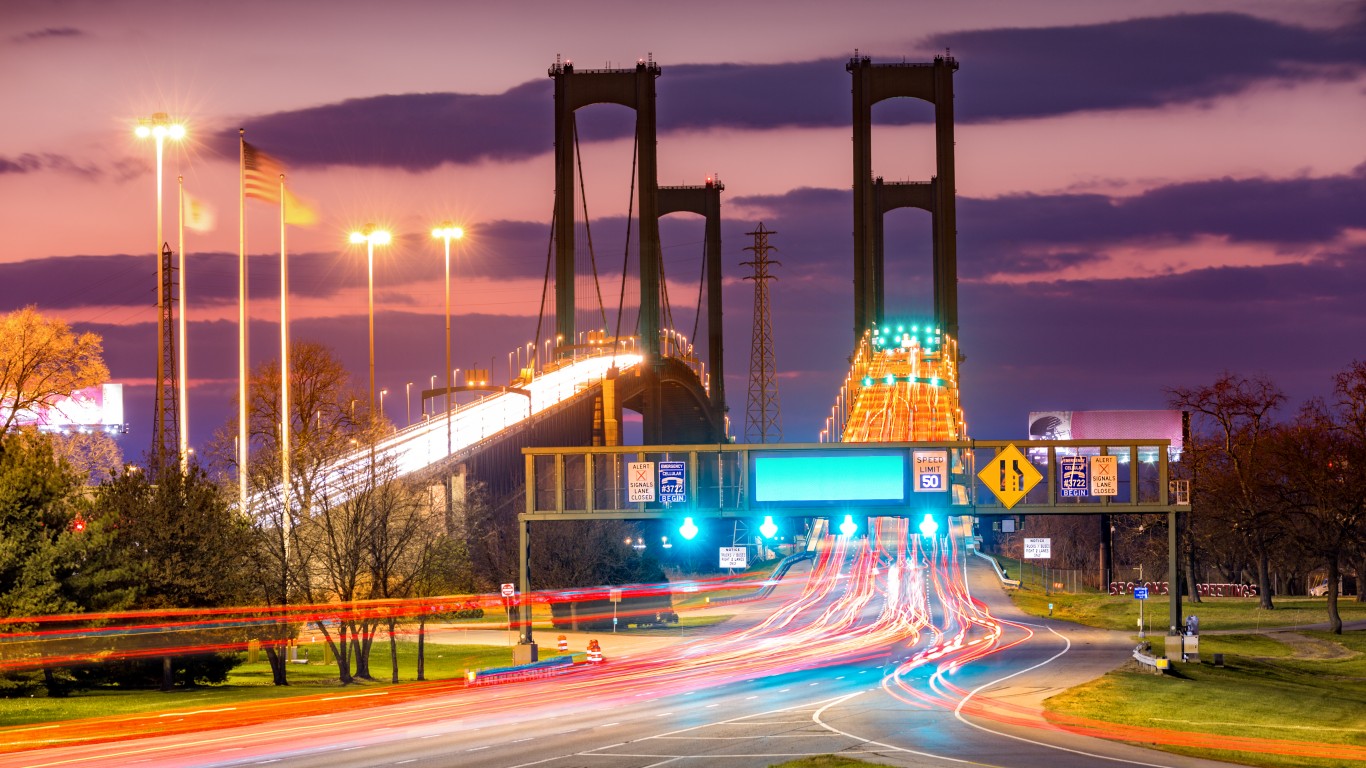
- Annual peak hours spent in congestion per auto commuter: 82.79
2. Massachusetts
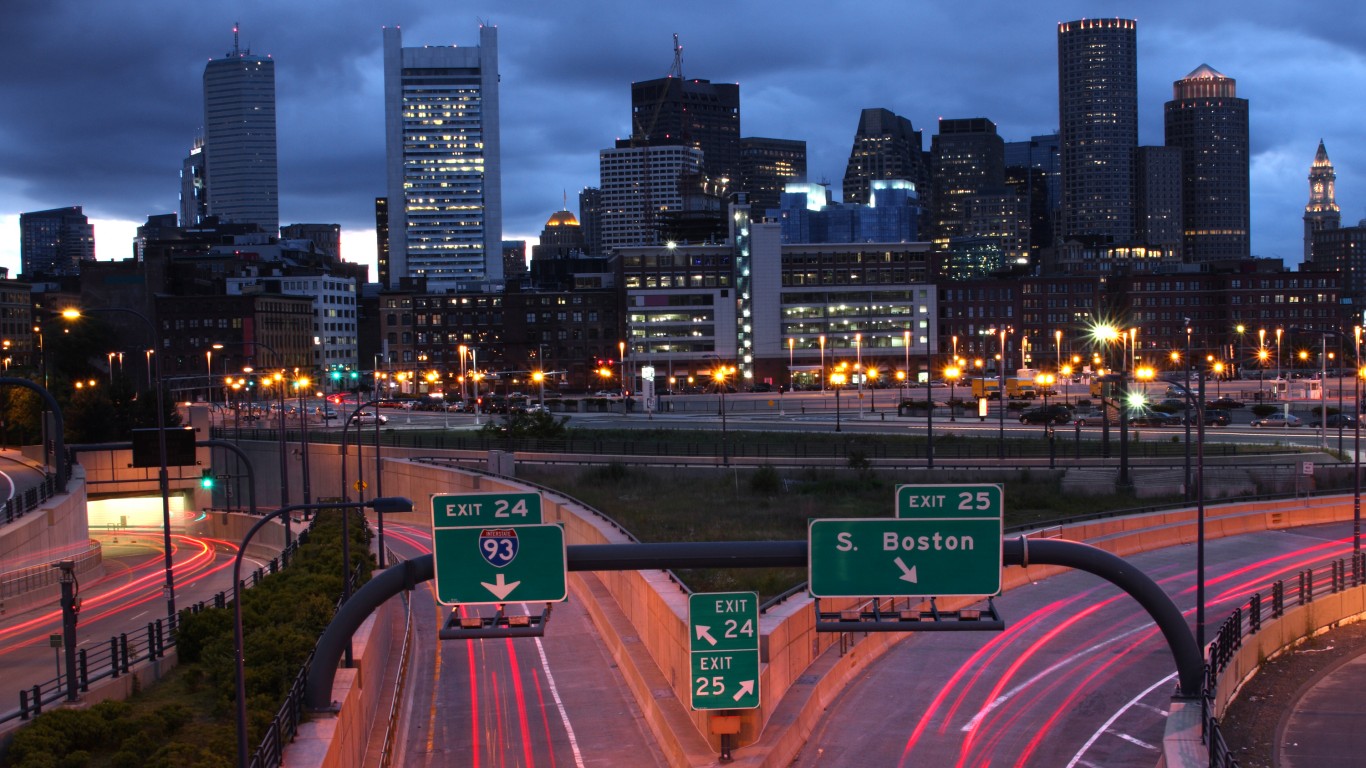
- Annual peak hours spent in congestion per auto commuter: 94.71
1. New Jersey
- Annual peak hours spent in congestion per auto commuter: 103.92