Again, the news may still look bad on the surface. The charts are telling you something entirely different. Gold miners have been forced to revalue the worth of their reserves based on the death march we saw in 2013 in gold. This is much like banks writing down loan values or writing down the value of securities they own.
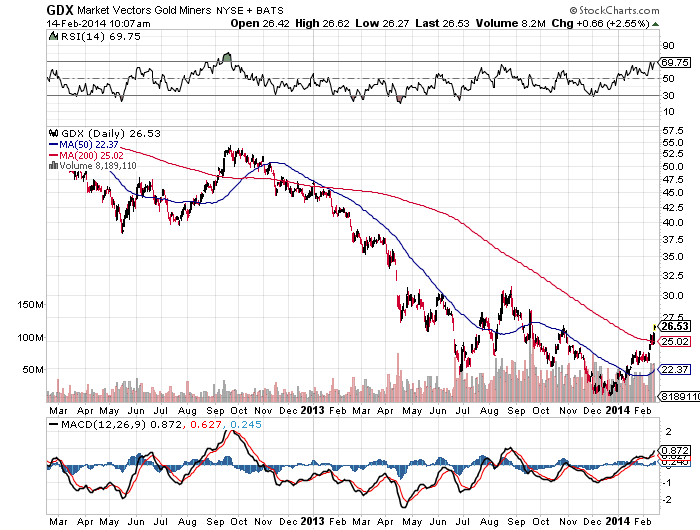
The Market Vectors Gold Miners ETF (NYSEMKT: GDX) is signaling a possible breakout. This is still in the developing stage, but the gold miners index exchange traded fund is signaling the first true breakout under development going back to September of 2012. The difference between then and now is that the ETF price is half of what it was back then.
This is the sort of chart that gold bugs will pay close attention. Our word of warning is that charts are charts, and they often fail to materialize into developments. To prove this point, the chart shows that the gold miners ETF tried four different times in late 2012 and early 2013 to break out of that 200-day moving average overhang. That was when the ETF was up in the $40s, versus the mid-$20s now.
Another word of warning on the wall is from the fundamentals. Many of these gold miners are now trading above the Thomson Reuters consensus price targets. That being said, maybe the targets were lowered too much during the dog days — or maybe the analysts have to raise their targets substantially in the days and weeks ahead.
Barrick Gold Corp. (NYSE: ABX) had seen its stock fall 50% before its recent recovery. Now shares are up more than 2% to $20.55, and the company has lowered its gold reserve valuation. That is not unique for gold miners and producers — after all, the price did crater up until recently. This $20.55 share price on Friday compares to a 52-week range of $13.43 to $32.12. Sadly, much of the recovery here has already been seen, but Barrick trades at only about 12 times expected earnings. It now trades above the consensus price target of $19.50.
Goldcorp Inc. (NYSE: GG) was down more than 40% at one point in 2013, and its 4% gain on Friday took the stock back up to $28.00. With a 52-week range of $20.54 to $34.45, much of its recovery also looks priced in. Goldcorp trades at a much higher premium against earnings — perhaps closer to 30 times expected earnings. It has also now surpassed its consensus analyst price target of $27.08.
Newmont Mining Corp. (NYSE: NEM) has seen the least recovery of the majors. Its stock was down by about 50% in late 2013, and a 2% gain on Friday has shares at $24.05. Newmont’s 52-week range is $20.79 to $43.80. This one remains down the most from its peak, but the consensus analyst price target is only up at $24.45.
Silver Wheaton Corp. (NYSE: SLW) cannot be ignored here as well. This one is more silver, but it had higher gold ambitions before the prices tanked. This gain on Friday is up 3.5% at $25.61, and the 52-week range is $17.75 to $35.92. Silver Wheaton is up already close to 50% from its lows, but the consensus analyst price target is $28.40. Silver is what we and others have referred to as the devil’s metal, and this proves just how volatile it can be.
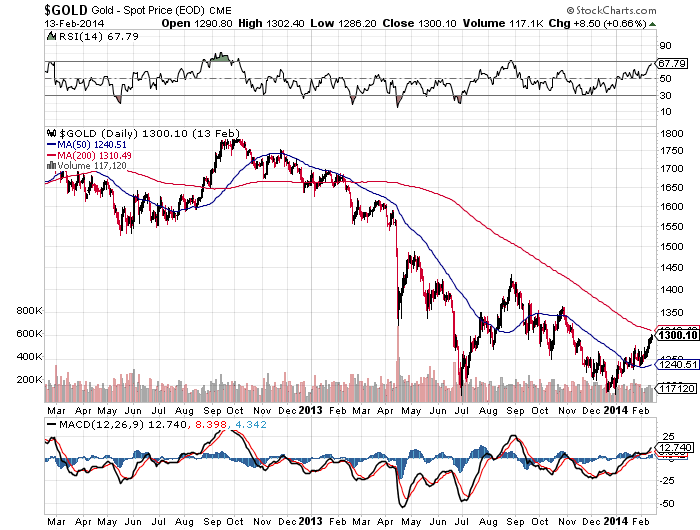
In order to talk about gold miners, the reference to real gold has to be considered as well. The gold chart over the past two years after the GDX ETF chart shows that the shiny yellow metal has not yet broken over the key 200-day moving average. Still, gold is now at $1,300 per ounce again. The 200-day moving average is shown to be roughly $1,310. Gold has not even flirted with its 200-day moving average since February of 2013, and that was back at $1,650 or so.
A final word of warning is that for a stock or any asset to break out on the chart generally means that much of the rally has already been seen. That being said, chart watchers will pay close attention here — and it is safe to assume that many short sellers will be betting against this move developing.