24/7 Wall St. Insight
- Municipalities can annex land for expansion
- Some growing cities, by population, also annex land to grow their area
To determine the cities annexing new land to accommodate population growth, reviewed data on historical city boundaries from the U.S. Census Bureau’s TIGER/Line shapefile program. Cities were ranked based on the raw change in total boundary area from 2010 to 2023. Boundary definitions are at the place level and are from the U.S. Census Bureau. Only cities with at least 100 square miles of area in 2010 were considered. Supplemental data used to calculate population growth from 2010 to 2022 are from the Census Bureau’s American Community Survey program and are five-year estimates. Note that changes in city boundary area over time may not be entirely due to annexation.
Population growth in 22 of the 25 cities on the list was well over 10% from 2010 to 2023. Considering where most of these cities are located this is likely not surprising as the recent trend of population migration has been to the South and to the Sun Belt. Indeed, cities in Texas, North Carolina, Nevada, Arizona, and Florida comprise the list.
Why are we covering this
25. Savannah, GA

- City boundary area in 2023: 113.7 sq. mi (+4.9 sq. mi since 2010)
- City boundary area in 2010: 108.7 sq. mi
- Population growth, 2010 to 2022: +9.9%
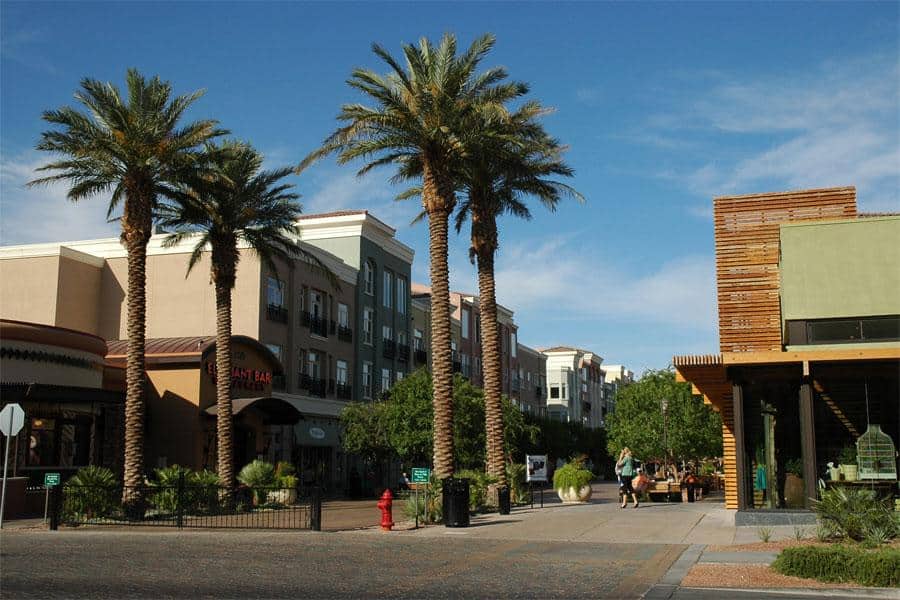
24. Mesa, AZ
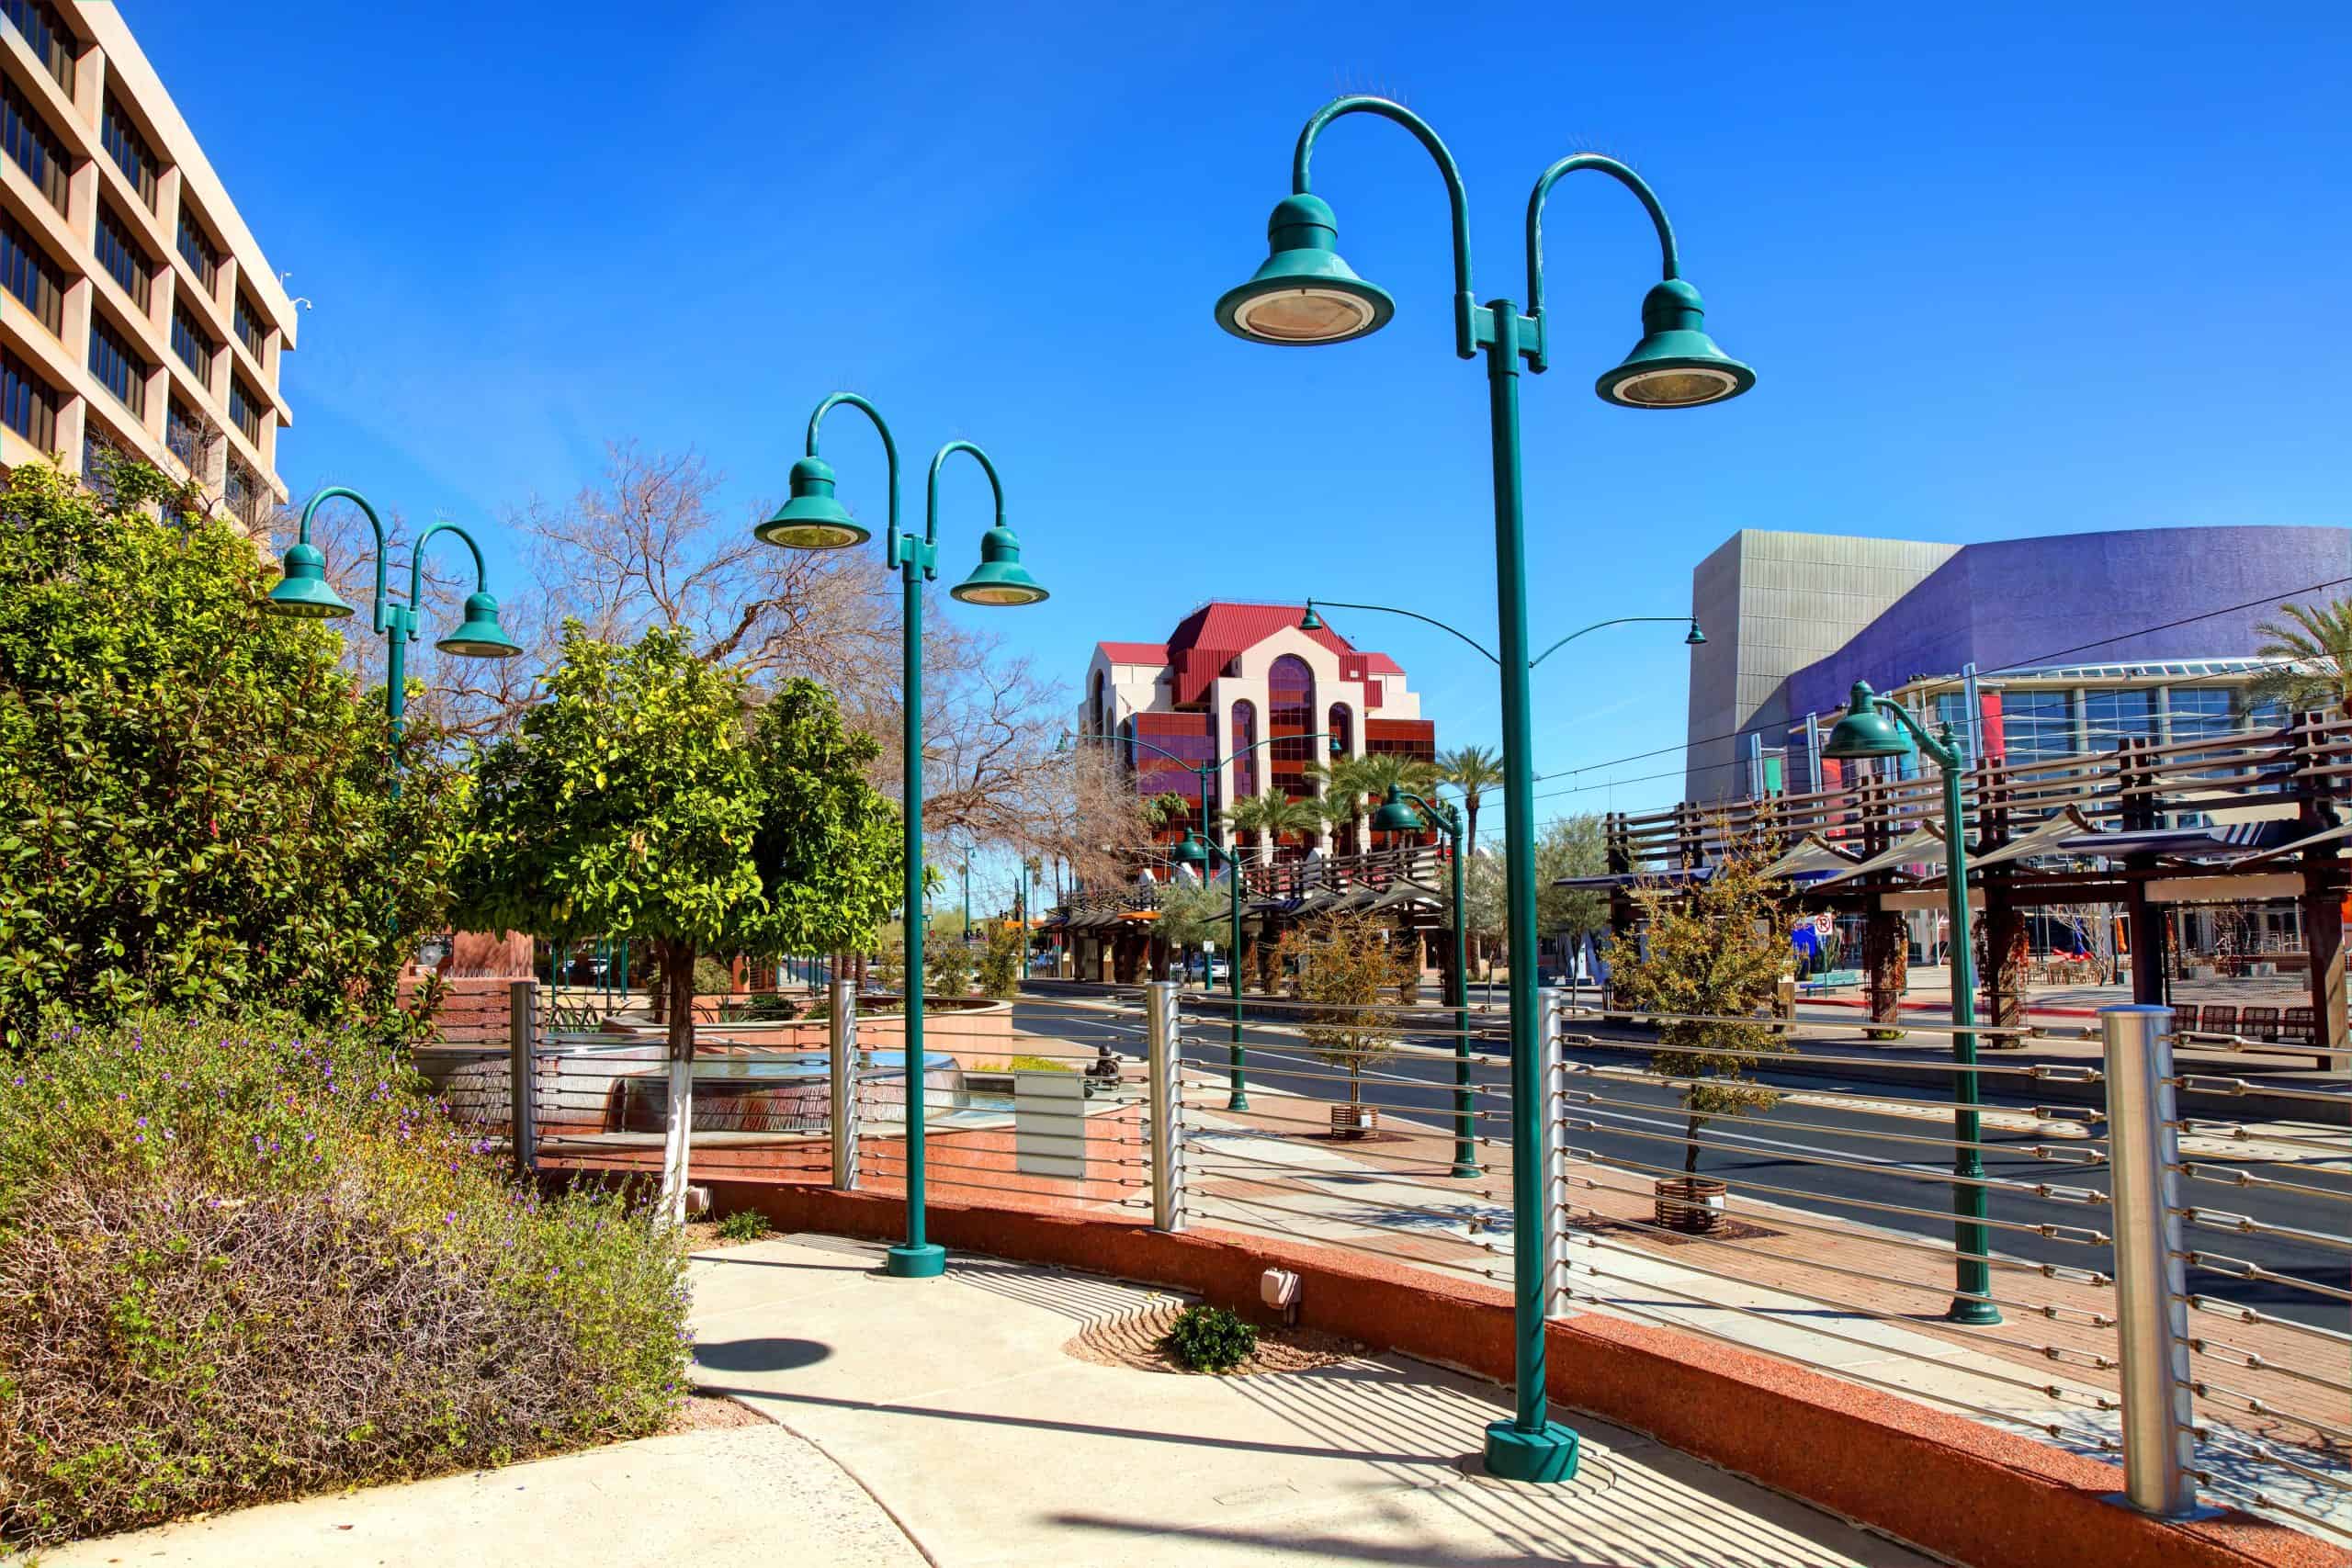
- City boundary area in 2023: 142.0 sq. mi (+5.0 sq. mi since 2010)
- City boundary area in 2010: 137.1 sq. mi
- Population growth, 2010 to 2022: +14.5%
23. Chattanooga, TN
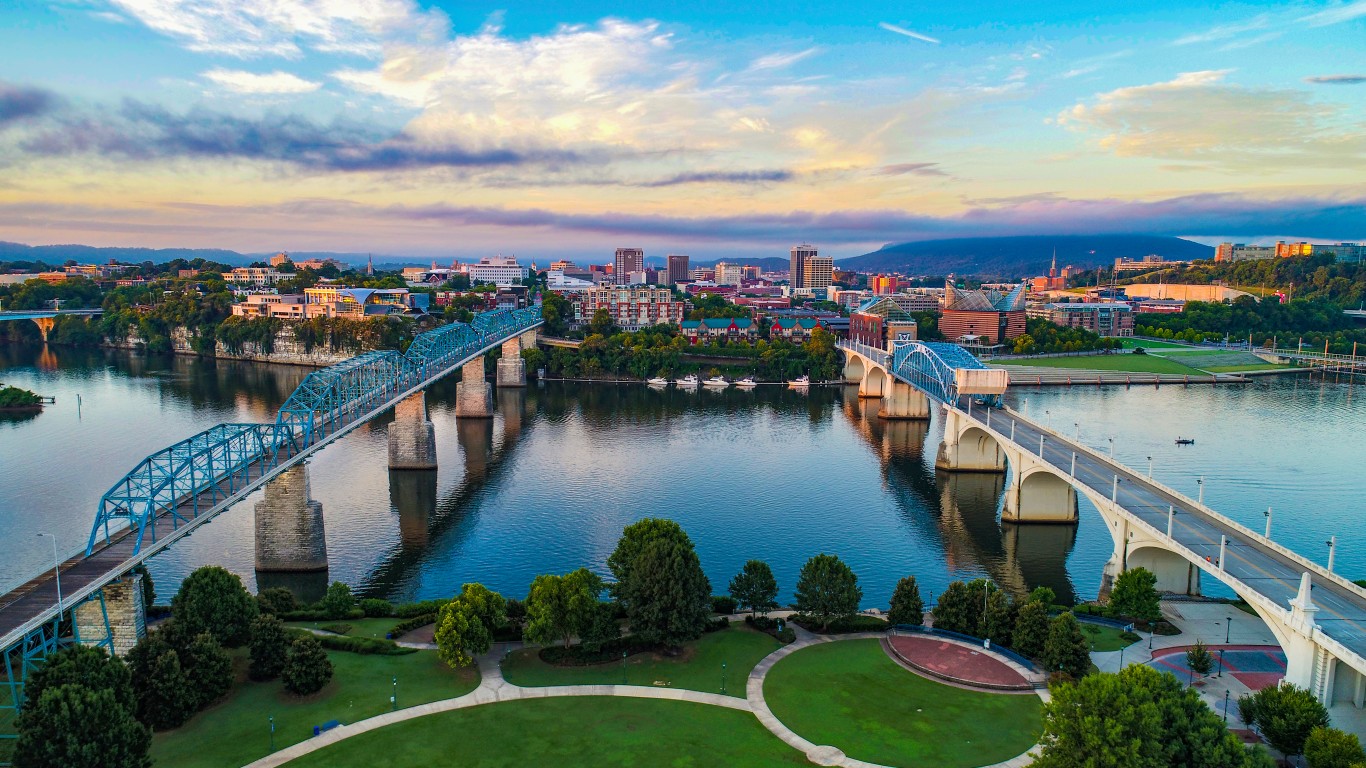
- City boundary area in 2023: 150.1 sq. mi (+5.5 sq. mi since 2010)
- City boundary area in 2010: 144.5 sq. mi
- Population growth, 2010 to 2022: +10.2%
22. Port St. Lucie, FL
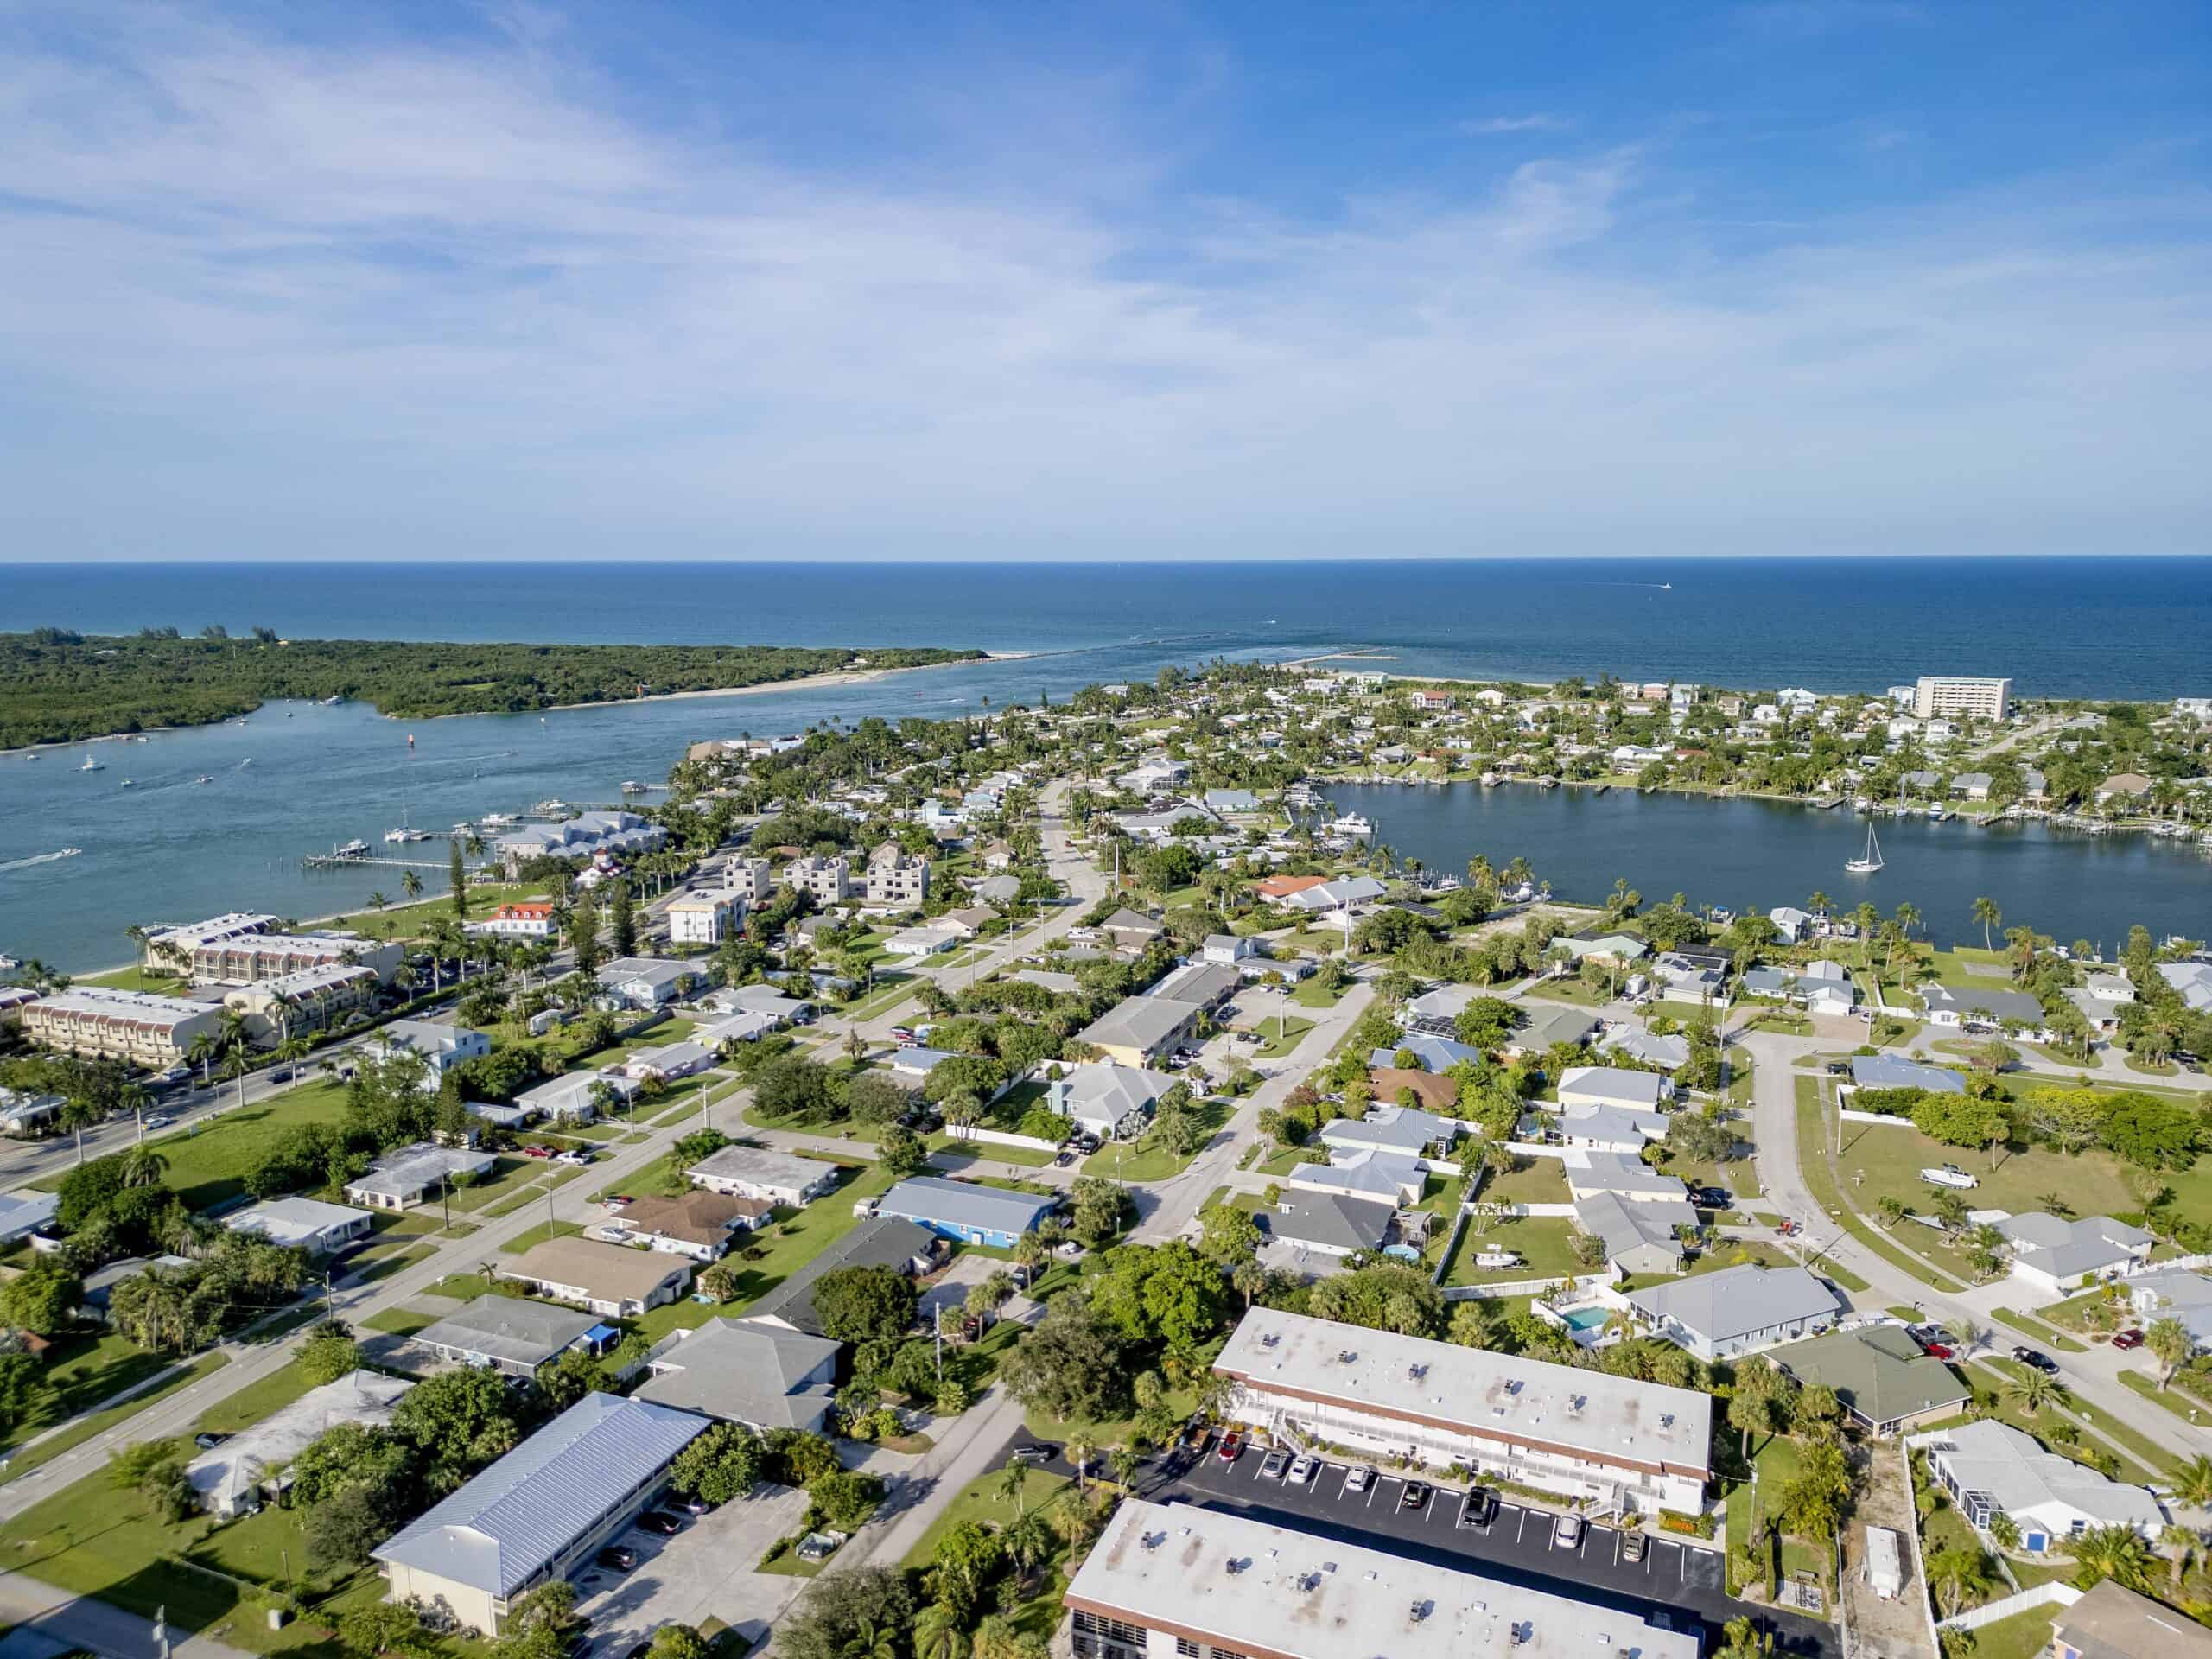
- City boundary area in 2023: 120.8 sq. mi (+5.6 sq. mi since 2010)
- City boundary area in 2010: 115.2 sq. mi
- Population growth, 2010 to 2022: +35.8%
21. Reno, NV

- City boundary area in 2023: 111.8 sq. mi (+6.0 sq. mi since 2010)
- City boundary area in 2010: 105.9 sq. mi
- Population growth, 2010 to 2022: +20.0%
20. Las Vegas, NV

- City boundary area in 2023: 141.9 sq. mi (+6.0 sq. mi since 2010)
- City boundary area in 2010: 135.9 sq. mi
- Population growth, 2010 to 2022: +11.2%
19. Columbia, SC

- City boundary area in 2023: 141.1 sq. mi (+6.2 sq. mi since 2010)
- City boundary area in 2010: 134.9 sq. mi
- Population growth, 2010 to 2022: +7.2%
18. Raleigh, NC

- City boundary area in 2023: 150.5 sq. mi (+6.5 sq. mi since 2010)
- City boundary area in 2010: 144.0 sq. mi
- Population growth, 2010 to 2022: +21.6%
17. Greensboro, NC
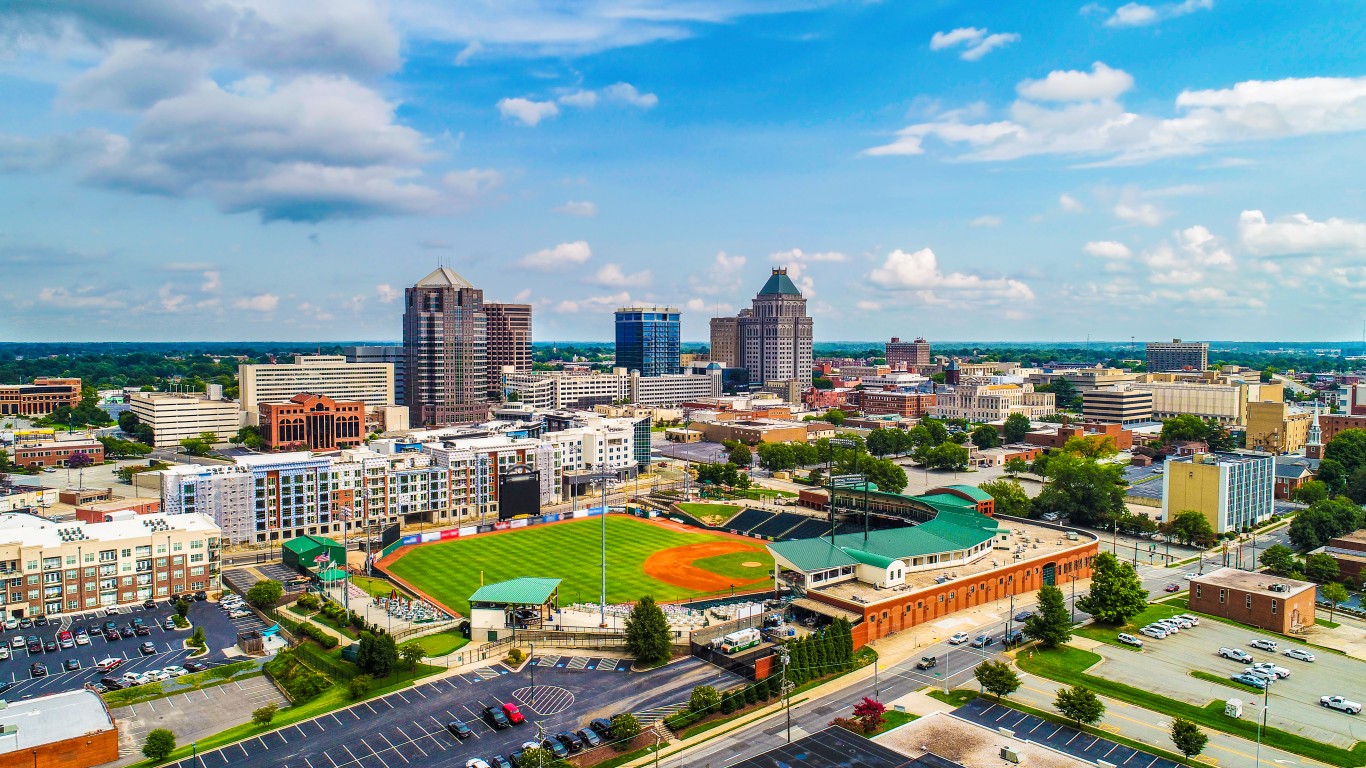
- City boundary area in 2023: 139.1 sq. mi (+7.3 sq. mi since 2010)
- City boundary area in 2010: 131.8 sq. mi
- Population growth, 2010 to 2022: +12.9%
16. Colorado Springs, CO
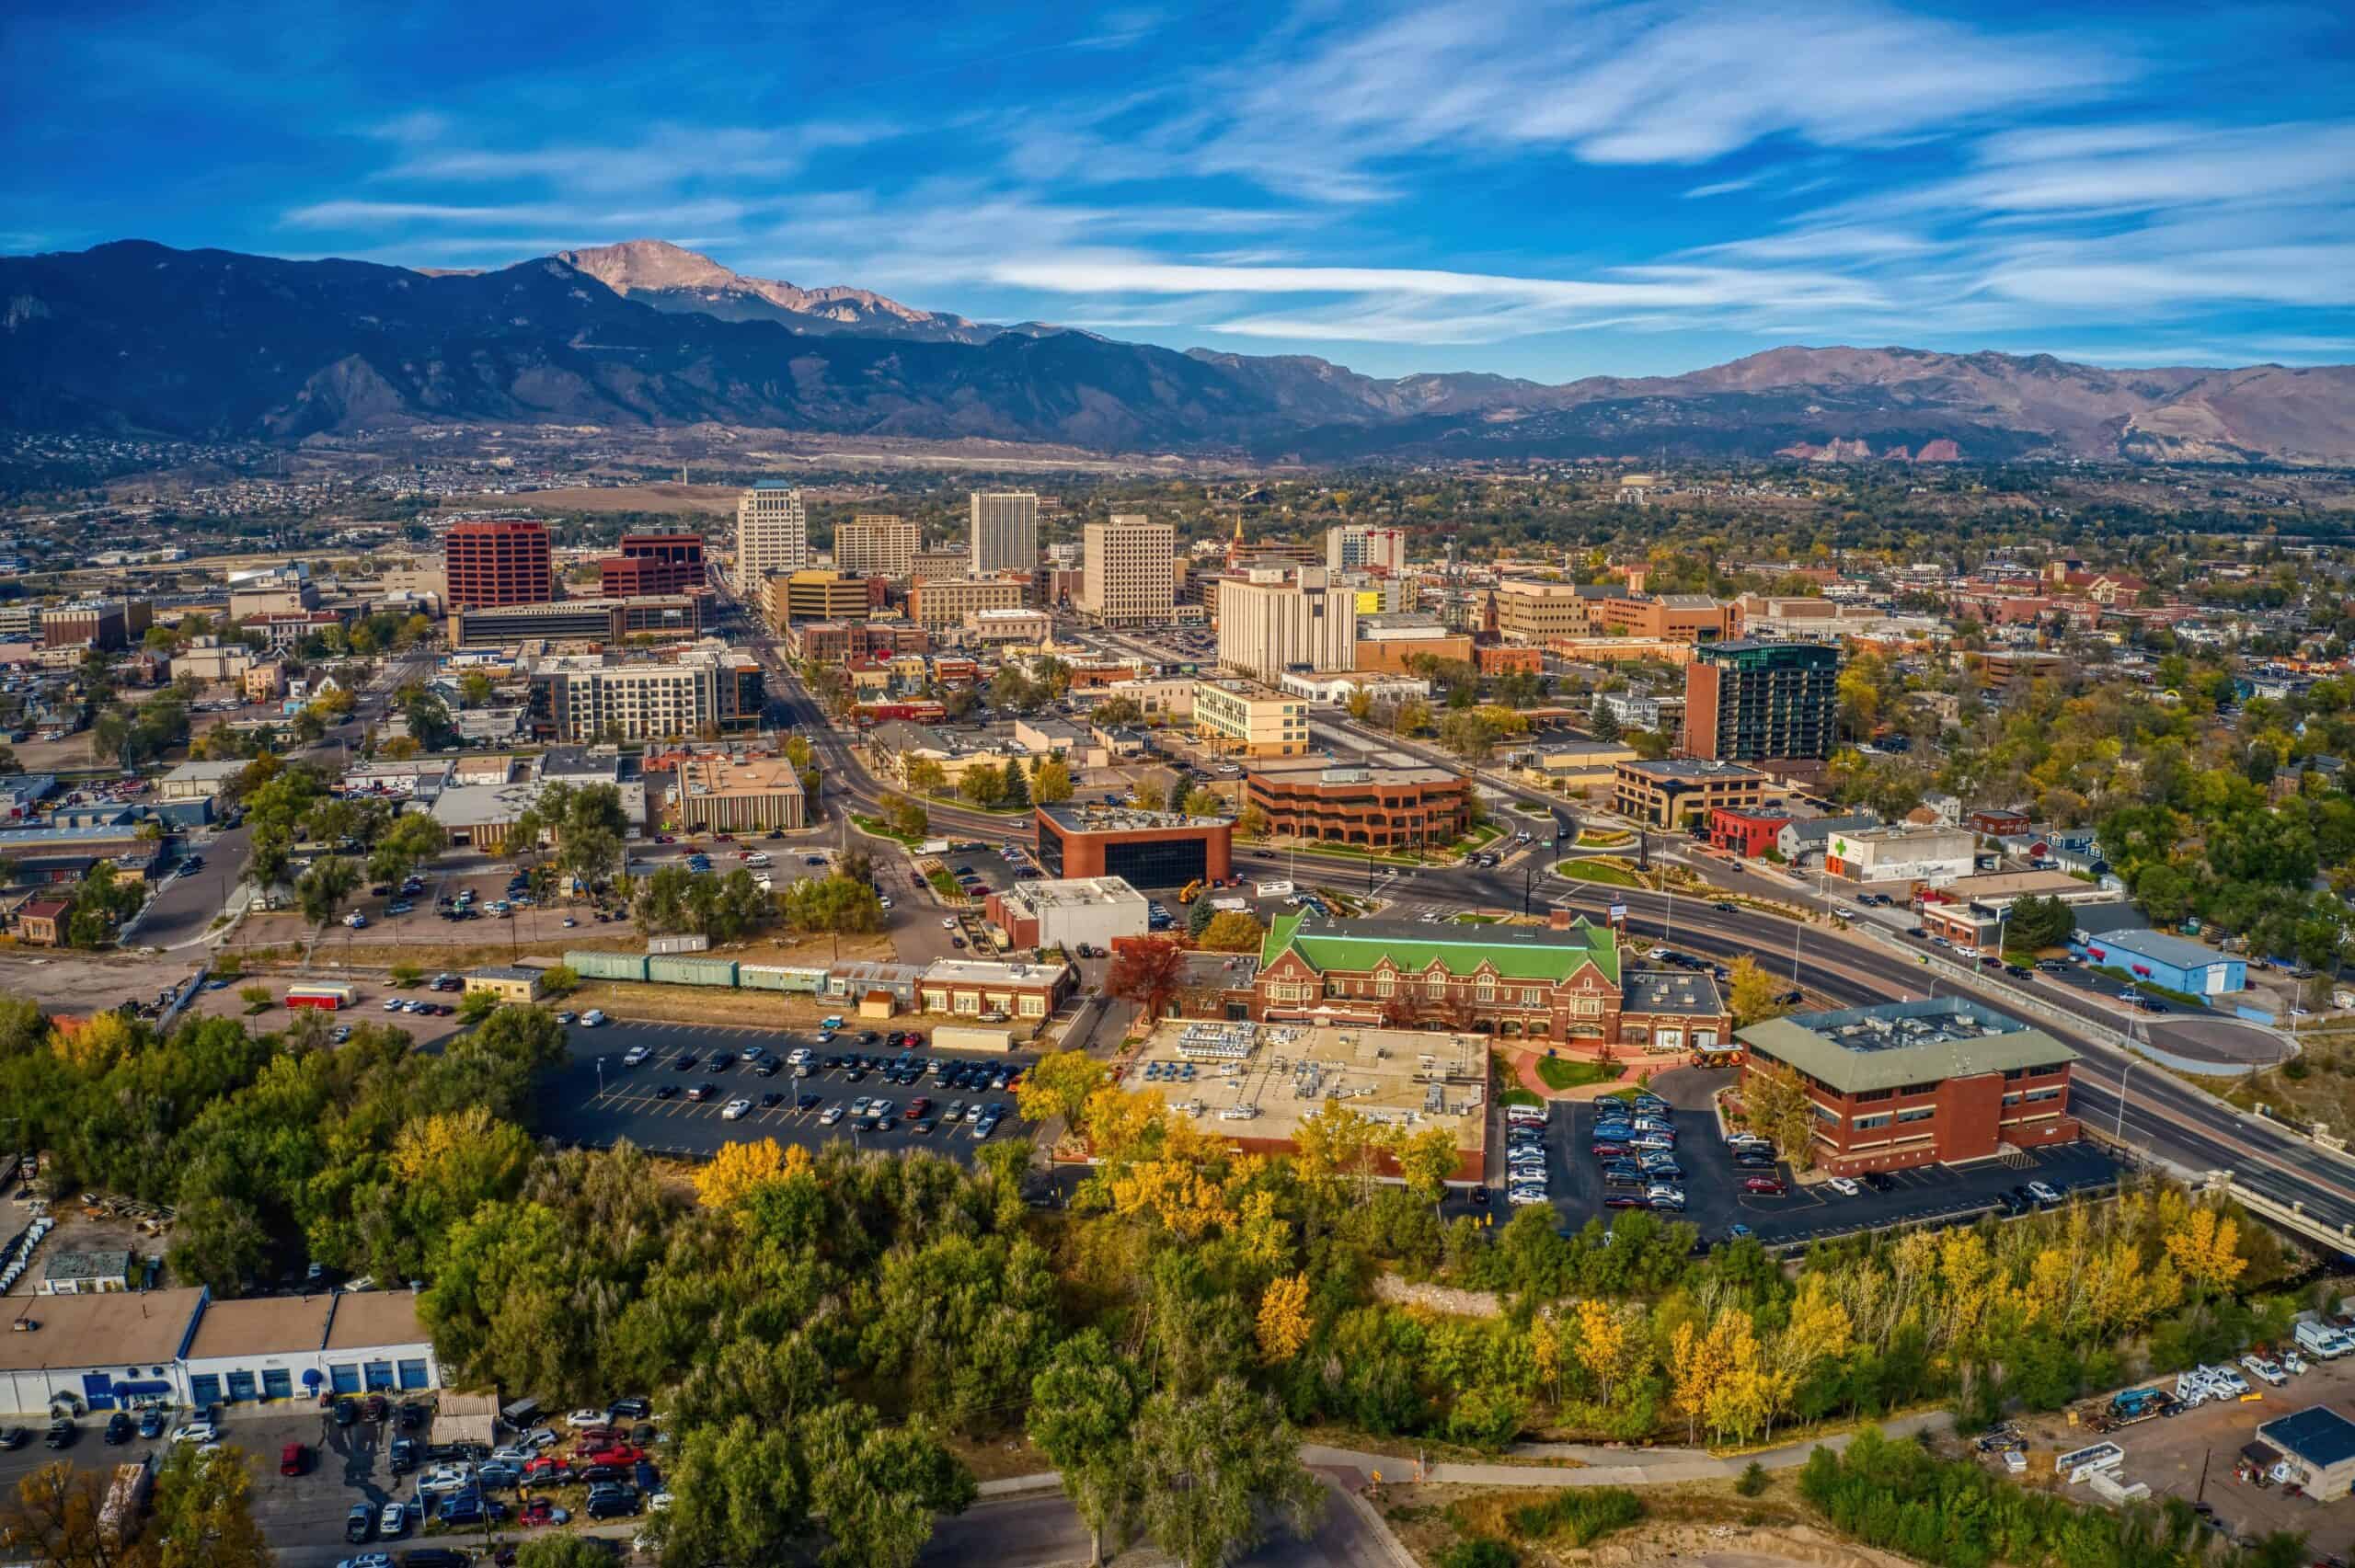
- City boundary area in 2023: 202.2 sq. mi (+7.3 sq. mi since 2010)
- City boundary area in 2010: 194.9 sq. mi
- Population growth, 2010 to 2022: +18.7%
15. Bakersfield, CA

- City boundary area in 2023: 151.7 sq. mi (+8.1 sq. mi since 2010)
- City boundary area in 2010: 143.6 sq. mi
- Population growth, 2010 to 2022: +21.8%
14. Aurora, CO
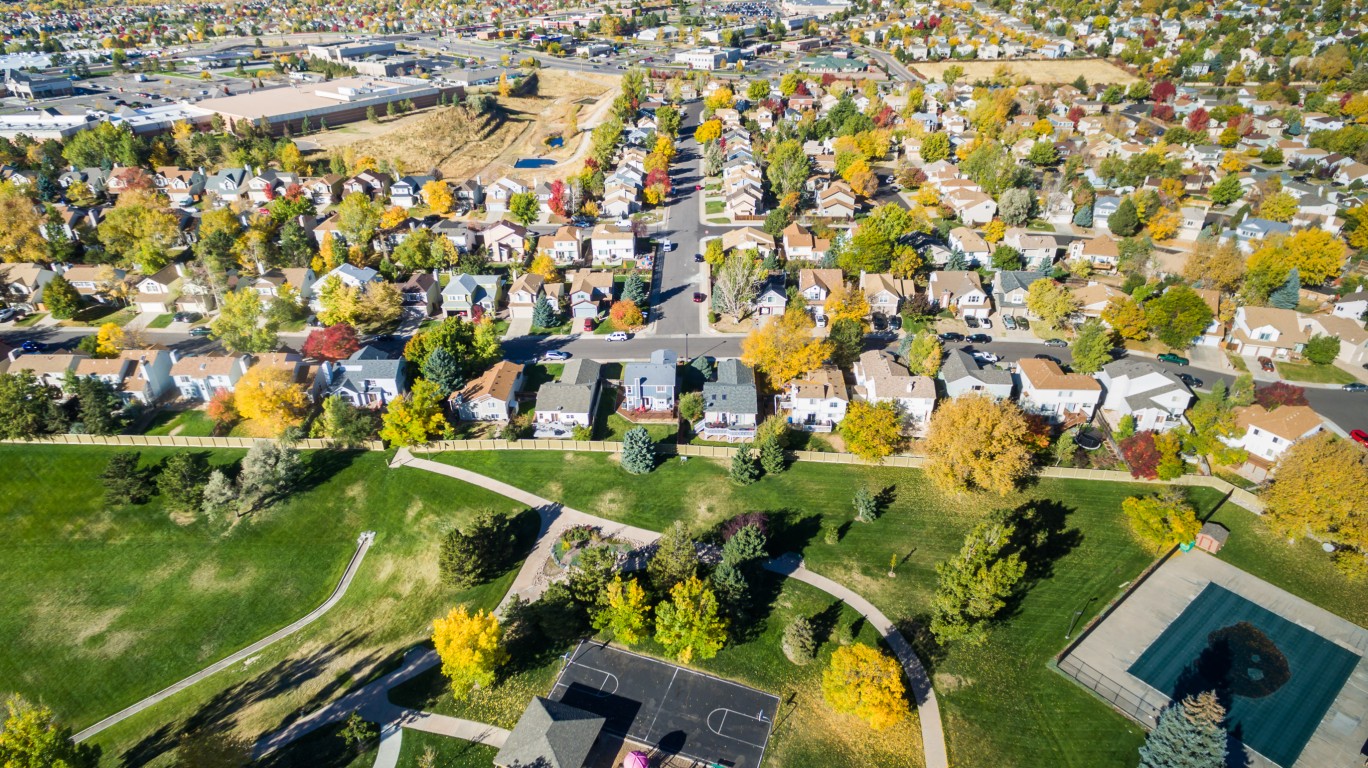
- City boundary area in 2023: 163.6 sq. mi (+8.2 sq. mi since 2010)
- City boundary area in 2010: 155.4 sq. mi
- Population growth, 2010 to 2022: +23.3%
13. Orlando, FL
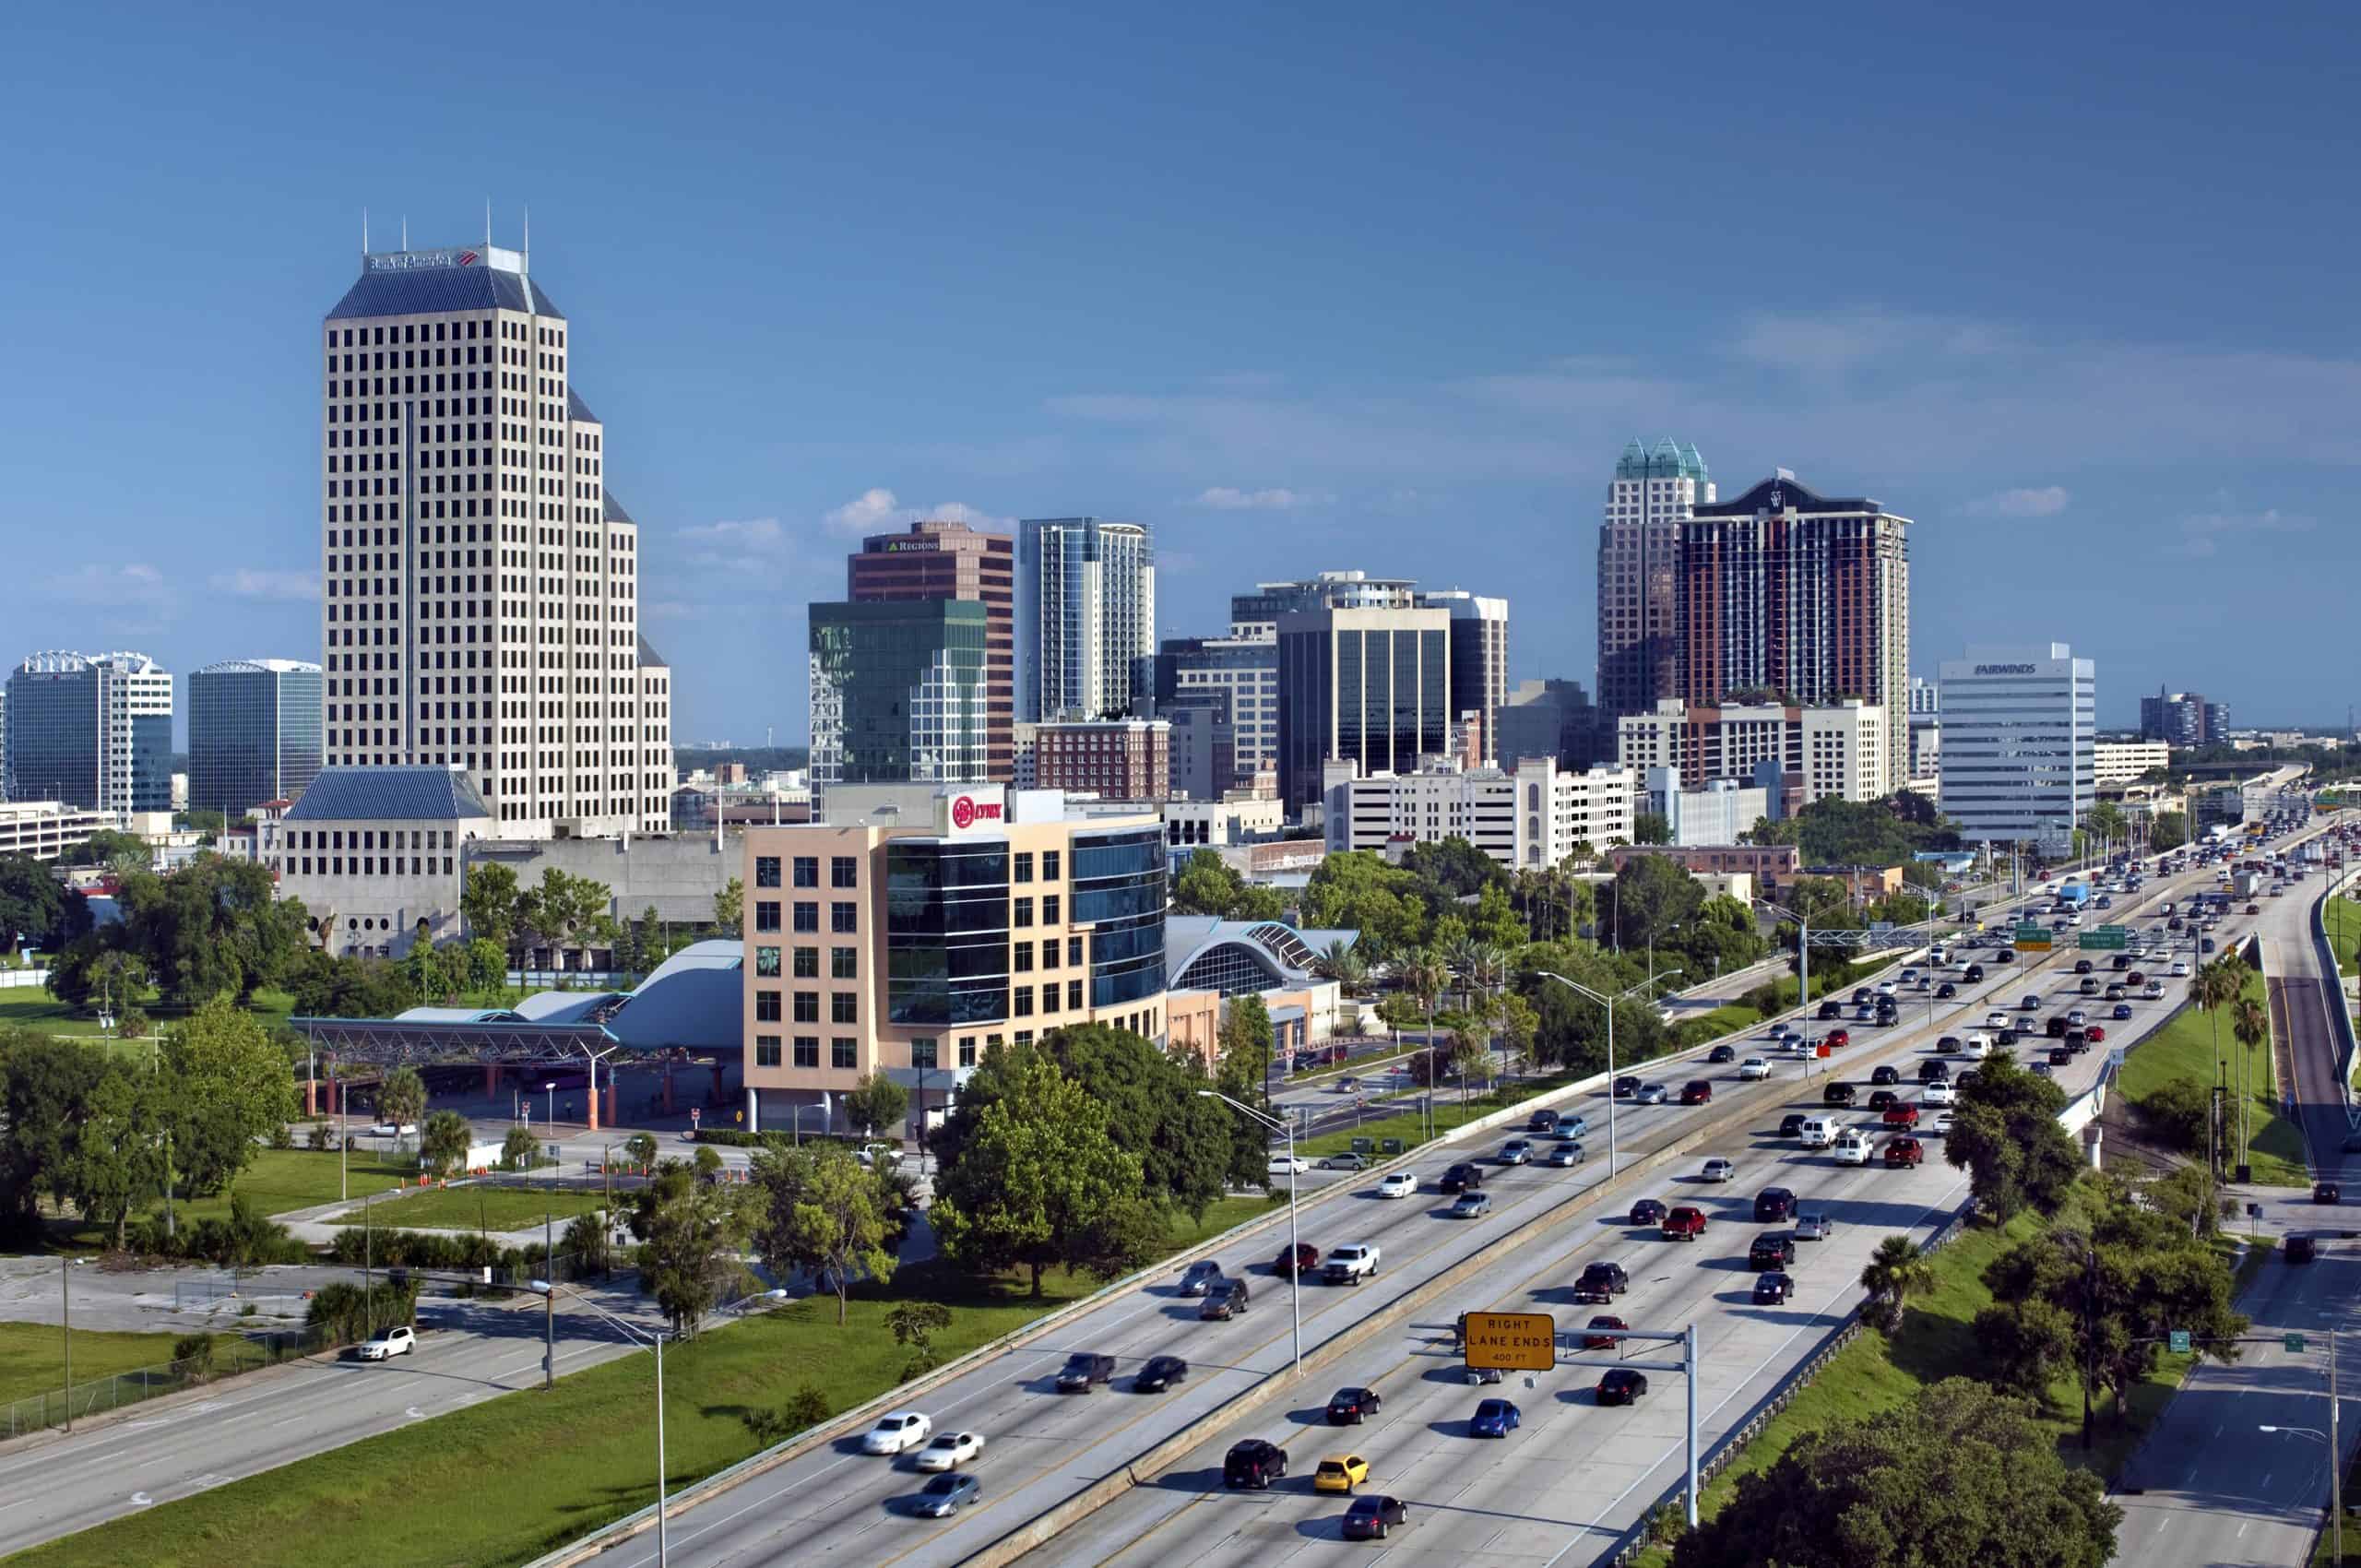
- City boundary area in 2023: 119.5 sq. mi (+8.8 sq. mi since 2010)
- City boundary area in 2010: 110.7 sq. mi
- Population growth, 2010 to 2022: +31.7%
12. Durham, NC
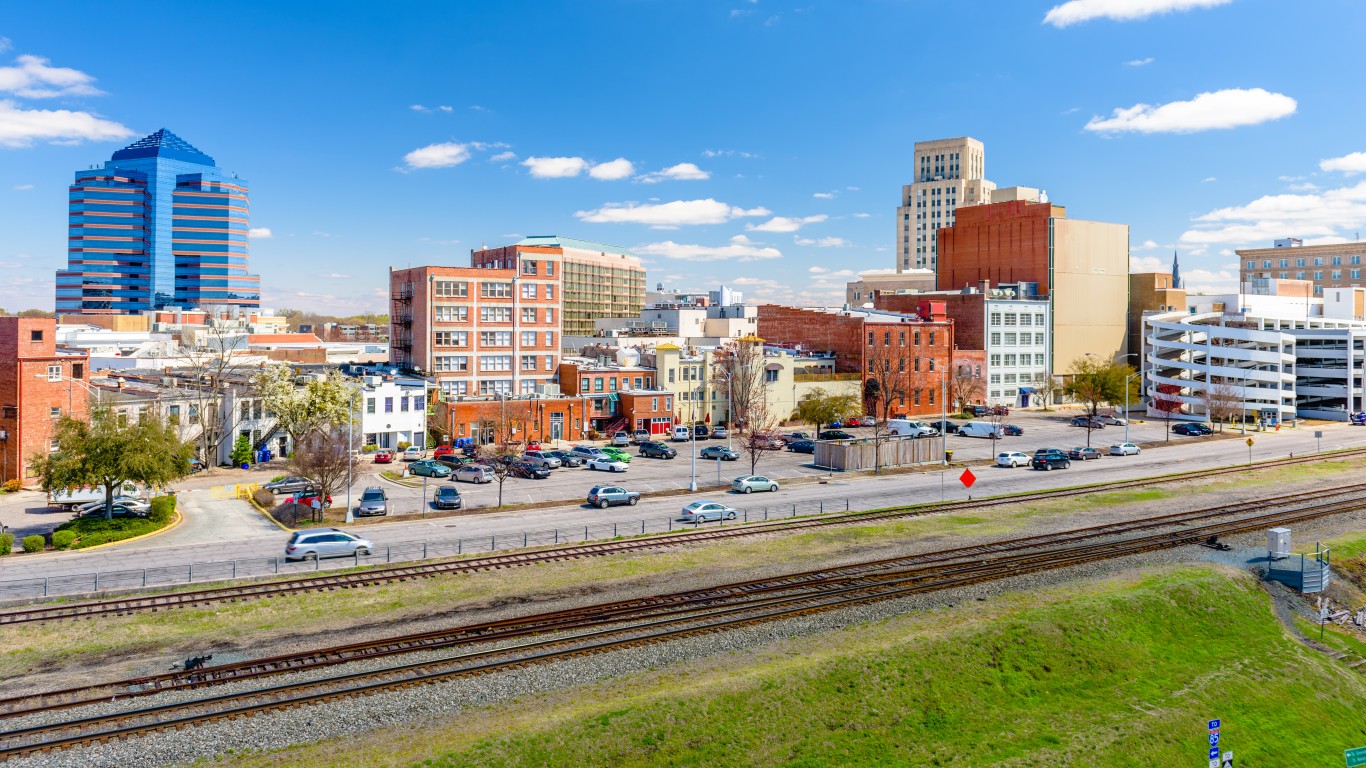
- City boundary area in 2023: 117.6 sq. mi (+9.3 sq. mi since 2010)
- City boundary area in 2010: 108.3 sq. mi
- Population growth, 2010 to 2022: +28.9%
11. Fort Worth, TX

- City boundary area in 2023: 358.6 sq. mi (+10.7 sq. mi since 2010)
- City boundary area in 2010: 347.9 sq. mi
- Population growth, 2010 to 2022: +31.1%
10. Charlotte, NC

- City boundary area in 2023: 312.7 sq. mi (+13.1 sq. mi since 2010)
- City boundary area in 2010: 299.7 sq. mi
- Population growth, 2010 to 2022: +24.0%
9. Henderson, NV
- City boundary area in 2023: 121.0 sq. mi (+13.3 sq. mi since 2010)
- City boundary area in 2010: 107.7 sq. mi
- Population growth, 2010 to 2022: +27.6%
8. Huntsville, AL
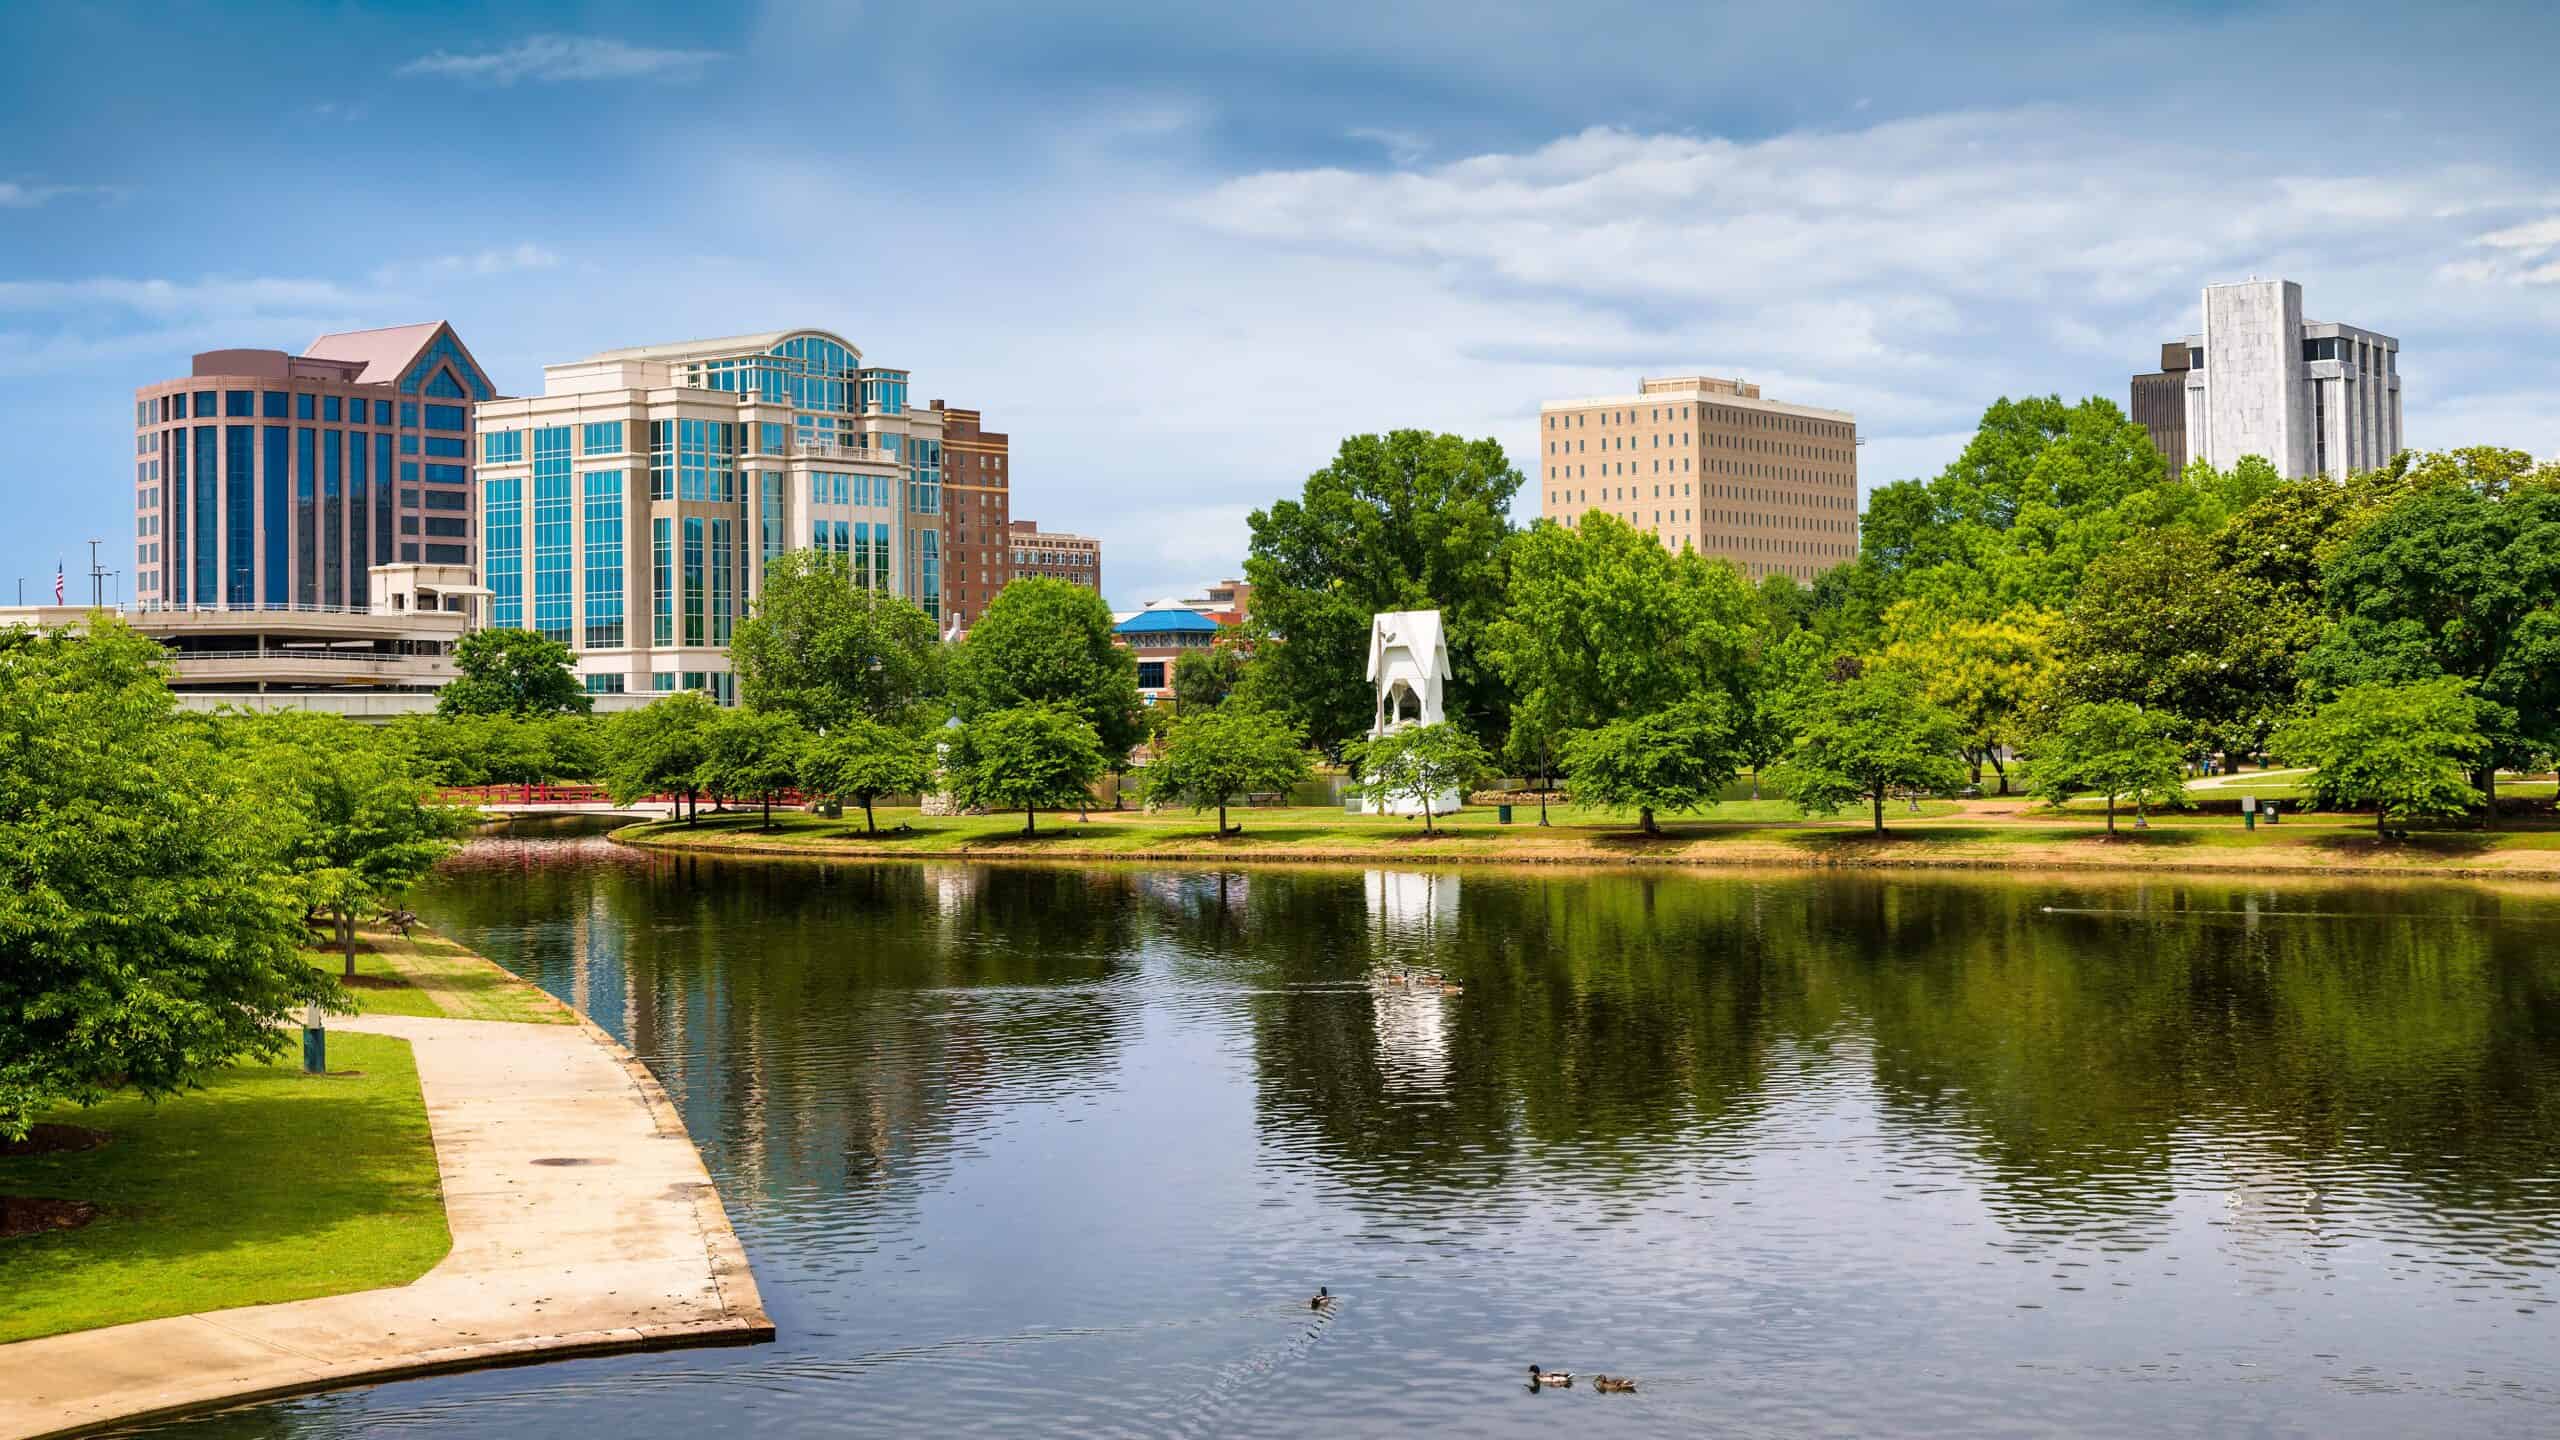
- City boundary area in 2023: 225.2 sq. mi (+14.8 sq. mi since 2010)
- City boundary area in 2010: 210.4 sq. mi
- Population growth, 2010 to 2022: +22.6%
7. Tucson, AZ
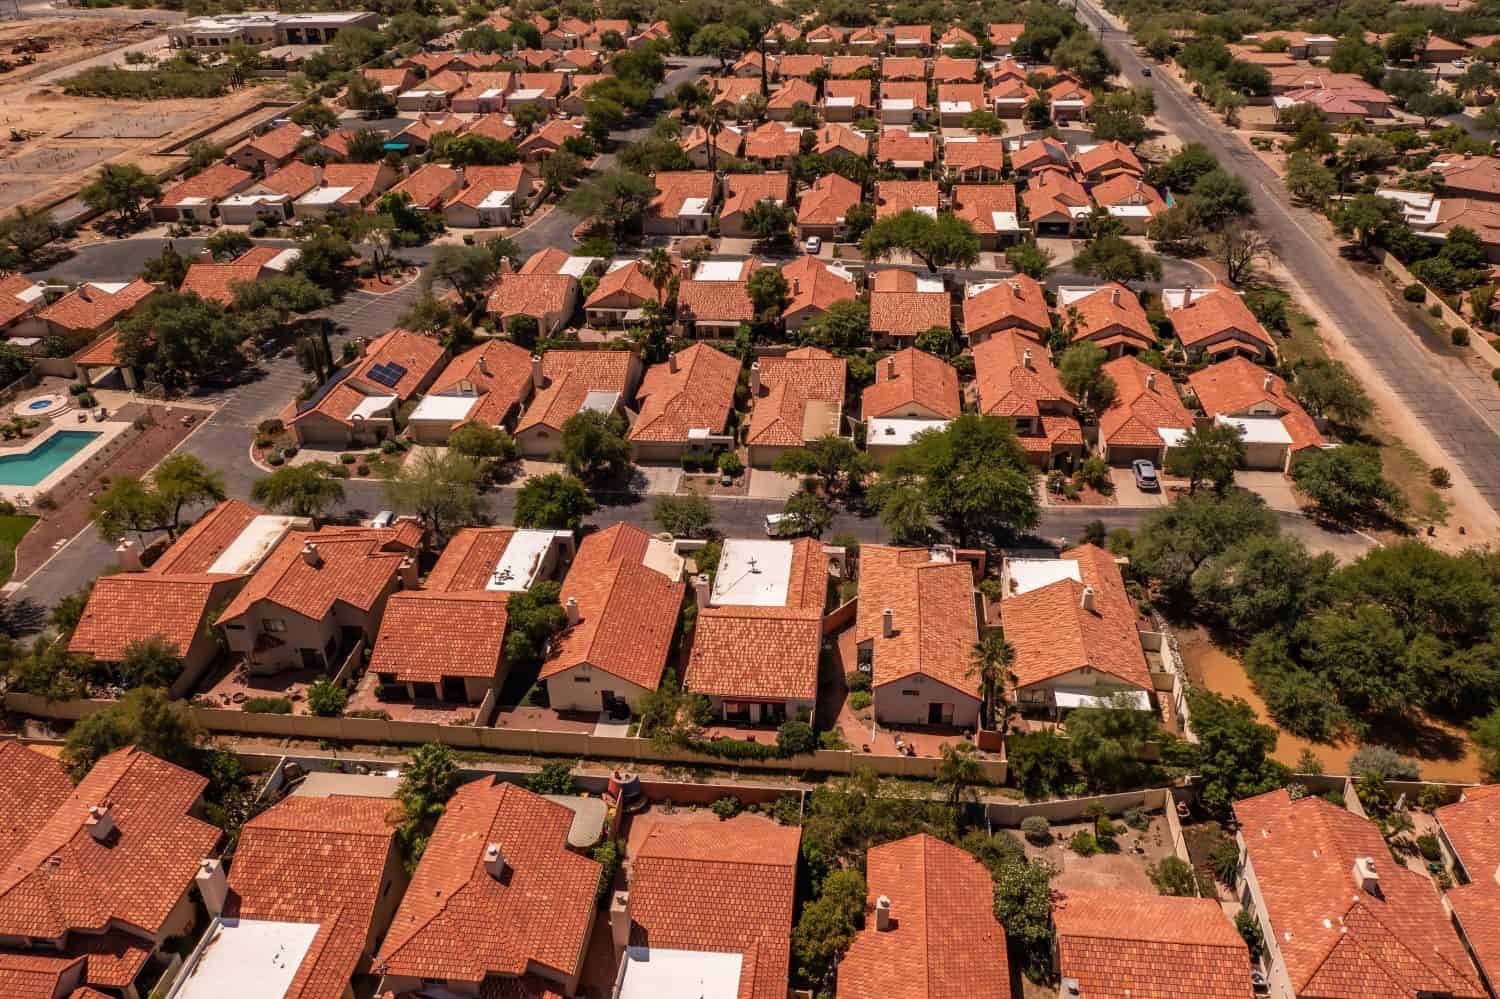
- City boundary area in 2023: 242.5 sq. mi (+15.5 sq. mi since 2010)
- City boundary area in 2010: 227.0 sq. mi
- Population growth, 2010 to 2022: +4.4%
6. Omaha, NE

- City boundary area in 2023: 146.6 sq. mi (+16.0 sq. mi since 2010)
- City boundary area in 2010: 130.6 sq. mi
- Population growth, 2010 to 2022: +20.1%
5. Buckeye, AZ

- City boundary area in 2023: 395.0 sq. mi (+19.6 sq. mi since 2010)
- City boundary area in 2010: 375.4 sq. mi
- Population growth, 2010 to 2022: +116.4%
4. Lubbock, TX
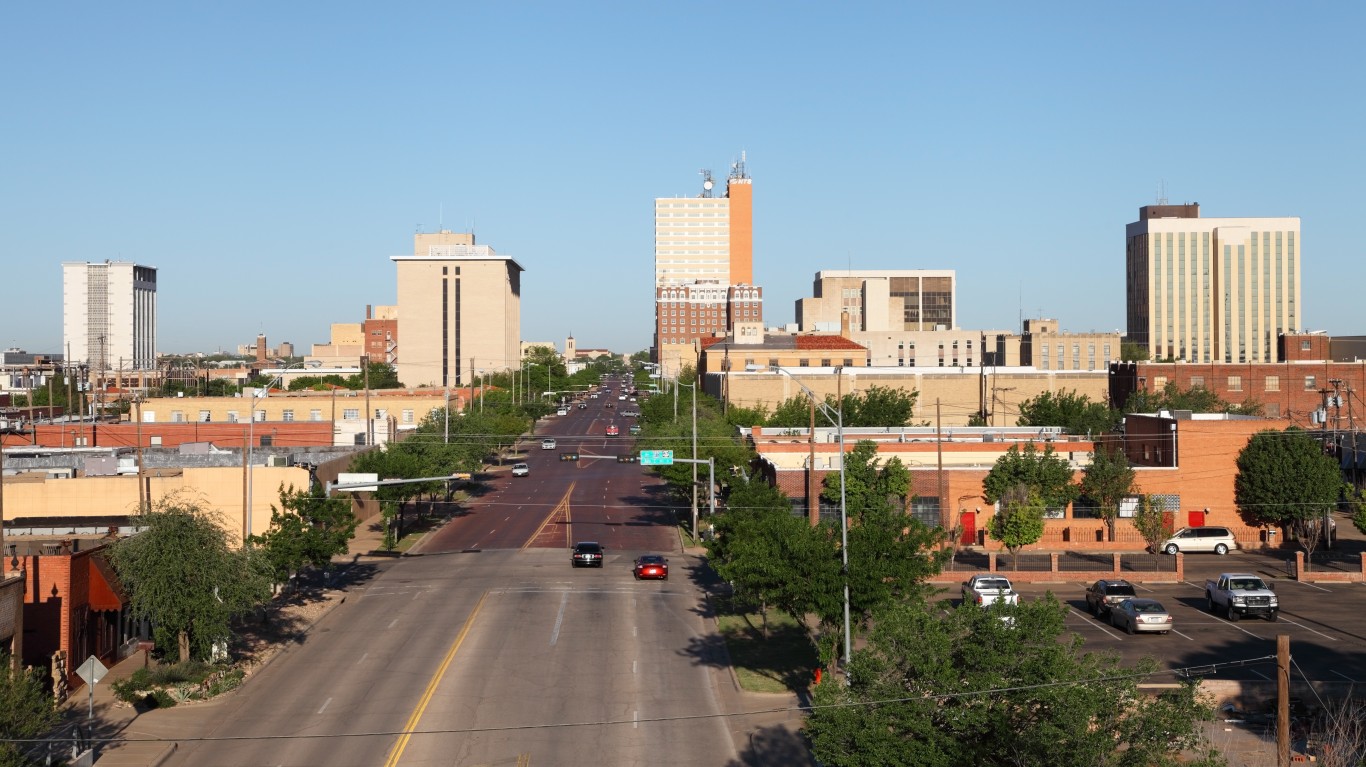
- City boundary area in 2023: 143.3 sq. mi (+19.7 sq. mi since 2010)
- City boundary area in 2010: 123.6 sq. mi
- Population growth, 2010 to 2022: +16.2%
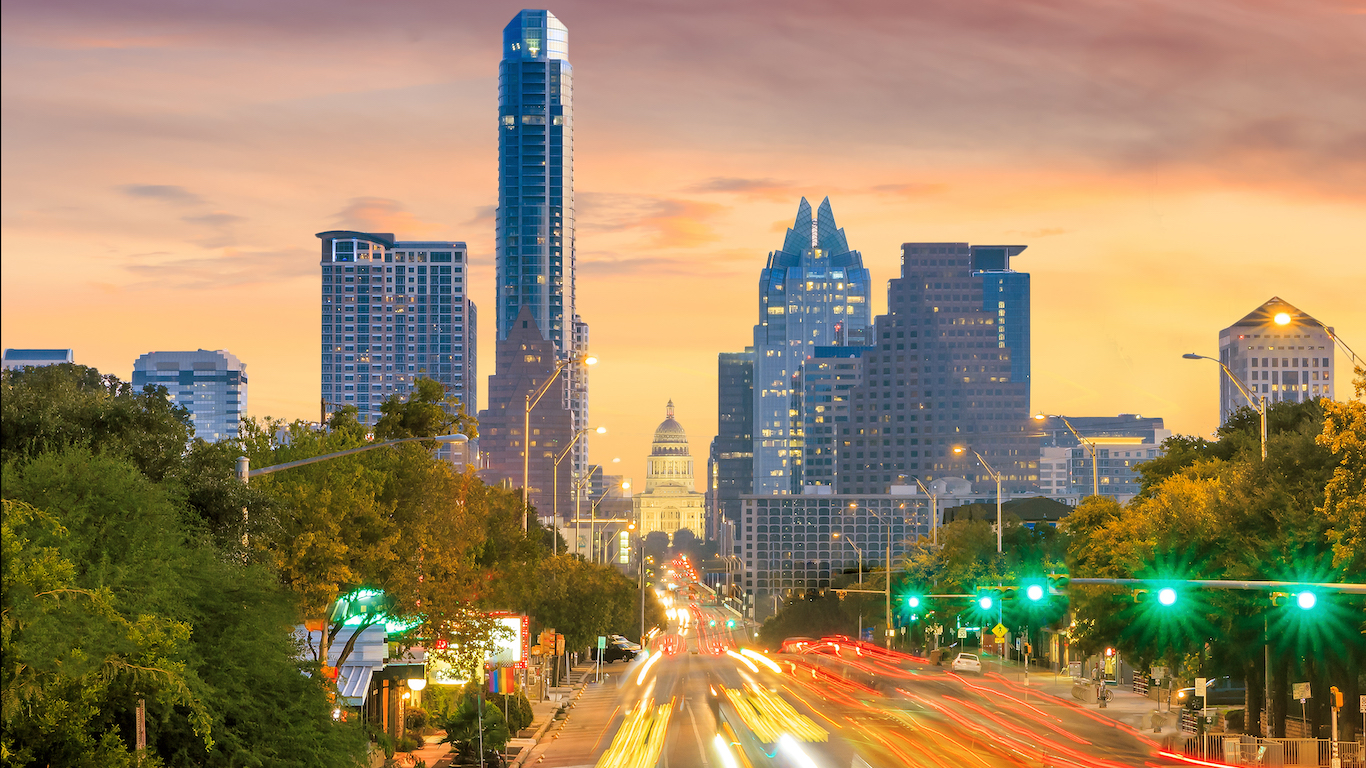
3. Austin, TX
 by Adriano Aurelio Araujo")
- City boundary area in 2023: 332.9 sq. mi (+27.9 sq. mi since 2010)
- City boundary area in 2010: 305.1 sq. mi
- Population growth, 2010 to 2022: +25.4%
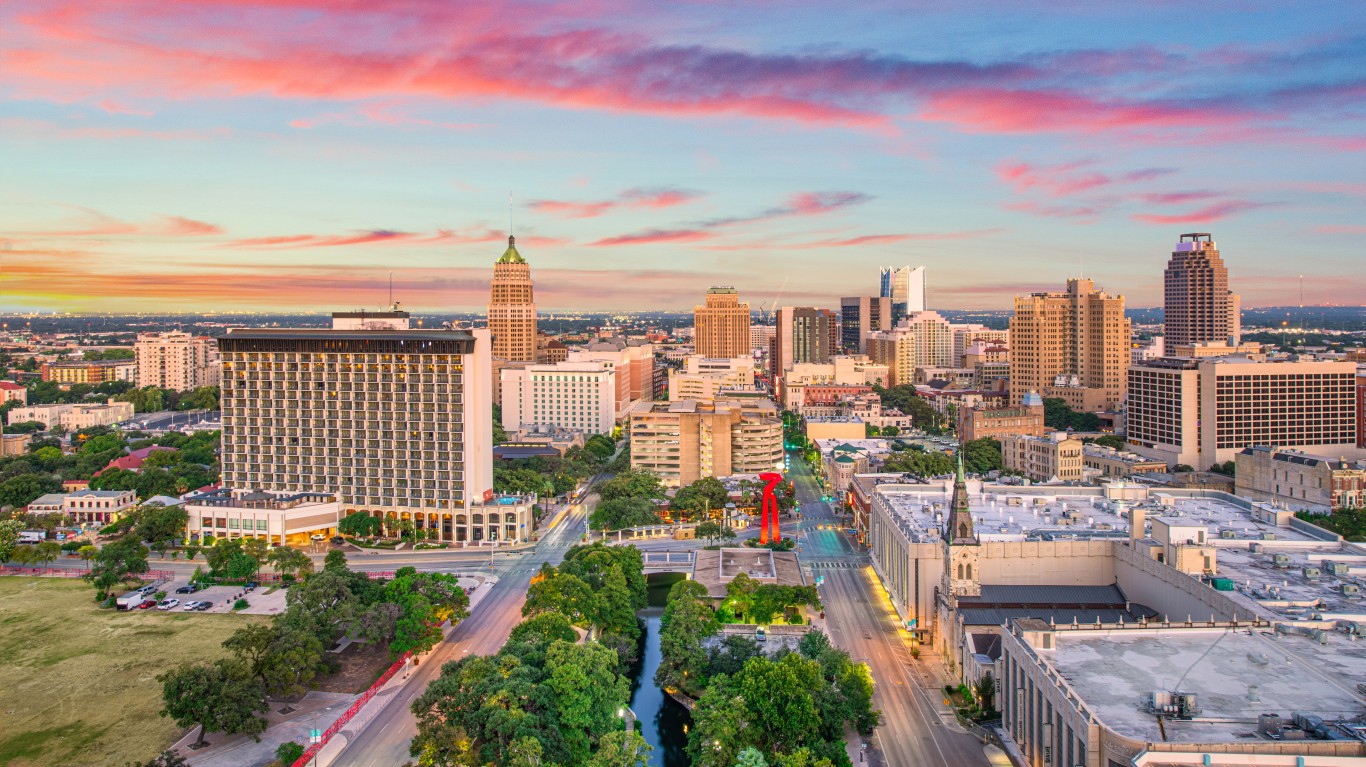
2. San Antonio, TX

- City boundary area in 2023: 504.7 sq. mi (+38.0 sq. mi since 2010)
- City boundary area in 2010: 466.7 sq. mi
- Population growth, 2010 to 2022: +12.0%
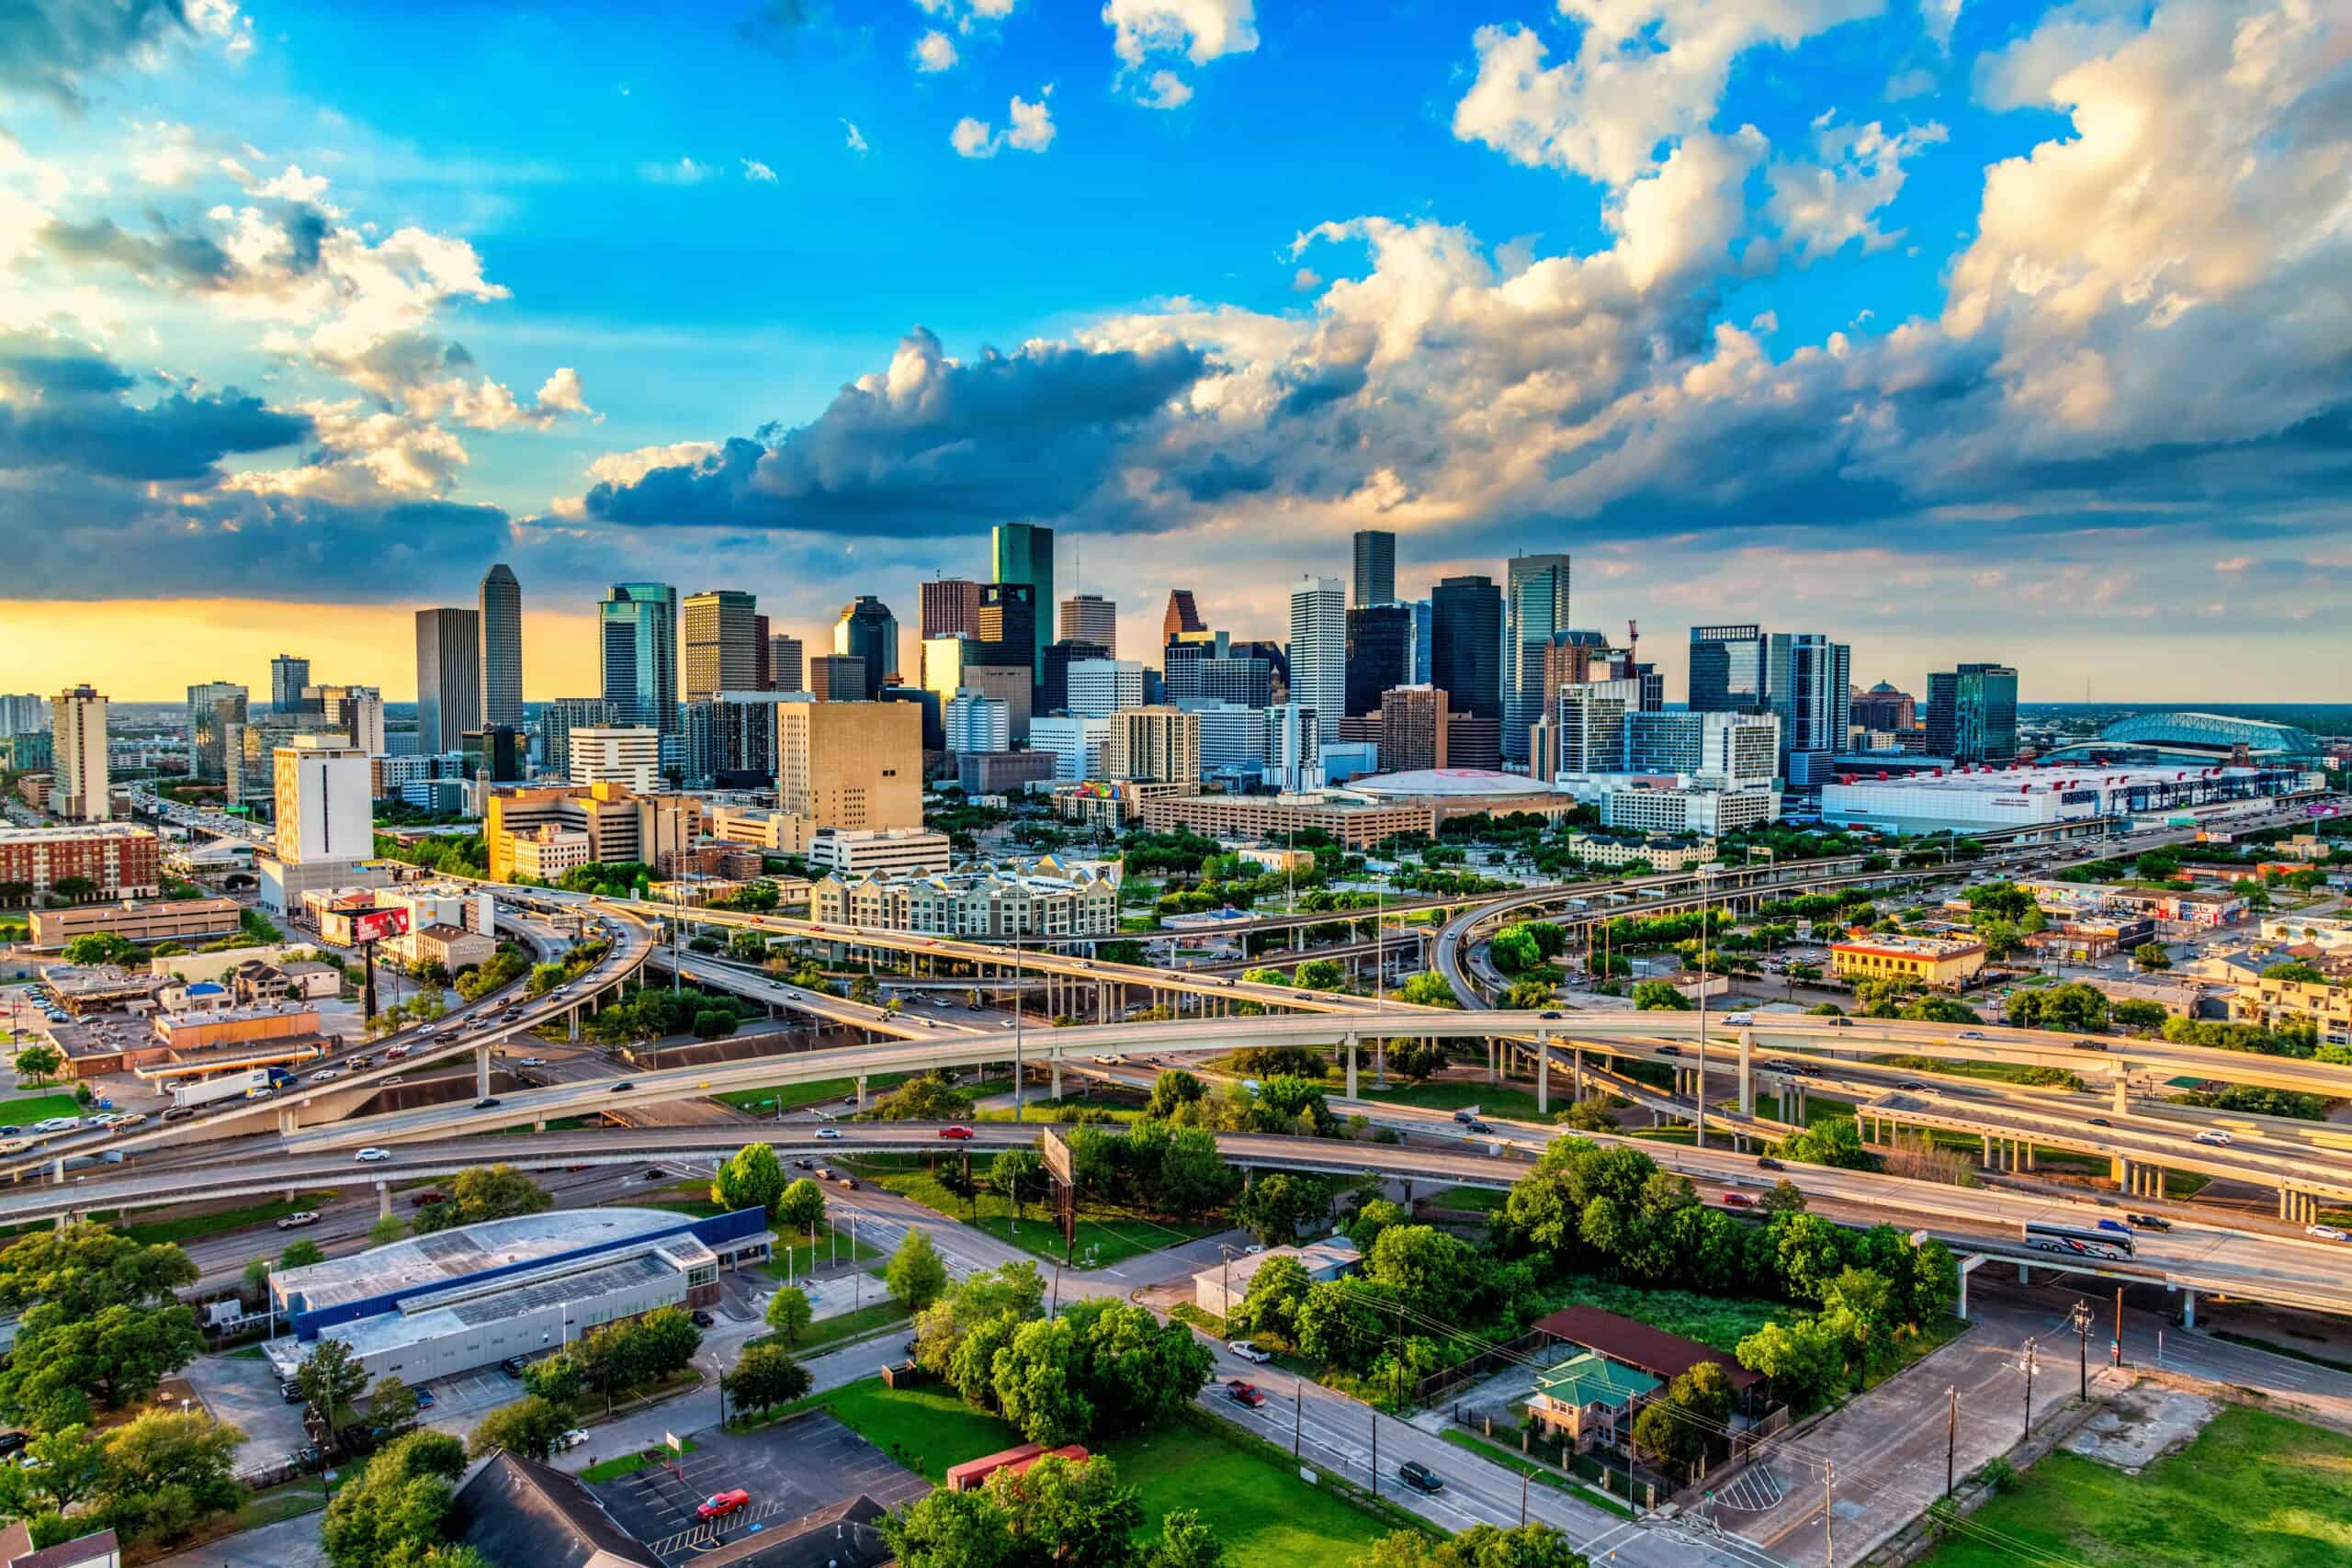
1. Houston, TX
 views")
- City boundary area in 2023: 671.8 sq. mi (+44.3 sq. mi since 2010)
- City boundary area in 2010: 627.5 sq. mi
- Population growth, 2010 to 2022: +11.0%