From World Beta
In 2003, investors in global equities had just experienced 3 brutal years of negative returns. While many were too shell shocked to commit new (or in many cases, any) capital to the stock markets, this was precisely the best time to buy stocks. Baron Phillipe Rothschild once exclaimed that the time to buy was "when there is blood in the streets." I originally included a picture of a puddle of blood in an alley, but it was so morbid I deleted it and now you have a bouncing ball.
Previously, we have discussed momentum systems – but what about the opposite of a momentum system? Below we are going to take a look at some simple mean reversion in asset class returns.
One of the most simple measures of mean reversion is down years, so what happens when the investor only invests in an asset class if it was down X-years ago? Victor Niederhoffer examined this effect in his book "Practical Speculation". We will take the average of all asset classes that were down X-years ago, and if there were not any, park the capital in Commercial Paper. We use the same six asset classes as before since 1973 – US Stocks (S&P 500), Foreign Stocks (MSCI EAFE), Commodities (GSCI), REITs (NAREIT), Cash (90-Day Commercial Paper), and United States Government Bonds (10-Year Treasury Bonds).
The chart below shows that asset classes mean revert if they had negative returns in the 2 & 3 years prior. Negative returns in the prior year presage poor returns in the following year. Volatility was pretty similar for all portfolios.
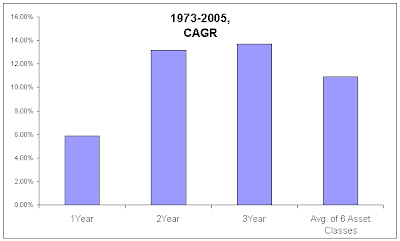
A portfolio that allocated half to the 2-Year strategy and half to the 3-Year strategy would have had only one down year since 1973 (in 2002, a mild -4.35%). It would have a CAGR of 13.81% with volatility of 11.16% for a Sharpe of .92 (You may have to open the Table in another window to look at the results more closely).

An even more interesting observation? What happens to an asset class after after it experienced down years both 2 and 3 years ago? Since 1972, across the six asset classes, that has occurred 24 times. 24 out of 24 times the return has been positive. 100% accuracy. Average return? A whopping 24%.
Lets extend this testing to a much more broad data set. We are going to look at the following asset classes below, with start date in parentheses:
S&P 500 (1900)
NASDAQ Comp (1950)
MSCI EAFE (1970)
MSCI EMI (1988)
10 Year US Govt Bonds (1900)
CRB Index(1917)
GSCI (1970)
NAREIT(1972)
Gold (1972)
DJ Corporate Bonds (1916)
UK Stocks (1900)
Japanese Stocks (1921)
French Stocks (1900)
Swiss Stocks (1967)
German Stocks (1950)
Korean Stocks (1972)
South African Stocks (1961)
Brazilian Stocks (1987)
Indian Stocks (1987)
Australian Stocks (1900)
Italian Stocks (1925)
Spanish Stocks (1941)
Hong Kong Stocks (1970)
All told that is 1300 years of asset class returns. Obviously, that will be biased towards more recent times due to lack of data for the previous half century, and also due to many of the asset classes not being in existence. It is also biased to equity markets. The average return for all of those years was 13% with volatility of 17%. Returns were positive in roughly 70% of the years.
Average returns improved to 15%, 14%, and 18% for asset classes with negative returns 2, 3, and 2 & 3 years ago. Volatility was pretty similar for all observations. Likewise, % positive years also was fairly similar in the 70-80% positive range.
We have discussed how both mean reversion and momentum systems have worked in the past. How about combining the best of each? Theoretically, a momentum system and a mean-reversion system should be negatively correlated. The returns beloware if an investor placed half his capital in a momentum system and half in mean reversion systems. We use the same 6 asset classes as before.
50% in Top3 = Investing in the Top 3 asset classes of the prior year.
25% in 2YearsPrior = Invests in any asset classes that were negative 2 years ago, otherwise parks the capital in commercial paper.
25% in 3YearsPrior = Ditto with 3 years.

Returns averaged about 14% with bond-like volatility. One down year of only -1.25%.
Now, we are certainly guilty of data mining. There has been ample academic evidence of both momentum and mean reversion in asset class returns. The big question is, will investors continue with the same behavioral biases as they have in the past, and at the same time frames? Will momentum at a years time frame continue while mean reversion exists at longer time frames of 2-3 years? That’s the (multi)million dollar question. As long as humans continue to feel the same emotions of fear and greed as they have in the past, I am willing to bet that they do.
Example ETF’s that reflect asset classes discussed in this article are: