If you’re investing in dividend stocks and ETFs, chances are you look at the yield when considering which assets to buy. Funds like the YieldMax NVDA Option Income Strategy ETF (NYSEARCA:NVDY) and Amplify CWP Enhanced Dividend Income ETF (NYSEARCA:DIVO) get a lot of attention for that reason.
Both ETFs have high yields that produce a lot of passive income, but that’s not all there is to stock analysis. Some stocks and ETFs have high yields but woefully underperform the stock market. Taking a closer look at NVDY and DIVO reveals a clear winner for investors who want high cash flow and long-term returns.
The Portfolios

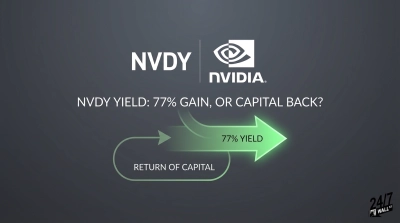
NVDY is pretty straightforward. This fund invests in Nvidia (NASDAQ:NVDA | NVDA Price Prediction) and uses covered calls to generate cash flow. NVDY will miss out on upside if Nvidia stock soars, but if Nvidia remains flat, NVDY investors get to pocket some nice premiums while Nvidia stockholders wait for the stock to budge. If a covered call is exercised, the fund buys more Nvidia stock and repeats the process of selling covered calls all over again.
DIVO is a bit more complex, as it uses some covered calls to boost its yield, but the fund is still a dividend ETF with plenty of stocks. It holds 24 stocks and places a heavy emphasis on the financial services sector, which makes up more than one-quarter of its assets. The fund’s top three holdings — IBM (NYSE:IBM), Meta Platforms (NASDAQ:META), and Goldman Sachs (NYSE:GS) — make up more than 15% of its total assets. All three of those stocks have outperformed the S&P 500 over the past year.
The Yields

Both funds are quite expensive due to their active management styles. DIVO has a 0.56% expense ratio, while NVDY has a 0.99% expense ratio. DIVO has a trailing 12-month yield of 4.76%, while NVDY has a trailing 12-month yield of 112.61%. However, NVDY’s trailing yield isn’t the best indicator since its stock price has dropped considerably, and losses reduce how much cash flow NVDY can generate from future options trades.
NVDY has distributed $5.7517 per share to investors from January to June. Here’s a breakdown of the monthly payments:
- January 31: $0.8294
- February 28: $1.1618
- March 28: $0.7874
- April 25: $0.6734
- May 23: $1.6276
- June 23: $0.6721
If we double the dividend to stretch it out to a year, we end up with $11.5034 per share. Since NVDY trades at roughly $16.55 per share, that would translate into a 69.5% yield. The yield changes a lot, but it remains pretty high.
The Returns
NVDY has a short history, so we cannot compile data based on 5-year and 10-year annualized returns. However, this fund is up by 15.2% over the past year. Meanwhile, DIVO has a 13.0% return over the same stretch.
DIVO also has an annualized 13.7% return over the past five years, which demonstrates more consistency than NVDY. DIVO also has its funds spread across more assets, which minimizes risk.
The Verdict

NVDY edges out DIVO if we look at the returns over the past year, but those returns don’t tell the entire story. Most of DIVO’s returns are tied to capital gains, and some of its cash flow comes from dividends, while the remaining cash flow comes from options trading.
NVDY generates all of its cash flow from options trading, and it’s those same trades that allowed NVDY to produce a good return over the past year. This creates a taxing nightmare since all of the options premiums are treated as ordinary income. You will have a higher tax bill with NVDY than DIVO, which will impact your total returns.
DIVO seems like the better investment for people who want tax-advantaged cash flow with some options trading. NVDY looks attractive due to its high yield and attachment to Nvidia stock, but it’s better to just buy Nvidia stock instead of NVDY.