Toll Brothers Posts Sixth Straight Earnings Beat but Stock Drops on Tepid Growth

Photo of William Temple
By William Temple Published

Quick Read

  • Toll Brothers beat Q4 EPS estimates by 5.8% but revenue fell 2.2% year over year to $3.26B.

  • Shares dropped 4.3% after the report despite the beat. Strong results were already priced in near 52-week highs.

  • Operating margin reached 17.4%. Earnings strength came from cost discipline rather than demand growth.

This post may contain links from our sponsors and affiliates, and Flywheel Publishing may receive compensation for actions taken through them.
Toll Brothers Posts Sixth Straight Earnings Beat but Stock Drops on Tepid Growth

© 24/7 Wall St.

Yesterday we were watching whether Toll Brothers could deliver another earnings beat amid a challenging housing market. The luxury homebuilder reported fourth-quarter results before Monday’s open, posting EPS of $4.63 versus the $4.38 consensus estimate. This morning, shares opened in the pre-market down approximately 4.3% to $130.38, suggesting investors found something to dislike despite the headline beat.

Beat on Bottom Line, Tepid on Revenue

The $0.25 per share earnings beat represented a 5.8% surprise, marking the sixth consecutive quarter Toll Brothers has exceeded analyst expectations. However, revenue of $3.26 billion came in just 1.8% above the $3.20 billion estimate. More concerning for investors: that revenue figure declined 2.2% year over year from the prior fourth quarter’s $3.33 billion.

An infographic titled 'Day After Earnings: TOL' dated Tuesday, December 9, 2025. It is divided into three main sections. Section 1, 'Key Earnings Results,' presents Q4 EPS actual at $4.63 (consensus $4.38, a +5.8% surprise) and Q4 Revenue actual at $3.26 billion (consensus $3.20 billion, a +1.8% surprise, but a -2.2% YoY decline). It summarizes the performance as 'Beat on Bottom Line, Tepid on Revenue' driven by cost management, with an operating margin of 17.4%. Section 2, 'Market Reaction & Context,' shows opening trading down -4.3% to $130.38, indicating investor disappointment despite the beat. A line chart illustrates the stock breaking below its 50-Day MA ($135.01), with the 200-Day MA at $120.27. Section 3, 'Analyst Sentiment & Outlook,' displays a 'Moderately Bullish' sentiment gauge (10 Buy/Strong Buy vs. 6 Hold/Sell) and an average price target of $152.40, implying 16.9% upside. It also lists 'Future Focus' areas and a Forward P/E Ratio of 10.08, indicating 'Reasonable Valuation'.
24/7 Wall St.
Despite beating Q4 EPS and revenue expectations, Toll Brothers (TOL) shares opened down -4.3%, reflecting investor disappointment. Analysts, however, remain moderately bullish with a significant upside potential on the average price target.

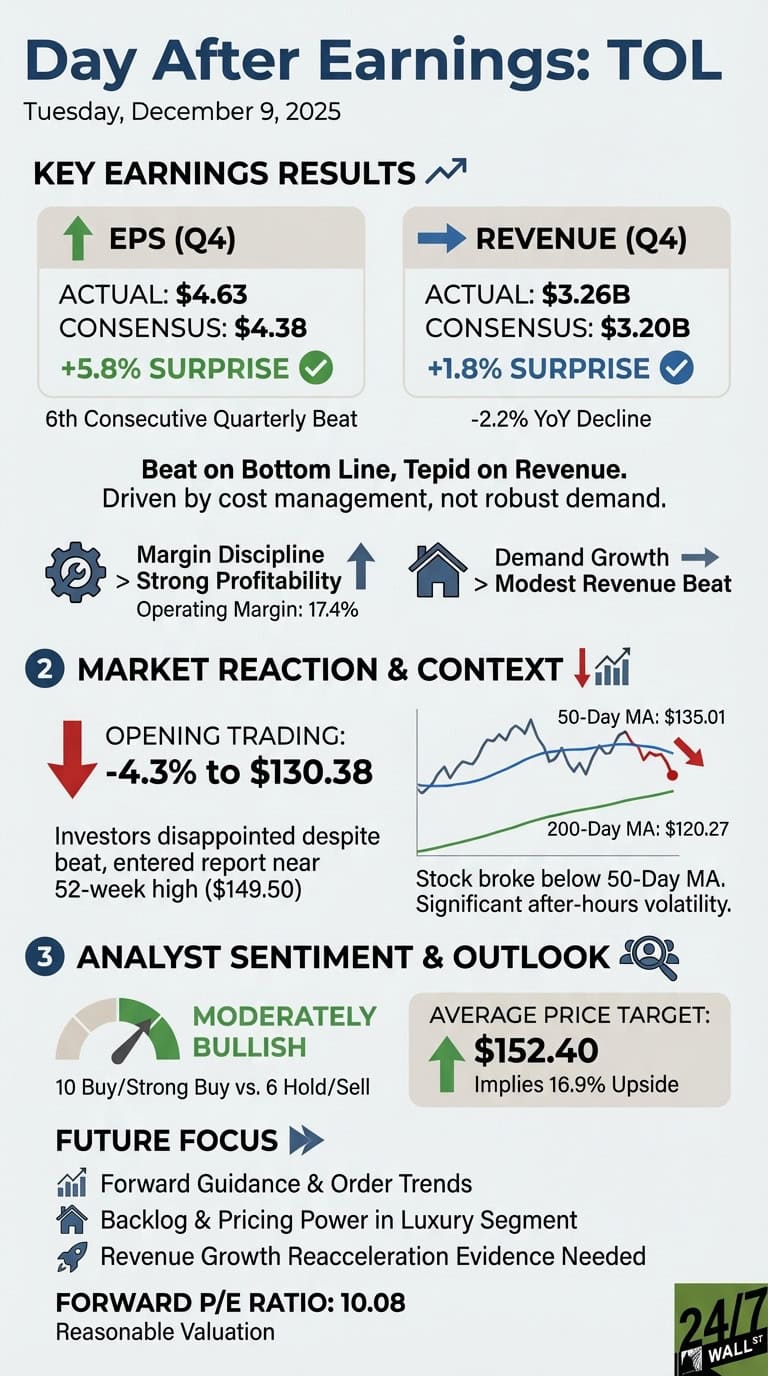
This pattern suggests the earnings outperformance came more from cost management and margin discipline than from robust demand growth. The company maintained strong profitability metrics, with operating margins at 17.4% on a trailing basis, but the modest revenue beat against elevated expectations appears to have disappointed the market.

Context matters here. Toll Brothers entered the report trading near its 52-week high of $149.50, meaning strong results were already priced in. The stock needed more than a modest beat to justify its premium valuation.

Market Reaction Reflects Growth Concerns

Pre-market trading volume remained light, with shares drifting lower in early activity. The stock broke below its 50-day moving average of $135.01, though it still holds above the 200-day moving average of $120.27. After-hours trading Monday evening showed significant volatility, with a spike to 212,990 shares at 7:00 PM and wide price swings between $129.22 and $136.47.

Despite the negative reaction, analyst sentiment remains moderately bullish. Ten analysts maintain Buy or Strong Buy ratings versus six Hold or Sell ratings, with an average price target of $152.40. That implies 16.9% upside from current pre-market levels, suggesting the sell-side views this pullback as temporary.

Focus Shifts to Guidance and Demand Trends

The key question now centers on forward guidance and order trends, neither of which appear in the preliminary data. With a forward P/E ratio of just 10.08, the stock trades at a reasonable multiple for a profitable homebuilder. However, investors need evidence that revenue growth can reaccelerate to justify even that modest valuation.

We’ll be watching how the stock trades through the morning session and whether management commentary on the earnings call provides clarity on backlog trends and pricing power in the luxury segment. Any analyst target adjustments should emerge within 24 to 48 hours.

Photo of William Temple
About the Author William Temple →

I write to invest, and I invest to spend more time with nature. Usually all at the same time. I'm a retired equities guy who saw a recession or four, and lives for what comes out of the other side of them.

I cover stocks across the board cause even though I feel like I've seen it all, there's always another way out there to make, and lose money. I want to help you do more of the former, and none of the latter. Making money with friends is my oxygen.

Let's go!

Featured Reads

Our top personal finance-related articles today. Your wallet will thank you later.

Continue Reading

Top Gaining Stocks

CBOE Vol: 1,568,143
PSKY Vol: 12,285,993
STX Vol: 7,378,346
ORCL Vol: 26,317,675
DDOG Vol: 6,247,779

Top Losing Stocks

LKQ
LKQ Vol: 4,367,433
CLX Vol: 13,260,523
SYK Vol: 4,519,455
MHK Vol: 1,859,865
AMGN Vol: 3,818,618