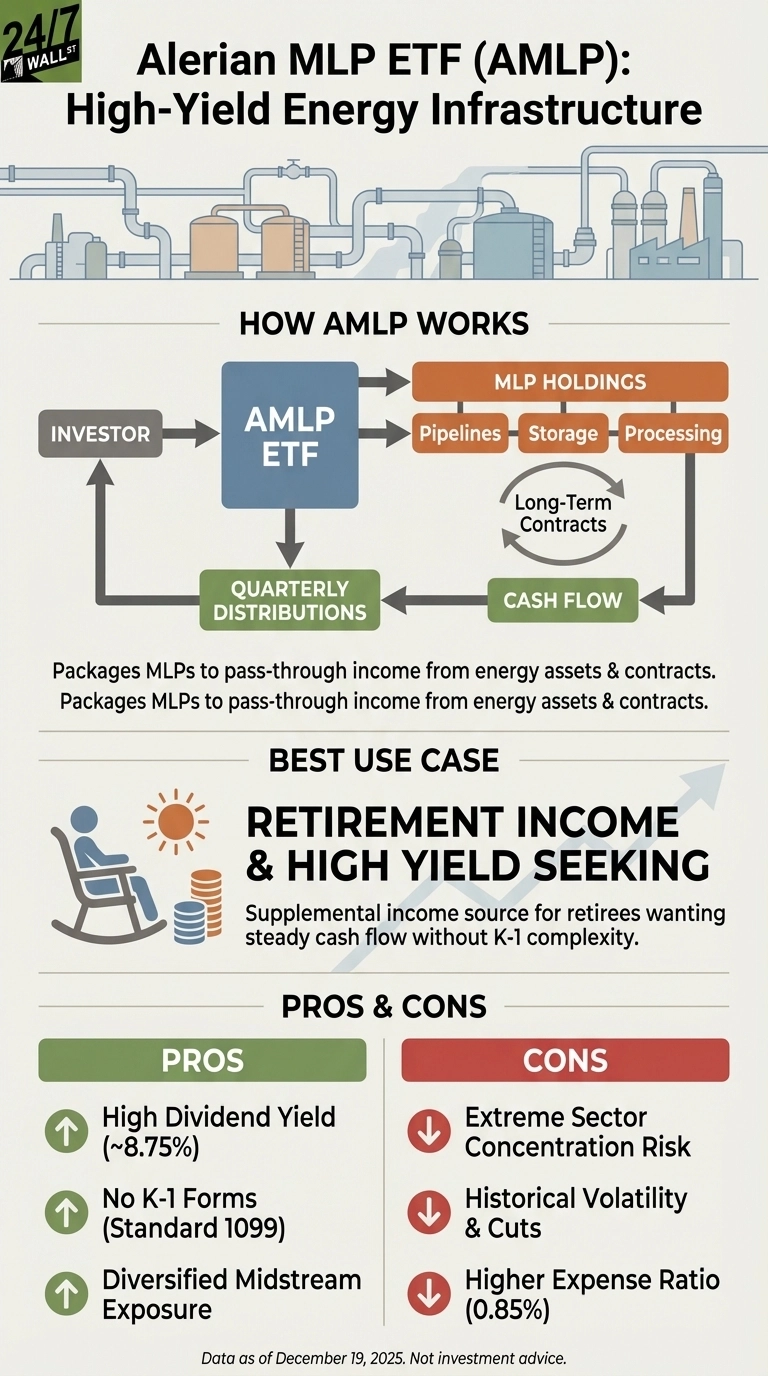
The Alerian MLP ETF (NYSEARCA:AMLP | AMLP Price Prediction) offers retirees an 8.75% dividend yield by investing in master limited partnerships that own energy infrastructure assets like pipelines, storage facilities, and processing plants. These MLPs generate cash flow from long-term contracts to transport oil, natural gas, and refined products, then pass distributions to unitholders. AMLP packages these partnerships into a single ETF, providing diversified midstream energy exposure without the tax complexity of owning MLPs directly.
How AMLP Generates Its High Yield
AMLP’s income derives from quarterly distributions paid by its underlying MLP holdings. The ETF holds $10.6 billion in assets concentrated in energy infrastructure, with 102.5% sector allocation to energy. The top six holdings represent 76.5% of the portfolio, led by MPLX (NYSE:MPLX) at 13.74%, Plains All American Pipeline (NASDAQ:PAA) at 12.85%, and Western Midstream Partners (NYSE:WES) at 12.82%.
Distribution Sustainability Analysis
AMLP has demonstrated strong distribution growth over five years. The largest holding, MPLX, generated $5.946 billion in operating cash flow in 2024 while paying $3.603 billion in distributions, maintaining a healthy 1.4x coverage ratio after capital expenditures. This means the company produced 36% more free cash flow than it distributed.
MPLX’s 41.4% profit margin and 7.24% dividend yield demonstrate robust fundamentals. Enterprise Products Partners (NYSE:EPD), the second-largest holding at 12.77%, maintains a $69.3 billion market capitalization with a 6.75% yield, though recent quarterly revenue declined 12.7% year-over-year. Energy Transfer (NYSE:ET) at 11.90% offers the highest yield at 8.02% but shows the thinnest profit margin at 5.74%, raising coverage concerns.
Key Risks for Retirement Income
AMLP’s extreme concentration in energy infrastructure creates significant sector-specific risk. The ETF suffered a severe distribution cut during the 2020 pandemic, dropping from $0.19 to $0.15 per quarter. While distributions have recovered and grown consistently since, this history demonstrates vulnerability during energy market disruptions. AMLP has gained 5.58% year-to-date in 2025, underperforming the S&P 500’s 15.84% return. Over five years, however, price appreciation of 158.78% combined with distributions delivered strong total returns exceeding 180%.
Tax complexity presents another consideration. While AMLP issues a standard 1099 form instead of K-1 tax documents required for direct MLP ownership, the 0.85% expense ratio reflects the cost of this convenience.
Alternative to Consider
Retirees seeking similar high-yield energy exposure might explore the InfraCap MLP ETF (NYSEARCA:AMZA). AMZA uses leverage to amplify returns from midstream MLPs, targeting even higher yields while avoiding K-1 tax forms. The fund employs a more concentrated strategy than AMLP, which may suit investors comfortable with additional risk for enhanced income. AMZA currently yields approximately 15%, though this comes with greater volatility and the inherent risks of leveraged investing.
AMLP’s 8.75% yield appears sustainable based on strong cash flow coverage from its largest holdings and five consecutive years of distribution growth. However, retirees should view this as a supplemental income source within a diversified portfolio rather than a core holding, given the concentration risk and historical volatility.