If You Think Apple Trading For 36x Earnings Is Nuts, You Can Bet Against Them With AAPD ETF

Photo of Austin Smith
By Austin Smith Published

Quick Read

  • Apple trades at 36x earnings but underperformed the S&P 500 by over 2 percentage points in the past year.

  • AAPD offers -1x daily inverse exposure to Apple with a 0.01% expense ratio and $18.9M in assets.

  • Daily rebalancing causes AAPD returns to deviate from simple inverse performance over periods longer than one day.

This post may contain links from our sponsors and affiliates, and Flywheel Publishing may receive compensation for actions taken through them.
If You Think Apple Trading For 36x Earnings Is Nuts, You Can Bet Against Them With AAPD ETF

© 24/7 Wall St.

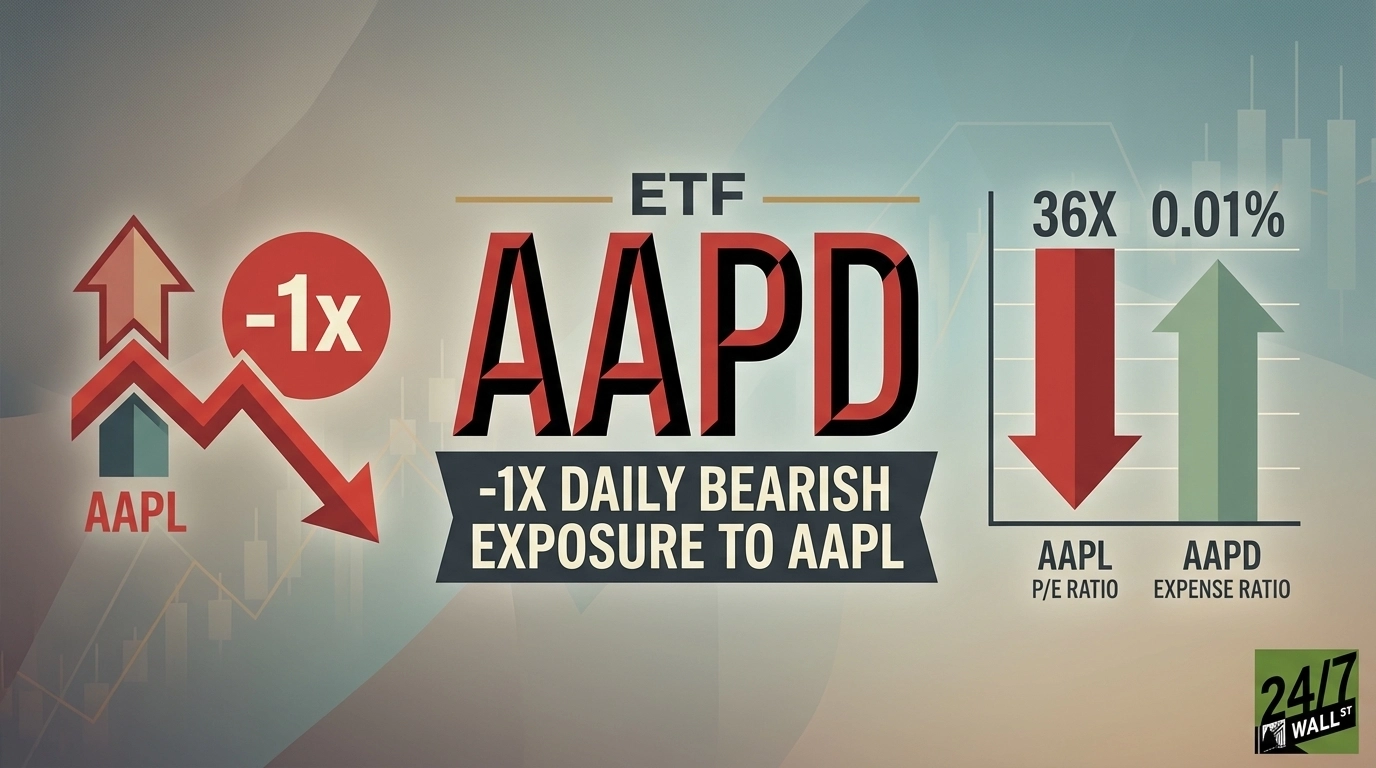
Apple (NASDAQ:AAPL | AAPL Price Prediction) trades at 36x earnings while delivering just 10% returns over the past year. If you’re skeptical that the 4t tech giant can continue this performance into 2026, the Direxion Daily AAPL Bear 1X Shares (NASDAQ:AAPD) is an inverse ETF that provides -1x daily exposure to Apple’s price movements. 

But there are some things to consider first. 

Apple’s Current Valuation Metrics

Apple’s valuation metrics show a forward P/E of 33x and a trailing P/E of 36x, these are premium multiples for a company that hasn’t had a blockbuster product in years. The company’s most recent fiscal year showed earnings growth following two years of near-stagnation. 

Retail sentiment data from Reddit supports this ‘richly valued’ view, and our data shows bearish sentiment scores in the 32-38 range on r/wallstreetbets while r/stocks hovers around neutral. 

How AAPD Works

AAPD provides -1x daily inverse exposure to Apple’s stock price through derivatives. The ETF carries a 0.01% expense ratio and holds $18.9 million in assets under management.

An infographic titled 'AAPD ETF: Direxion Daily AAPL Bear 1X Shares' with the subtitle 'Inverse Exposure to Apple, Inc.'. The infographic is divided into three main sections: 'HOW THE ETF WORKS', 'MOST SUITABLE USE CASE', and 'PROS AND CONS'. The 'HOW THE ETF WORKS' section shows an apple representing 'AAPL Stock Price' with a downward arrow, leading to an 'ETF' document icon representing 'AAPD ETF (Daily Inverse Exposure)', which then leads to a large red downward arrow representing 'AAPD PERFORMANCE (Opposite of AAPL)'. Text notes an 'Inverse Relationship (-1x)'. An important note states 'Performance deviates over time due to daily compounding'. The 'MOST SUITABLE USE CASE' section is split into 'SHORT-TERM TACTICAL TRADE' (blue background with a clock and calendar icon, listing 'Daily Hedging' and 'Short-Term Bearish View') and 'BEARISH INVESTOR SENTIMENT' (red background with a person looking at a downward arrow, listing 'Belief in AAPL Overvaluation' and 'Bet Against AAPL Premium'). A callout box suggests 'Best for short holding periods, not long-term investing'. The 'PROS AND CONS' section is split into 'PROS' (green background) and 'CONS' (red background). Pros include 'Profit from AAPL Decline', 'Portfolio Hedging Tool', and 'Unleveraged (-1x Exposure)' with corresponding icons. Cons include 'Daily Compounding Decay', 'Low Liquidity ($18.9M AUM)', and 'Expense Ratio (0.01%)' with corresponding icons. A footer advises 'Consider risks, especially long-term compounding effects. Consult Direxion's daily fact sheet.' The overall color scheme is light brown, blue, red, and green.
24/7 Wall St.
This infographic illustrates how the AAPD ETF provides inverse daily exposure to Apple stock, detailing its mechanics, suitable use cases for short-term bearish strategies, and a breakdown of its pros and cons for investors.

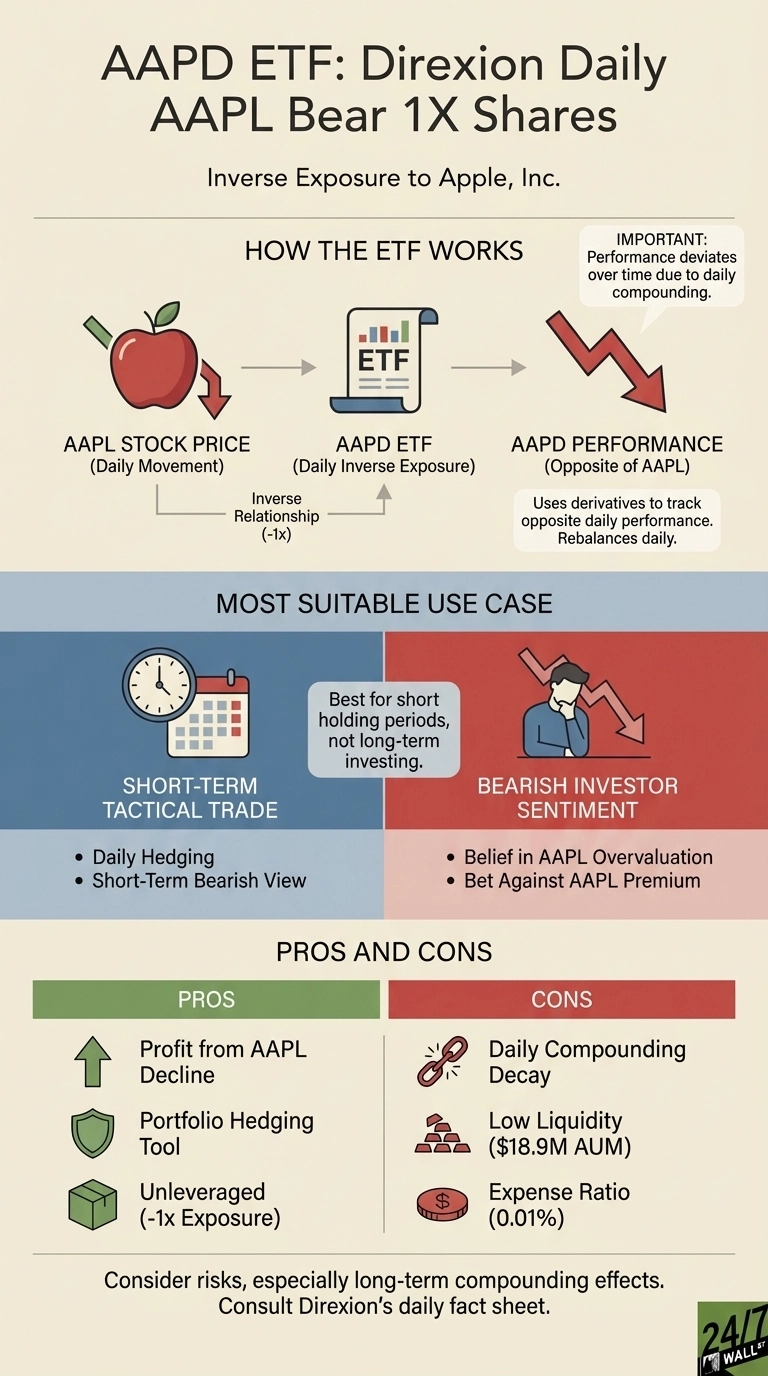
The ETF resets its exposure each day through daily rebalancing. Returns over periods longer than one day will deviate from a simple inverse of Apple’s performance due to compounding effects. Direxion’s daily fact sheet provides updated performance data showing how compounding affects returns.

The ETF’s asset base of $18.9 million affects liquidity characteristics. Daily volume and bid-ask spreads widen during Apple’s earnings announcements when volatility increases.

Note that while this can help you profit if Apple shares decline, it is not the type of ETF to own for long periods and perhaps confusingly will not create the inverse returns of Apple’s shares in the long run due to daily rebalancing. 

But if you believe Apple’s best days are behind it and that shares will under-perform in 2026, it’s worth looking at. 

Comparison to TSLQ

The Tradr 2X Short TSLA Daily ETF (NASDAQ:TSLQ) offers -2x leveraged inverse exposure to Tesla (NASDAQ:TSLA). TSLQ holds $315 million in assets under management, providing deeper liquidity than AAPD. TSLQ carries a 1.17% expense ratio and doubled leverage, which amplifies both gains and losses while accelerating compounding effects.

The products differ in leverage structure, liquidity profile, and cost. AAPD provides unleveraged -1x inverse exposure while TSLQ provides -2x leveraged inverse exposure.

Interest rates and equity risk premiums represent macro factors affecting inverse ETF performance, while Apple’s Services growth and iPhone pricing represent company-specific factors affecting AAPD’s underlying exposure.

Photo of Austin Smith
About the Author Austin Smith →

Austin Smith is a financial publisher with over two decades of experience in the markets. He spent over a decade at The Motley Fool as a senior editor for Fool.com, portfolio advisor for Millionacres, and launched new brands in the personal finance and real estate investing space.

His work has been featured on Fool.com, NPR, CNBC, USA Today, Yahoo Finance, MSN, AOL, Marketwatch, and many other publications. Today he writes for 24/7 Wall St and covers equities, REITs, and ETFs for readers. He is as an advisor to private companies, and co-hosts The AI Investor Podcast.

When not looking for investment opportunities, he can be found skiing, running, or playing soccer with his children. Learn more about me here.

Featured Reads

Our top personal finance-related articles today. Your wallet will thank you later.

Continue Reading

Top Gaining Stocks

CBOE Vol: 1,568,143
PSKY Vol: 12,285,993
STX Vol: 7,378,346
ORCL Vol: 26,317,675
DDOG Vol: 6,247,779

Top Losing Stocks

LKQ
LKQ Vol: 4,367,433
CLX Vol: 13,260,523
SYK Vol: 4,519,455
MHK Vol: 1,859,865
AMGN Vol: 3,818,618