Applied Digital Corp (Nasdaq: APLD) reports its fiscal third-quarter 2026 results on April 8 after the market close. With the stock down 30.5% since the Q2 earnings report and a $2.15 billion debt deal fresh on the books, this print needs to deliver more than a beat.
From Blowout Quarter to a Bruising March
Last quarter was legitimately impressive. Revenue hit $126.59 million against an $81.21 million consensus estimate, a 55.88% beat, and grew 98.2% year over year. The EPS loss of $0.11 came in well ahead of the $0.2067 loss estimate, a 46.78% positive surprise. The stock surged 17.97% in the day following that report.
Since then, the narrative has gotten complicated. Nvidia’s (NASDAQ:NVDA | NVDA Price Prediction) complete exit of its $177 million stake in February 2026 triggered a single-day decline of 114%, and the stock has shed 24.66% over the past month, closing at $20.55 on March 30. In March, Applied Digital also priced $2.15 billion in 6.750% senior secured notes due 2031 through subsidiary APLD ComputeCo 2 LLC, earmarked to finance 200 megawatts of critical IT load at Polaris Forge 2. That move signals ambition. It also adds weight to a balance sheet already carrying approximately $2.6 billion in debt against $2.3 billion in cash.
Consensus Estimates
Formal Wall Street consensus estimates for Q3 FY2026 are not yet available in standard data feeds. The table below reflects the two most recent reported quarters for context on trajectory.
| Period | EPS (Reported) | EPS (Estimated) | Revenue (Reported) | Revenue (Estimated) | EPS Surprise | Revenue Surprise |
|---|---|---|---|---|---|---|
| Q2 FY2026 | – $0.11 | -$0.2067 | $126.59M | $81.21M | +46.78% | +55.88% |
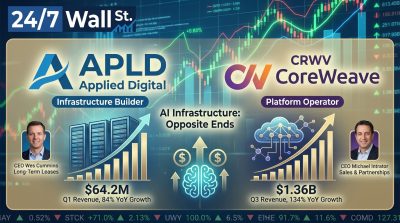
| Q1 FY2026 | -$0.11 | -$0.155 | $64.22M | $45.46M | +29.03% | +41.24% |
Lease Revenue, Debt Costs, and the CoreWeave Question
The biggest shift heading into Q3 is the revenue mix. Last quarter’s HPC Hosting number was inflated by a $73 million one-time tenant fit-out payment from CoreWeave (NASDAQ:CRWV), with only $12 million coming from recurring lease revenue. Q3 should show what the steady-state lease ramp actually looks like now that the first 100 MW at Polaris Forge 1 achieved Ready-for-Service status. That shift from construction-phase revenue to contracted lease income is the core of the long-term bull case, and the numbers need to confirm it is happening on schedule.
SG&A also warrants close attention. Last quarter it surged 119% year over year, driven by $23.8 million in accelerated stock vesting. That was flagged as a one-time item. If SG&A normalizes in Q3, it would meaningfully improve the operating loss picture beyond just the top line.
Beyond the income statement, two strategic items stand out. First, the ChronoScale combination with Ekso Bionics, expected to close in Q2 2026, separates the cloud business from core AI infrastructure. Management needs to give a clear update on timing and any regulatory friction. Second, any commentary on the advanced negotiations with a third investment-grade hyperscaler across multiple regions, including the Dakotas and southern U.S. markets, would be a meaningful catalyst. CEO Wes Cummins said last quarter: “We are well positioned to begin construction in the near term on these new sites.” Investors will want to know if that language has converted into a signed contract.
Retail sentiment remains speculative. One WallStreetBets post this week captured the mood bluntly: “They have guaranteed 15 billion within the next 15 years and their market cap is currently half of that.” That framing is rough but not entirely wrong on the math. The question is execution speed and debt service cost between now and then.
This Quarter Could Reset the Narrative
Applied Digital has beaten EPS expectations in all four of its most recent reports. But with 12 Wall Street analysts maintaining Buy ratings and an average price target of $37.00 against a stock sitting at $20.55, the credibility gap between the contracted revenue story and the current share price is wide. April 8 is the moment to start closing it.