The S&P 500 has long been an accepted benchmark of US industrial health status, and has been a consistent winner, delivering annual gains to investors for decades. The Vanguard S&P 500 ETF (NYSE: VOO | VOO Price Prediction) is the most popular ETF that tracks the S&P 500, and at $1.4 trillion in AUM, it is the market’s #1 largest ETF. However, it is lagging behind its mirror opposite ETF at this time. The Vanguard FTSE Europe ETF (NYSE: VGK) is designed to track the FTSE Developed Europe All Cap Index, and covers stocks throughout Europe and Scandinavia. On a year-to-date comparison, VOO is presently delivering a dismal -3.05% at the time of this writing, while VGK is at least in the black, doing considerably better by comparison at +0.69%.
Vanguard FTSE Europe ETF

VGK is comprised of stocks from companies in Western Europe, UK, and Scandinavia.
Issued by Vanguard, the second largest asset manager in the world after BlackRock, the Vanguard FTSE Europe ETF tracks the FTSE Developed Europe All Cap Index, which covers stocks from the Eurozone and Scandinavia. VGK is a passively managed ETF with an inception date of 3-4-2005. After climbing nearly 10% since the start of 2026, and seeing several billion more in inflows, March 2026 has erased nearly all of those gains, yet it still has managed to stay in the black, which can’t be said for VOO. VGK has a Morningstar gold medalist rating.
|
Net Assets |
$37.35 billion |
Avg. Daily Volume |
4.2million shares |
|
Yield |
3.01% |
YTD Return |
0.69% |
|
52 Wk. Range |
$62.02-$90.75 |
1-Year return |
36.83% |
|
Beta |
0.99 |
3-Year return |
14.29% |
|
Expense Ratio |
0.06% |
5-Year Return |
9.04% |
|
P/E Ratio |
18.29 |
10-Year Return |
8.88% |
The top 10 holdings of VGK are:
- ASML Holding – 3.54%
- Roche Holding AG – 2.07%
- Novartis AG – 2.00%
- HSBC Holdings – 1.99%
- AstraZeneca PLC – 1.95%
- Nestle SA – 1.71%
- Shell PLC – 1.50%
- Siemens – 1.31%
- SAP SE – 1.28%
- Banco Santander SA – 1.16%
Vanguard S&P 500 ETF
Probably the most widely held ETF in the world, VOO has made millions of investors very happy, as the S&P 500 has continued to bring home the bacon. In fact, the S&P 500 is held in such high regard by Warren Buffett that he made and won a legendary $1 million bet with a hedge fund manager that the S&P 500 would outperform the manager’s fund over a 10-year span. For better or worse, the market-weighted S&P 500 is dominated and driven by the Magnificent 7 A.I. tech stocks, and its volatility and fortunes have risen and fallen accordingly.
|
Net Assets |
$1.42 trillion |
Avg. Daily Volume |
10.8 million shares |
|
Yield |
1.19% |
YTD Return |
-3.05% |
|
52 Wk. Range |
$449.60-$641.81 |
1-Year return |
32.31% |
|
Beta |
1.00 |
3-Year return |
18.28% |
|
Expense Ratio |
0.03% |
5-Year Return |
12.02% |
|
P/E Ratio |
26.84 |
10-Year Return |
14.12% |
Top 10 VOO Holdings:
- Nvidia Corp. – 7.31%
- Apple Inc. – 6.63%
- Microsoft Corp. – 4.96%
- Amazon.com Inc. – 3.47%
- Alphabet Inc. (GOOGL) – 3.08%
- Broadcom, Inc. – 2.56%
- Alphabet Inc. (GOOG) – 2.46%
- Meta Platforms, Inc. (Facebook) – 2.40%
- Tesla, Inc. – 1.92%
- Berkshire Hathaway, Inc. – 1.57%
The 2026 Performance Gap To Date
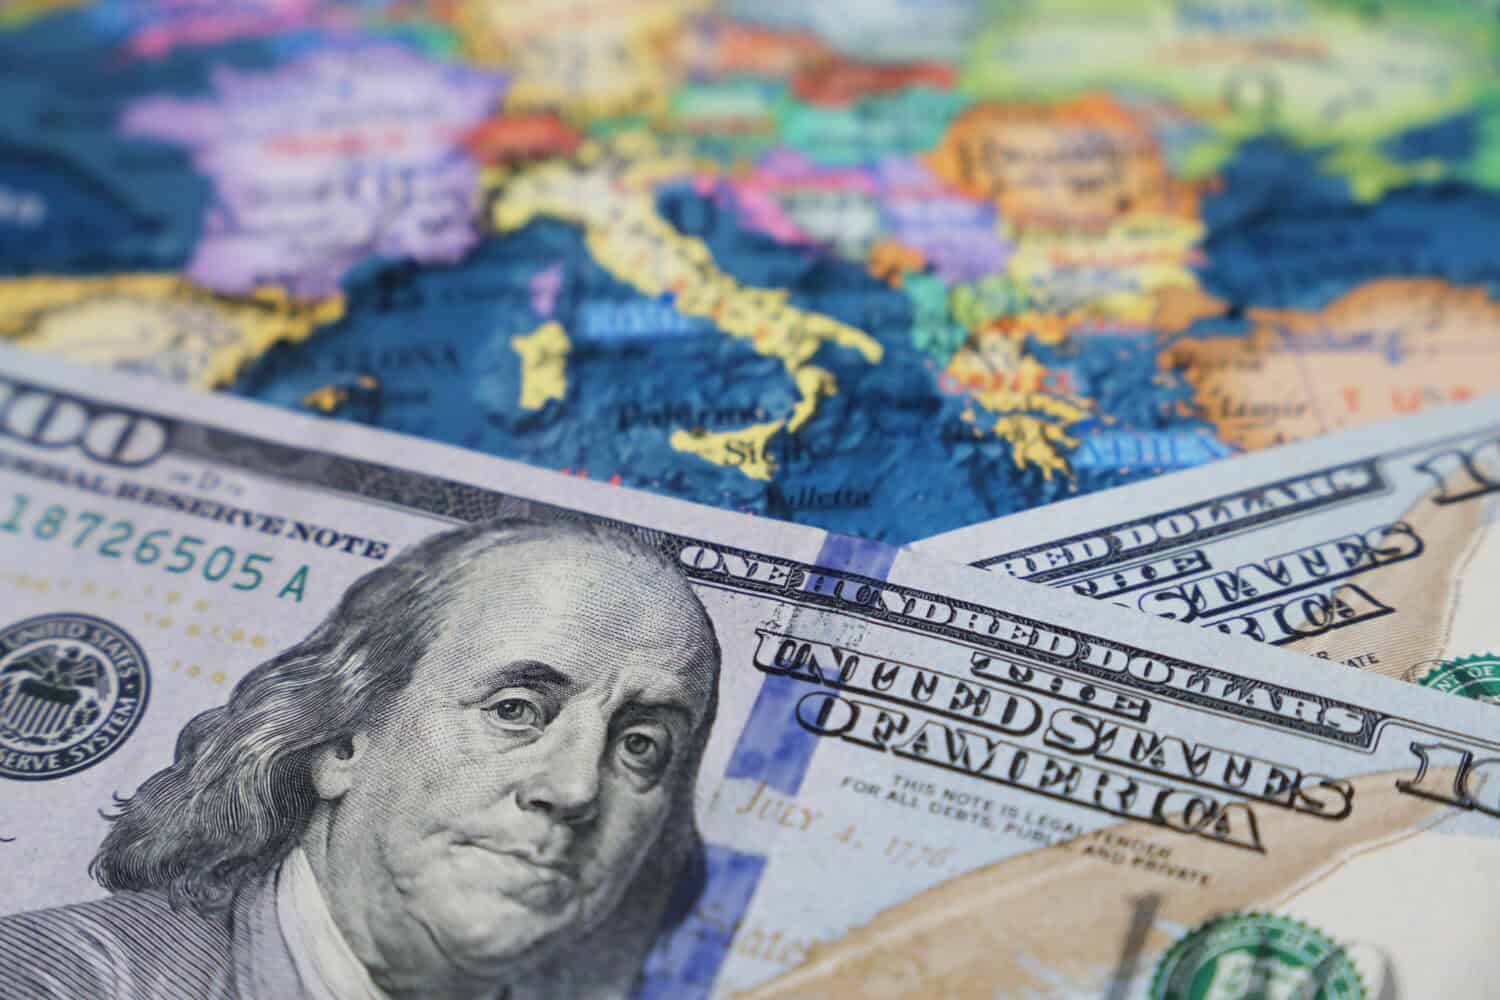
Billions in international trade between BRICS member nation away from the US dollar has contributed to its softer valuation.
There are three reasons that analysts have identified as to why VGK is outpacing VOO to date:
A Weakening US Dollar:
With US federal debt approaching $40 trillion, the US dollar has been falling in value – the result of Federal Reserve 24/7 money printing and congressional profligacy. The corresponding soaring value in physical gold and silver has reflected the waning confidence in the stability of US debt. Additionally, the rise of BRICS, which has led to a sizable degree of de-dollarization of international commodity trade, has also removed the allure of the US dollar. Anticipated interest rate cuts from the Federal Reserve will likely exert further downward pressure on the US dollar.
Sector Preferences From Global Investors:
The huge bull run on the AI focused Magnificent 7 stocks created the first multi-trillion valuations of Apple, Nvidia, Microsoft, et. al. This has also led to fears that the AI industry has become a bubble, not unlike that of the dotcoms. VGK’s stronger weighting towards financials and industrials is appealing to many institutional investors and echoes their skepticism as to current A.I. valuations.
P/E Ratio Difference:
In general, European stocks have lower P/E ratios than U.S. stocks. With fears abounding regarding an overheated stock market, familiar named European stocks have a perceived safer cache.
While VGK’s advantage has been maintained for Q1 2026 into April, there’s a good likelihood that VOO will overtake it sometime over the next few ensuing months. The proliferation of data centers and current US dominance in global energy production are huge “Trump” cards to hold. Adding VGK to a portfolio for the sake of diversification would appear to be a prudent move, although rotating completely away from the US market would be considerably riskier over the long haul.