Nike (NYSE:NKE | NKE Price Prediction) and Under Armour (NYSE:UAA) both just closed quarters that investors are reading as turnaround checkpoints. Nike posted a $0.35 EPS result on $11.28 billion in sales, its fourth straight beat. Under Armour delivered $0.09 adjusted EPS on $1.33 billion. Both founders-era CEOs are running comebacks. Only one has scale on its side.
Wholesale Carries Nike. EMEA Carries Under Armour.
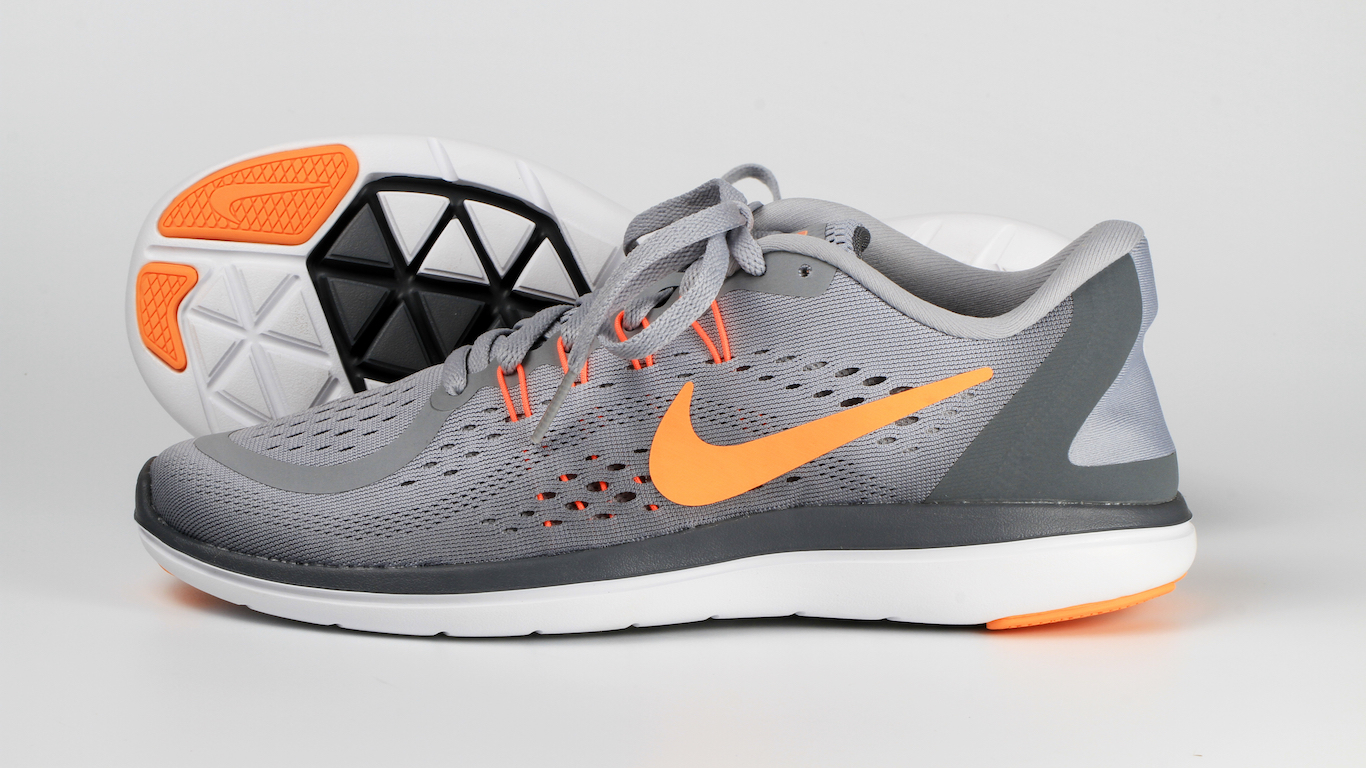
Elliott Hill’s “Win Now” plan leans on the wholesale channel he spent a year reseating. It worked again: NIKE Wholesale rose 5% to $6.5 billion, while NIKE Direct slipped 4% and digital fell 9%. Footwear ticked up 2%; Converse cratered 35%, a brand erosion management can no longer dismiss.
Greater China fell 7%, and gross margin contracted 130 basis points on tariffs. Hill called the company’s foundation “getting even stronger to build the future of NIKE.”
| Driver | Nike Q4 FY26 | Under Armour Q3 FY26 |
| Revenue YoY | +0.1% | -5.2% |
| Footwear | +2% | -12% |
| Wholesale | +5% | -6.4% |
| Bright Spot | North America +3% | Latin America +19.7% |
Under Armour’s quarter looks rougher under the hood, but it cleared a low bar loudly. Footwear sank 12% to $265 million, North America slid 10.3%, and gross margin compressed 310 basis points.
The bright spots are abroad: EMEA grew 6% and Latin America jumped 19.7%. Kevin Plank told investors the December quarter “marked the most challenging phase of our business reset.” Whether that holds depends on stabilizing footwear, which has now fallen double digits for multiple quarters.
Scale Investor vs. Survival Investor
The strategic split is visible in the cap table. Nike carries a market cap near $66 billion, a 3.62% dividend yield, and 24 consecutive years of dividend hikes backed by a $18 billion buyback program.
Under Armour’s market cap sits at $2.64 billion with no dividend and a $600 million senior notes maturity hitting in June. The forward multiples tell the rest: Nike trades at 23x forward earnings versus Under Armour at 57x, reflecting how thin UA’s earnings base remains.
Year-to-date, Nike shares are down 29.38%, while Under Armour has climbed 24.75%.
The Next Test Is Tariffs and Footwear
I will be watching whether Hill can lift gross margin off the 40.2% floor while Greater China stays soft. For Under Armour, the question is footwear. You cannot rebuild a sports brand with the running and basketball categories shrinking double digits. Plank’s raised guidance to $0.10 to $0.11 adjusted EPS for FY26 helps, but the $600 million debt wall in June is the harder catalyst.
Why Nike Carries the Stronger Setup
The case for Nike rests on the dividend, the wholesale recovery, and a CEO buying his own stock, factors that argue for a base case not dependent on heroics.
Under Armour reads as the smaller, more speculative profile. Brand momentum is real in EMEA, but North America is still down 10.3%, and refinancing risk crowds the calendar. If tariffs settle and footwear stabilizes through the summer, the UA setup deserves another look. Until then, scale dominates this matchup.