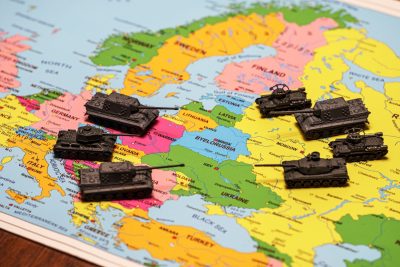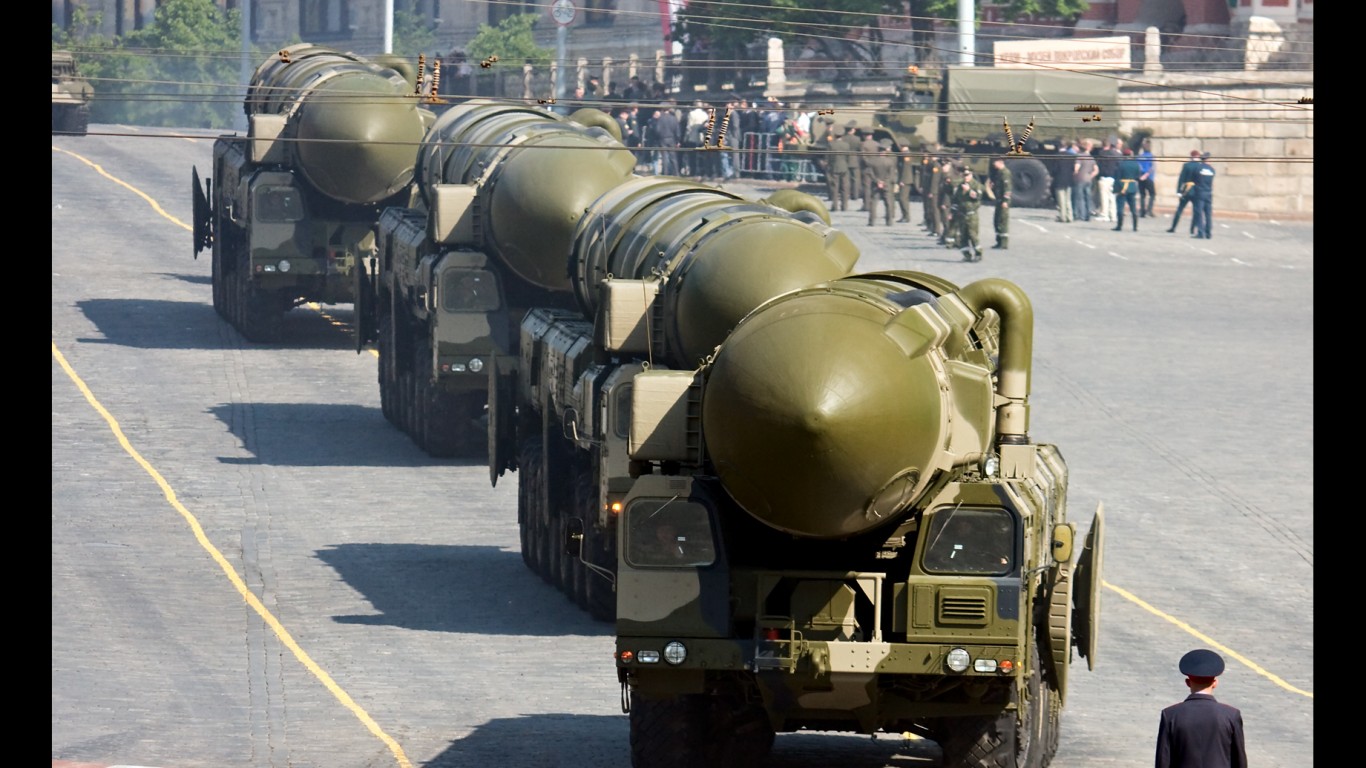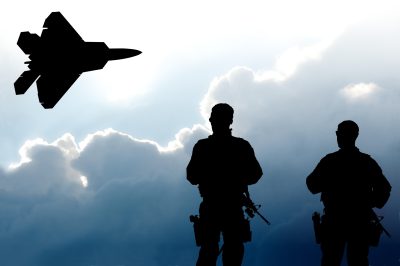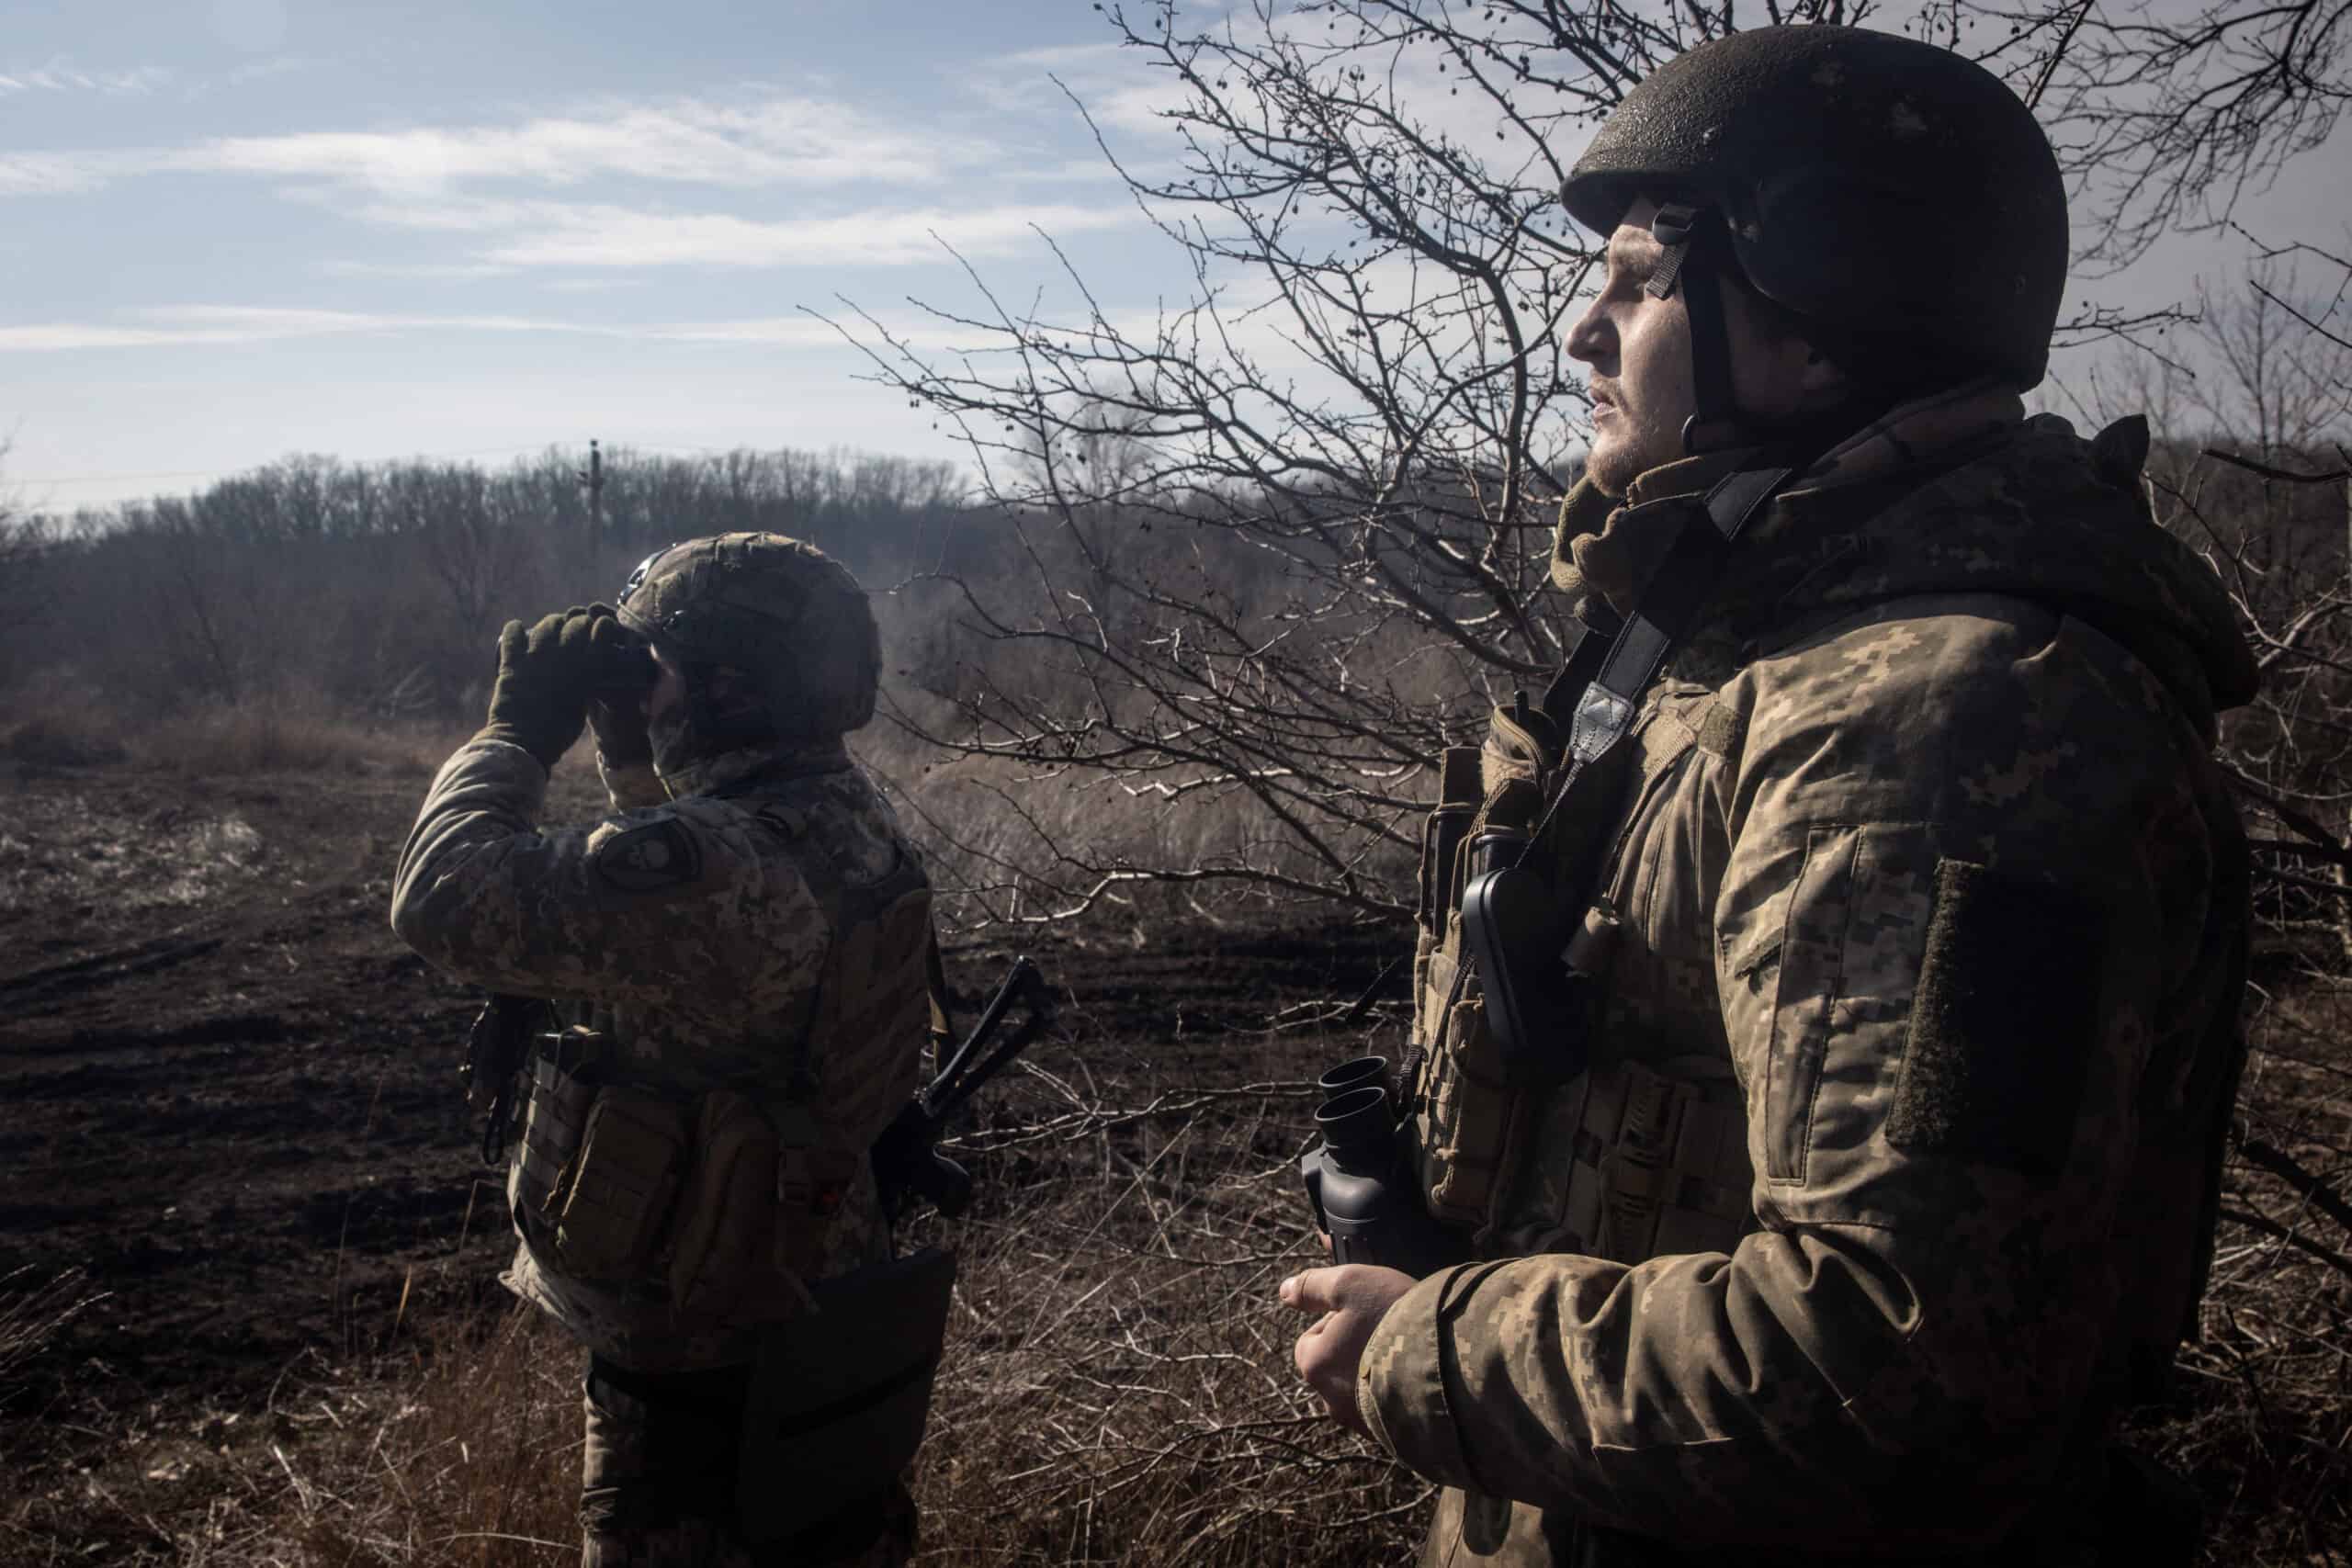
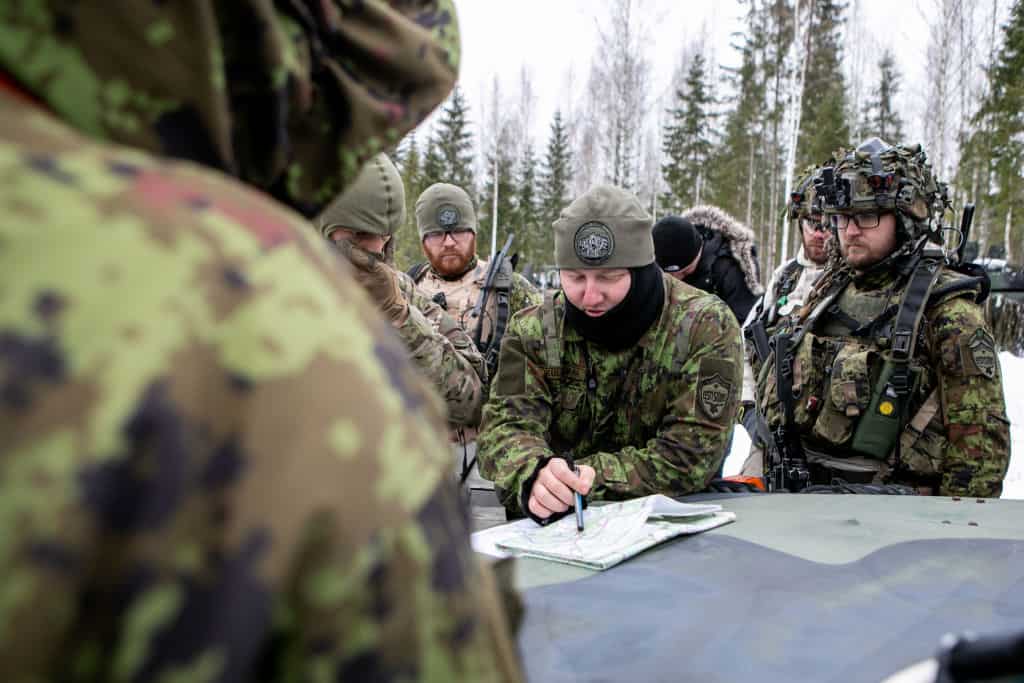
With Russia’s invasion of Ukraine in 2022, the countries of NATO have stood united to provide support to Ukraine in the form of weapons, funds, and other supplies. Although countries in NATO are providing aid to Ukraine, these countries have had no direct conflict with Russia. (Check out the 195 countries with military neutrality or no military, and who has to defend them.) 24/7 Wall St. took a look at Russia’s military power versus NATO, although NATO’s current stance is defensive with the goal of preventing further conflict.
Using data from Global Firepower’s 2024 report on international military capabilities, 24/7 Wall St. reviewed how NATO’s military strength compares to Russia’s military strength. If a conflict were to arise, individual NATO members could likely not commit all military assets to the war effort. Global Firepower assumed a minimum 25% contribution from each NATO ally for each category listed in this story, from active-duty troops and reserve forces to weapons and material. Similarly, Global Firepower assumed only 75% of Russian military assets to be available and operational. We also included Global Firepower’s estimates of American military power and assets.
Why It Matters
The ongoing war in Ukraine is the largest military conflict in Europe since World War II. While NATO has been supplying aid in the form of weapons and money to the Ukrainian effort, no NATO ally has engaged directly in combat…so far. Should the war spill across the border of a NATO country, all NATO allies will be obligated under the principle of collective defense to take up arms against Russia. Understanding how Russia and NATO allies are positioned provides a deeper look into how a potential war might go, and whose defense spending supports stronger military output.
Let’s look at where NATO’s military capabilities stand compared to Russia.
1. Oil production

- Russia’s projected capacity: 10.8 million barrels-per-day
- NATO’s projected capacity: 6.8 million barrels-per-day
- United States’ projected capacity: 18.0 million barrels-per-day
2. Combined budget

- Russia’s projected capacity: $82.6 billion
- NATO’s projected capacity: $235.5 billion
- United States’ projected capacity: $831.8 billion
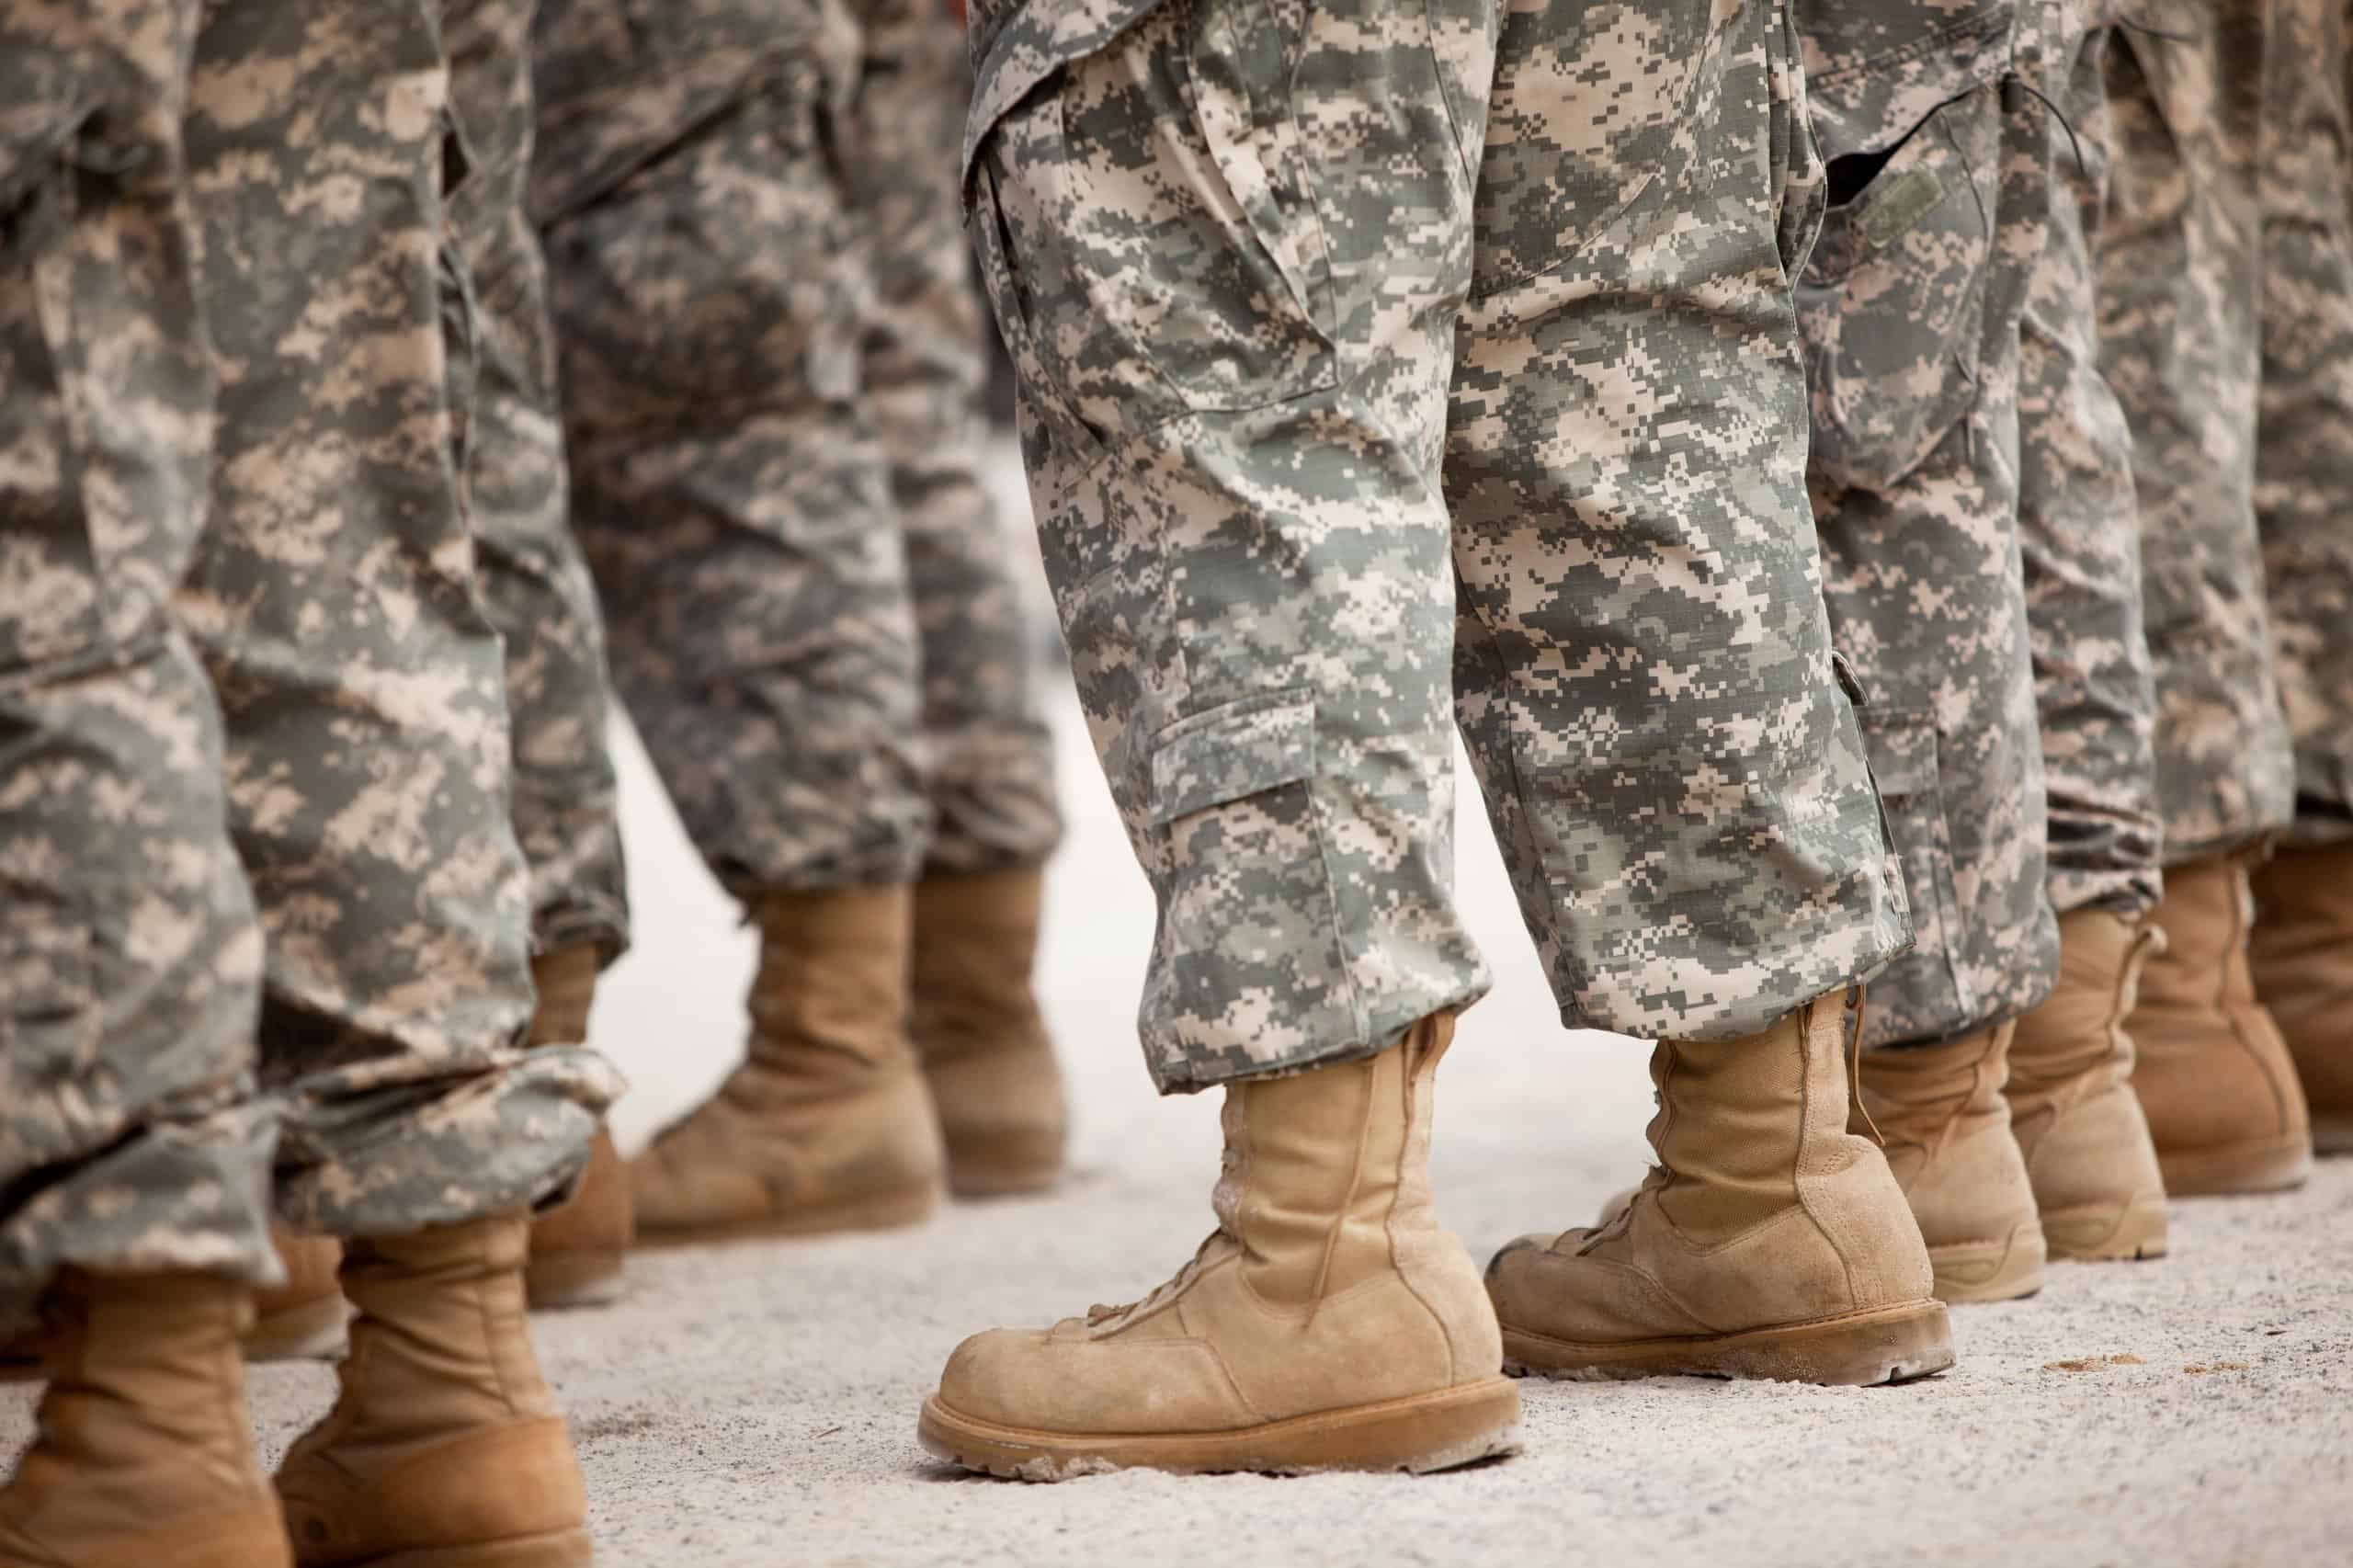
3. Labor Force

- Russia’s projected capacity: 52,500,000 personnel
- NATO’s projected capacity: 103,333,500 personnel
- United States’ projected capacity: 164,797,000 personnel
4. Mine Warfare Vessels

- Russia’s projected capacity: 37 hulls
- NATO’s projected capacity: 45 hulls
- United States’ projected capacity: 8 hulls
5. Submarines
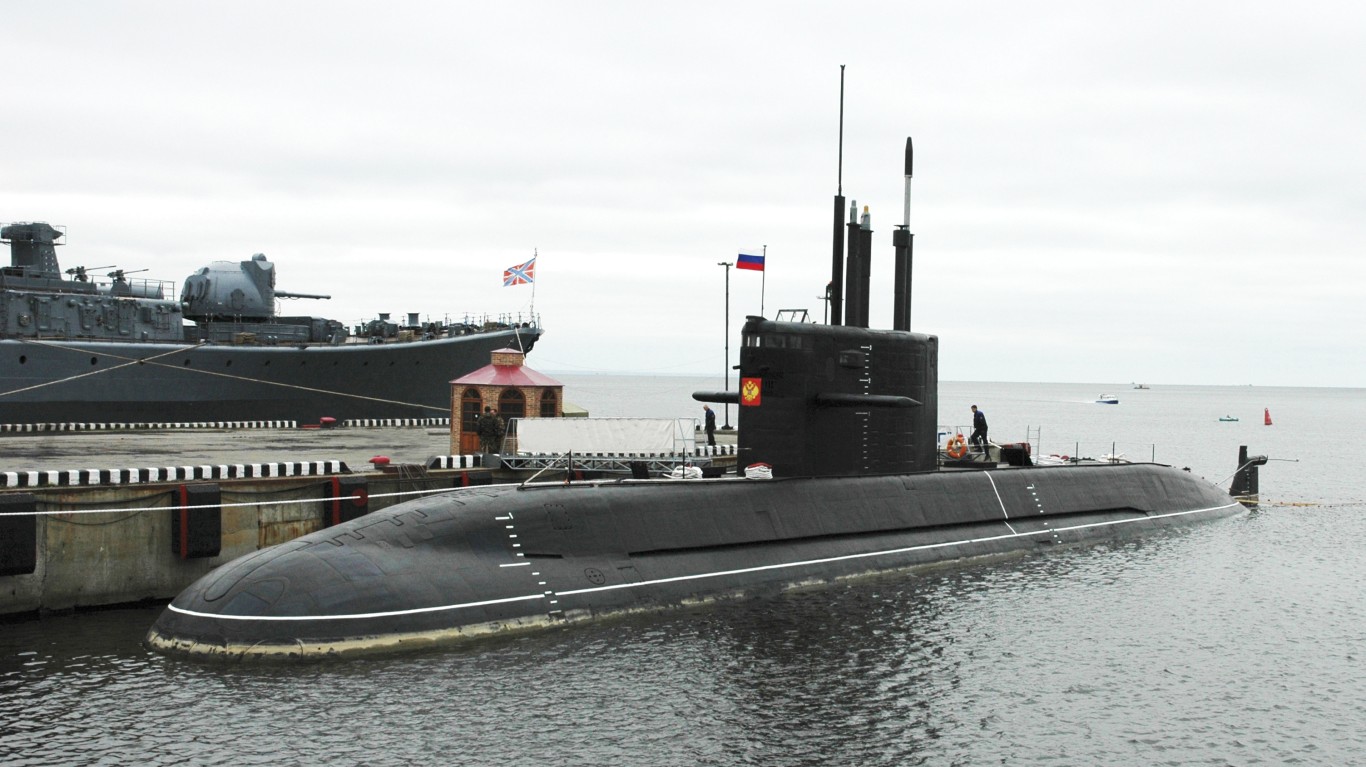
- Russia’s projected capacity: 53 hulls
- NATO’s projected capacity: 37 hulls
- United States’ projected capacity: 64 hulls
6. Corvettes
 is under... by Official U.S. Navy Page")
- Russia’s projected capacity: 65 hulls
- NATO’s projected capacity: 16 hulls
- United States’ projected capacity: 23 hulls
7. Frigates
- Russia’s projected capacity: 8 hulls
- NATO’s projected capacity: 34 hulls
- United States’ projected capacity: None
8. Naval Destroyers

- Russia’s projected capacity: 11 hulls
- NATO’s projected capacity: 28 hulls
- United States’ projected capacity: 75 hulls
9. Helicopter Carriers

- Russia’s projected capacity: None
- NATO’s projected capacity: 3 hulls
- United States’ projected capacity: 9 hulls
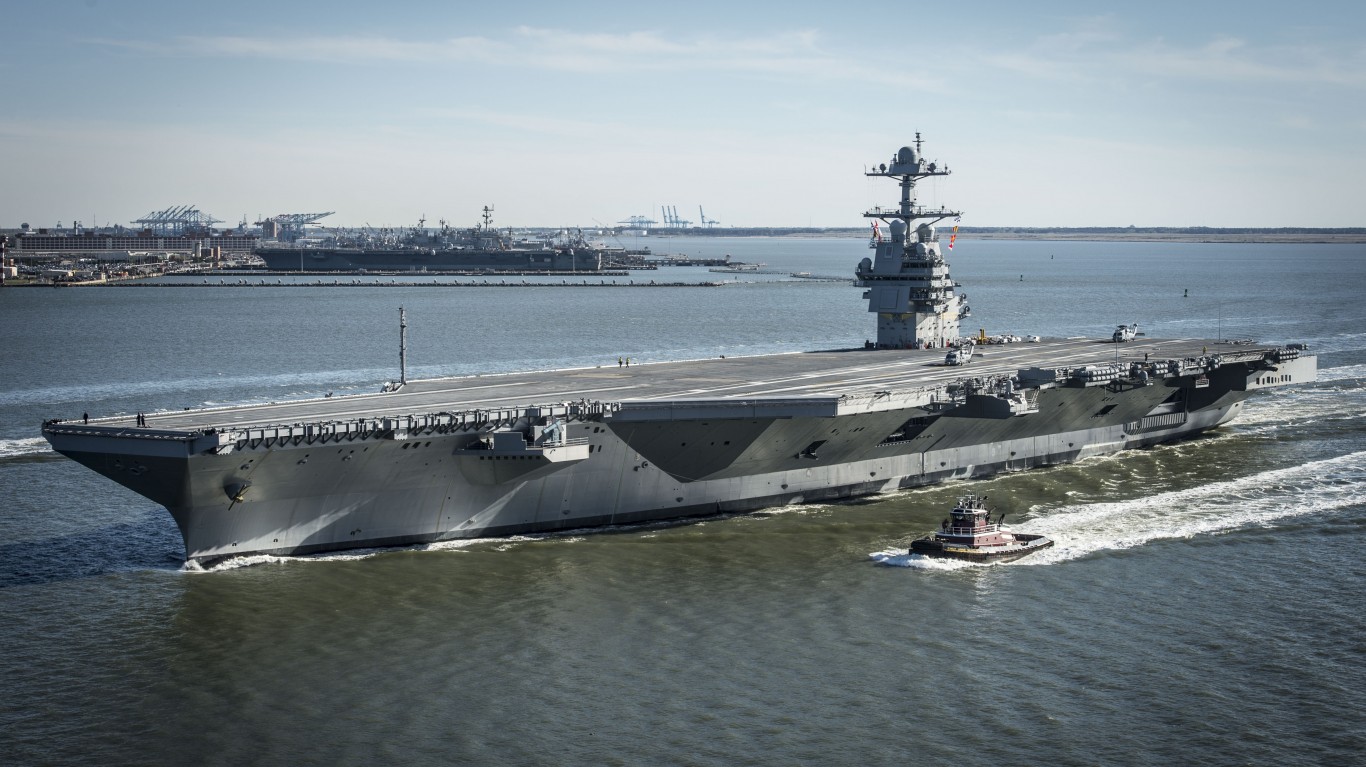
10. Aircraft Carriers
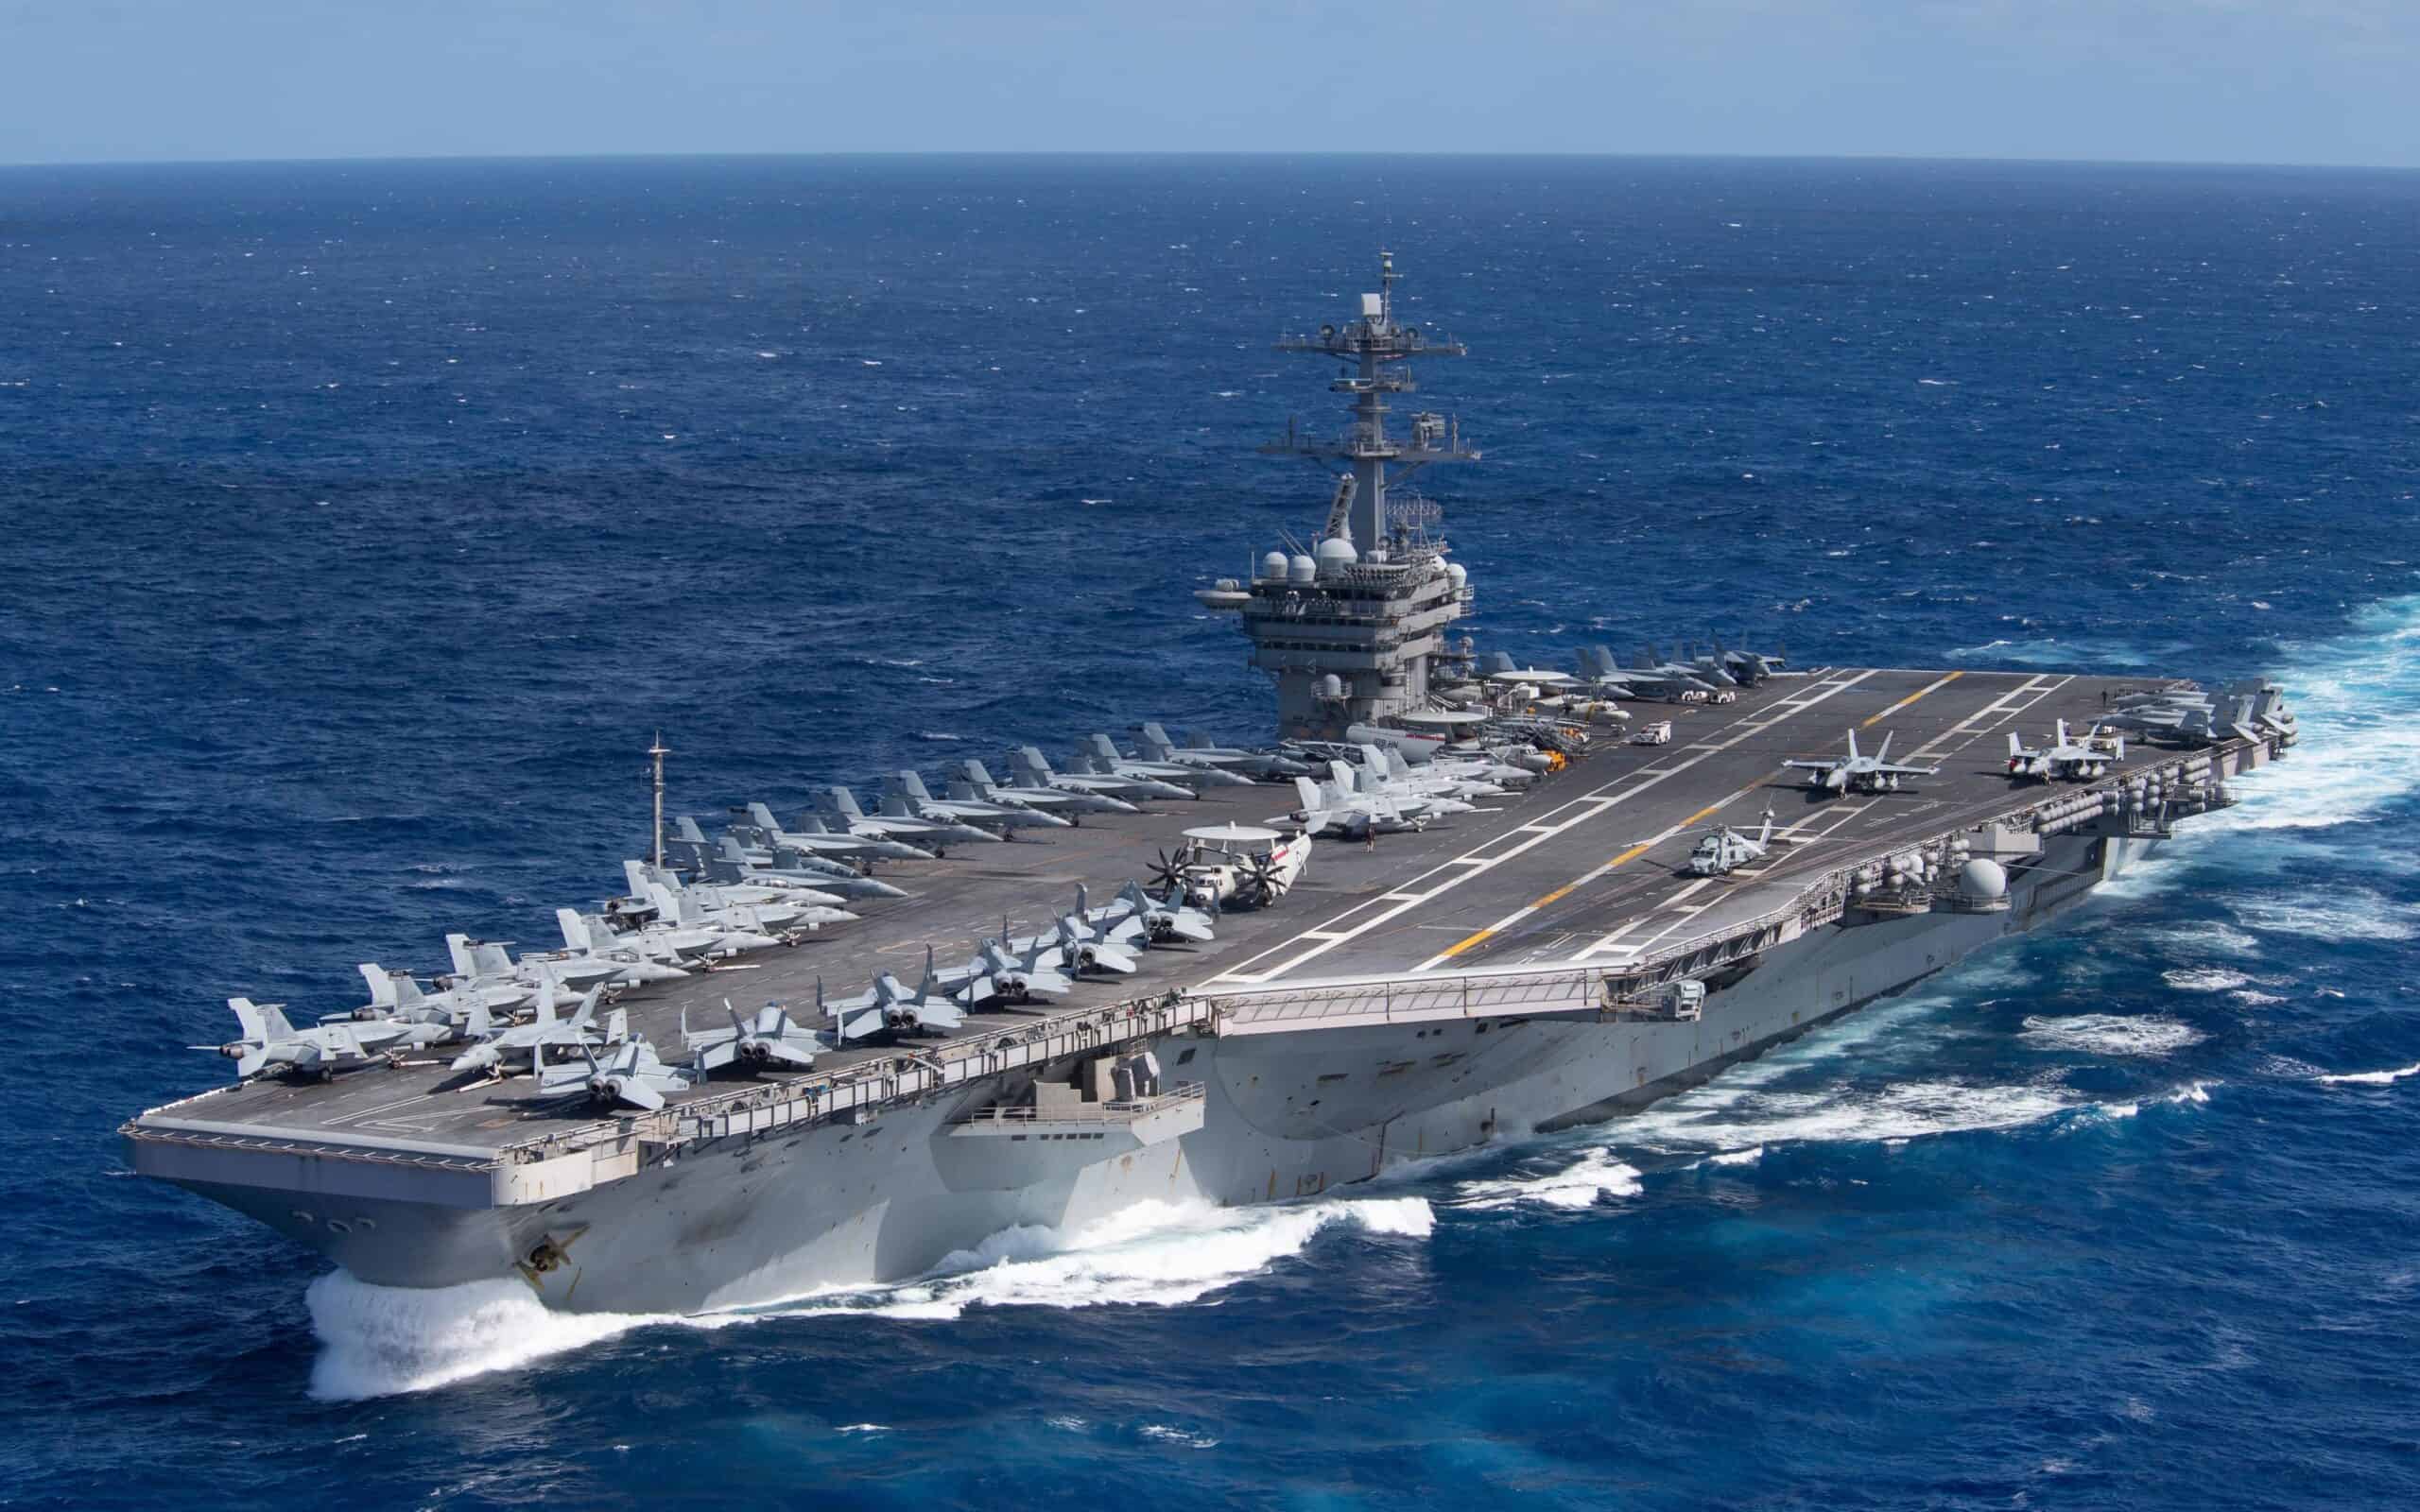
- Russia’s projected capacity: 1 hull
- NATO’s projected capacity: 4 hulls
- United States’ projected capacity: 11 hulls
11. Total Naval Assets
- Russia’s projected capacity: 449 hulls
- NATO’s projected capacity: 687 hulls
- United States’ projected capacity: 472 hulls
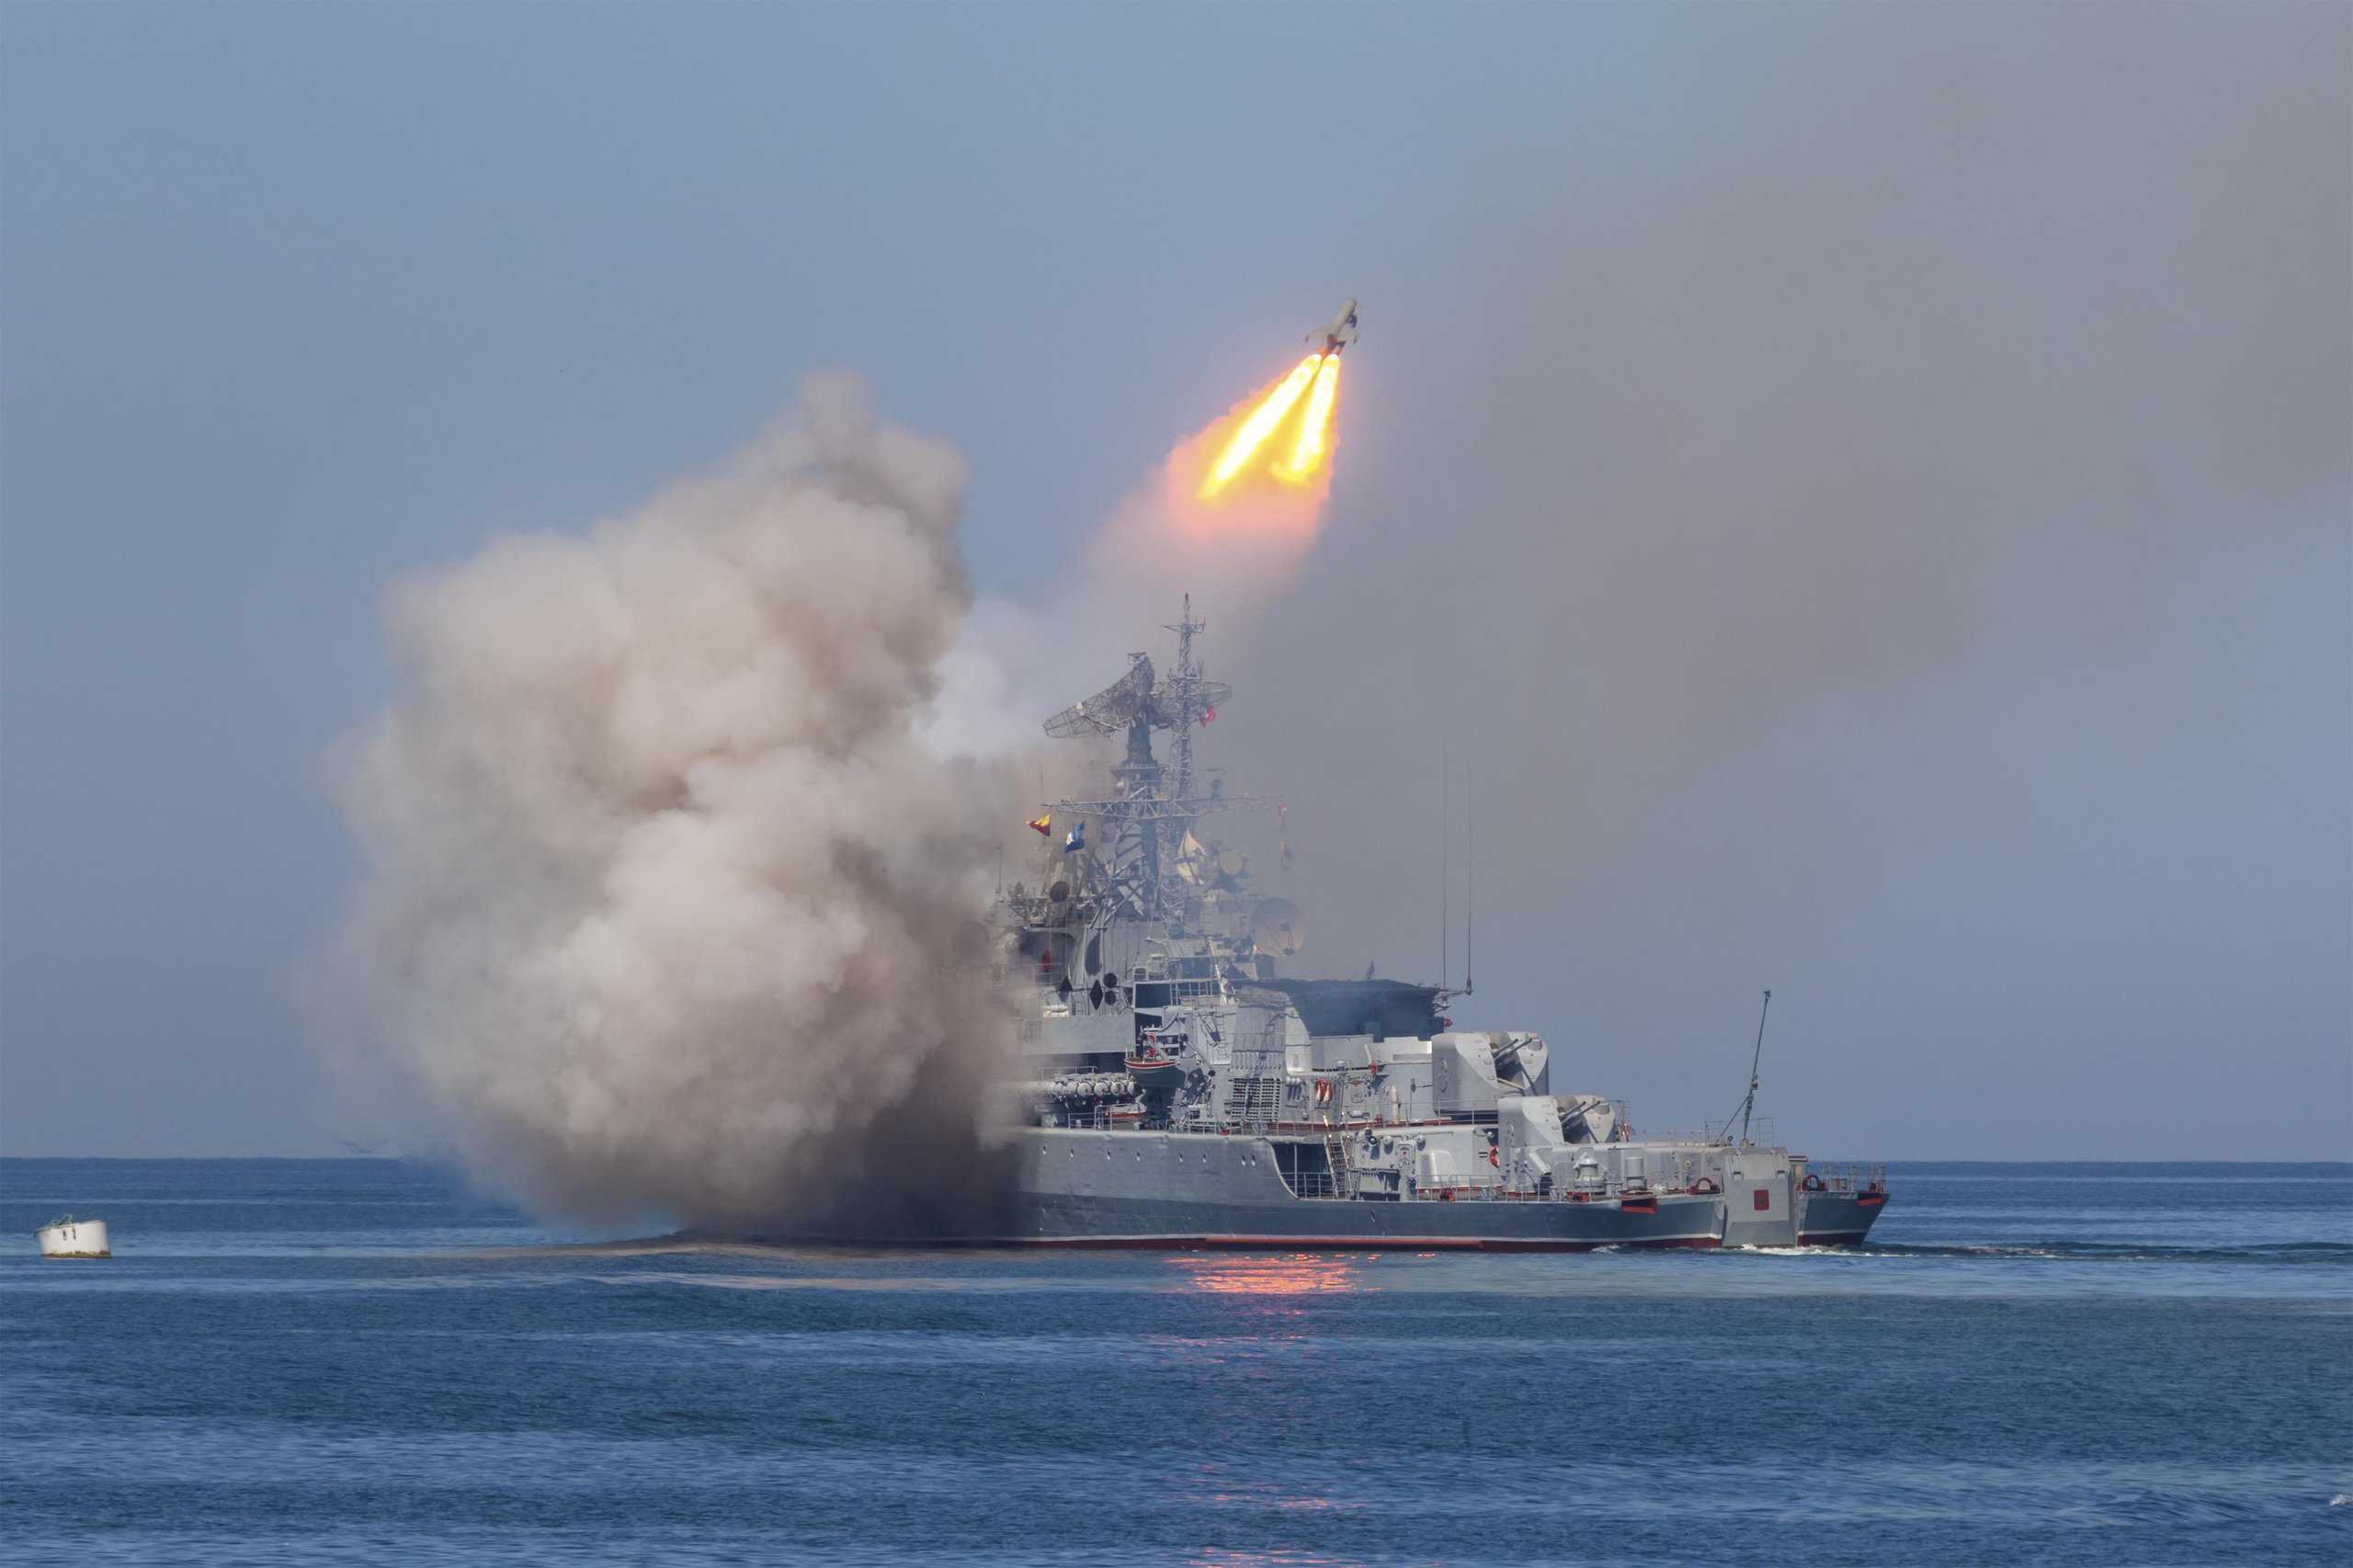
12. Rocket Artillery
- Russia’s projected capacity: 2,915 pieces
- NATO’s projected capacity: 429 pieces
- United States’ projected capacity: 694 pieces
13. Towed Artillery

- Russia’s projected capacity: 3,252 pieces
- NATO’s projected capacity: 1,765 pieces
- United States’ projected capacity: 1,267 pieces
14. Self-propelled Guns

- Russia’s projected capacity: 4,931 vehicles
- NATO’s projected capacity: 1,158 vehicles
- United States’ projected capacity: 1,595 vehicles
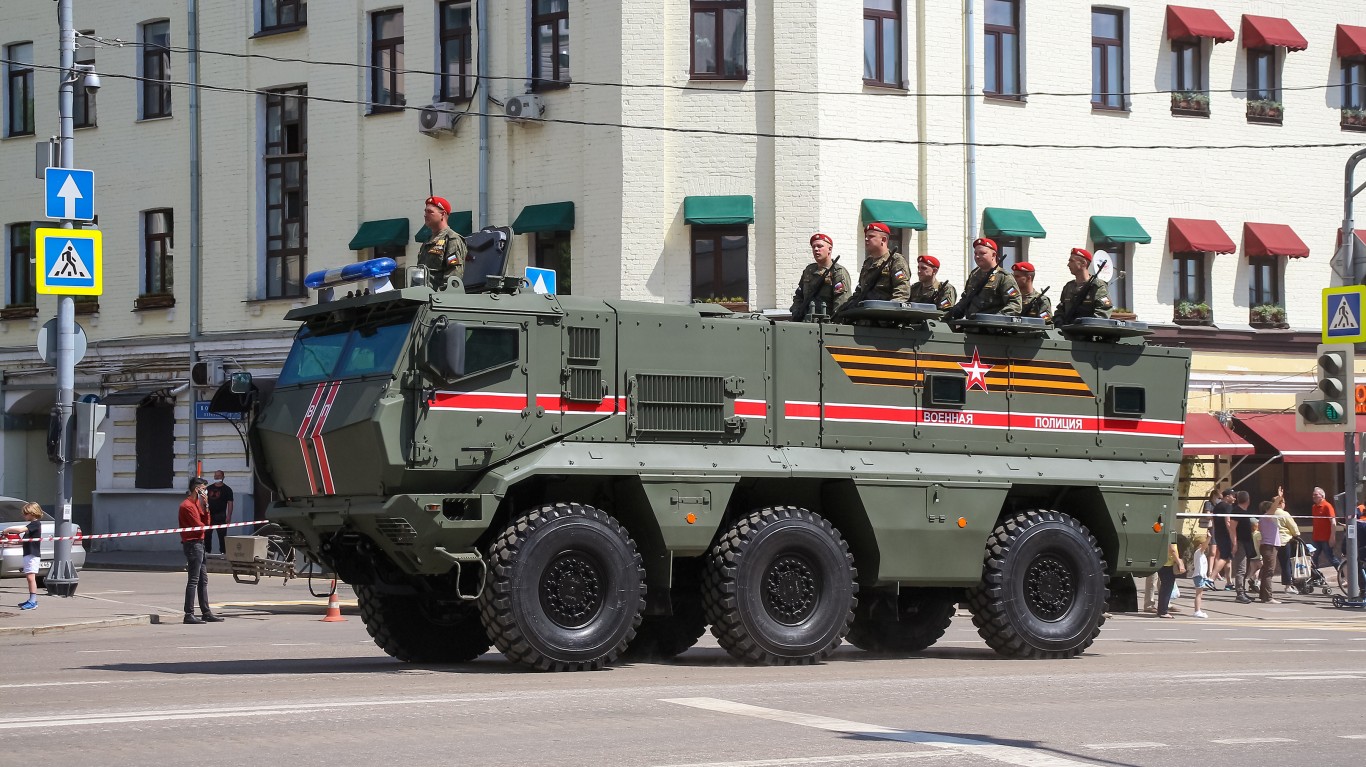
15. Armored Fighting Vehicles

- Russia’s projected capacity: 113,731 units
- NATO’s projected capacity: 251,909 units
- United States’ projected capacity: 360,069 units
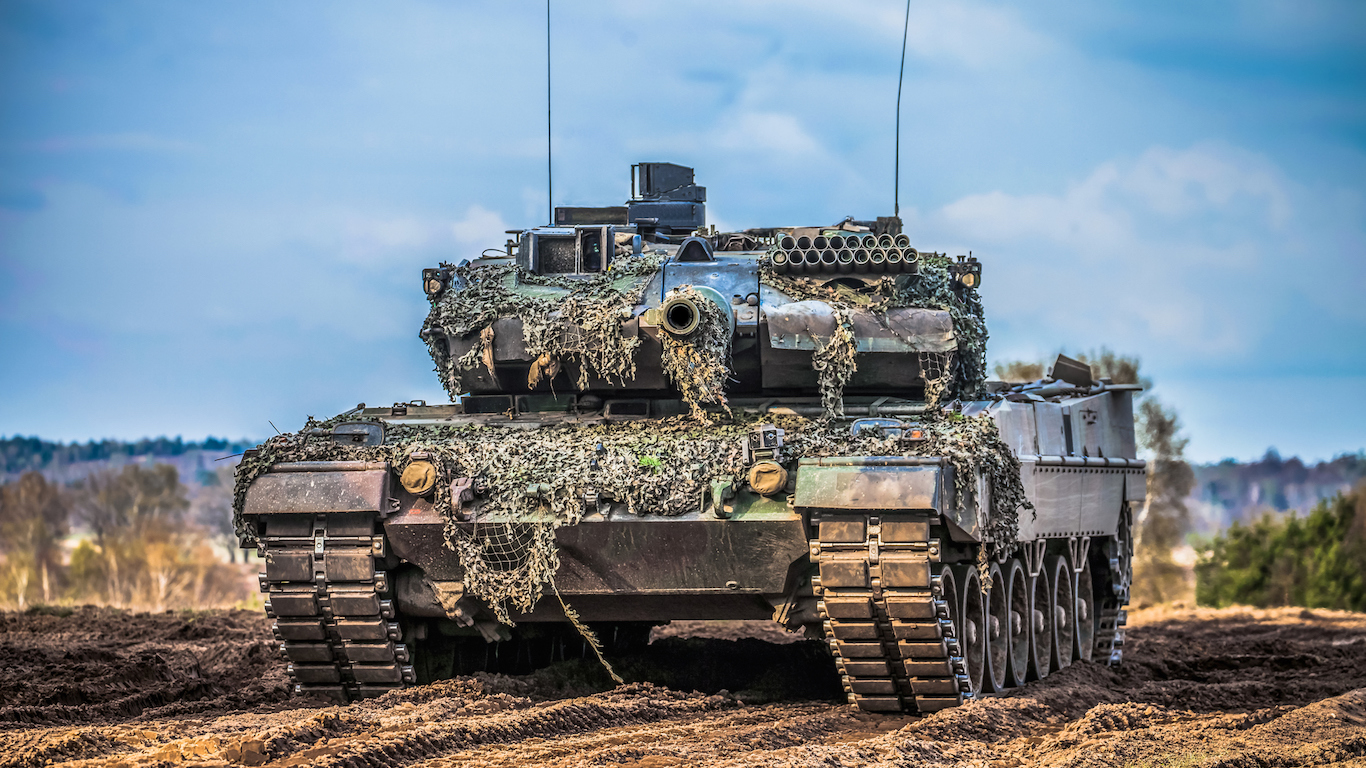
16. Tanks
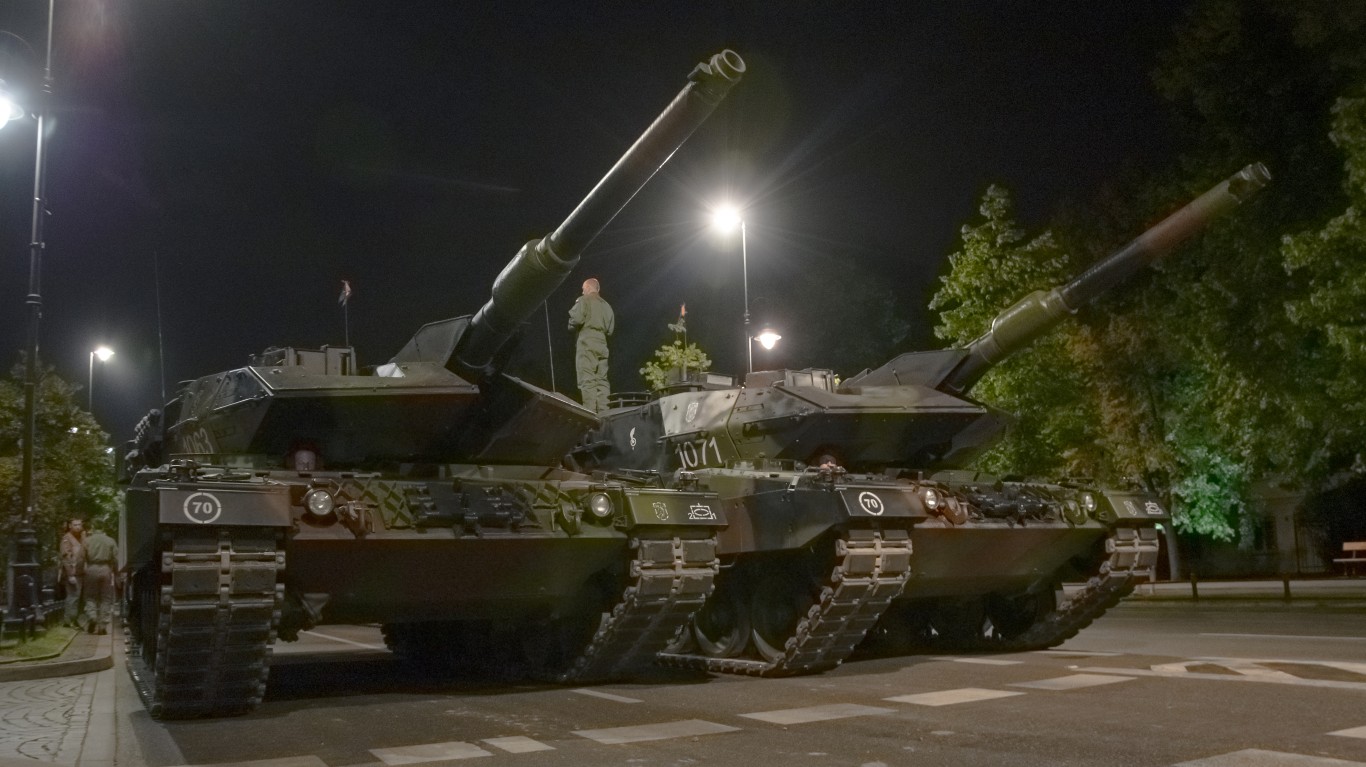
- Russia’s projected capacity: 9,425 vehicles
- NATO’s projected capacity: 3,184 vehicles
- United States’ projected capacity: 4,657 vehicles
17. Attack Helicopters

- Russia’s projected capacity: 403 units
- NATO’s projected capacity: 360 units
- United States’ projected capacity: 1,000 units
18. Helicopters
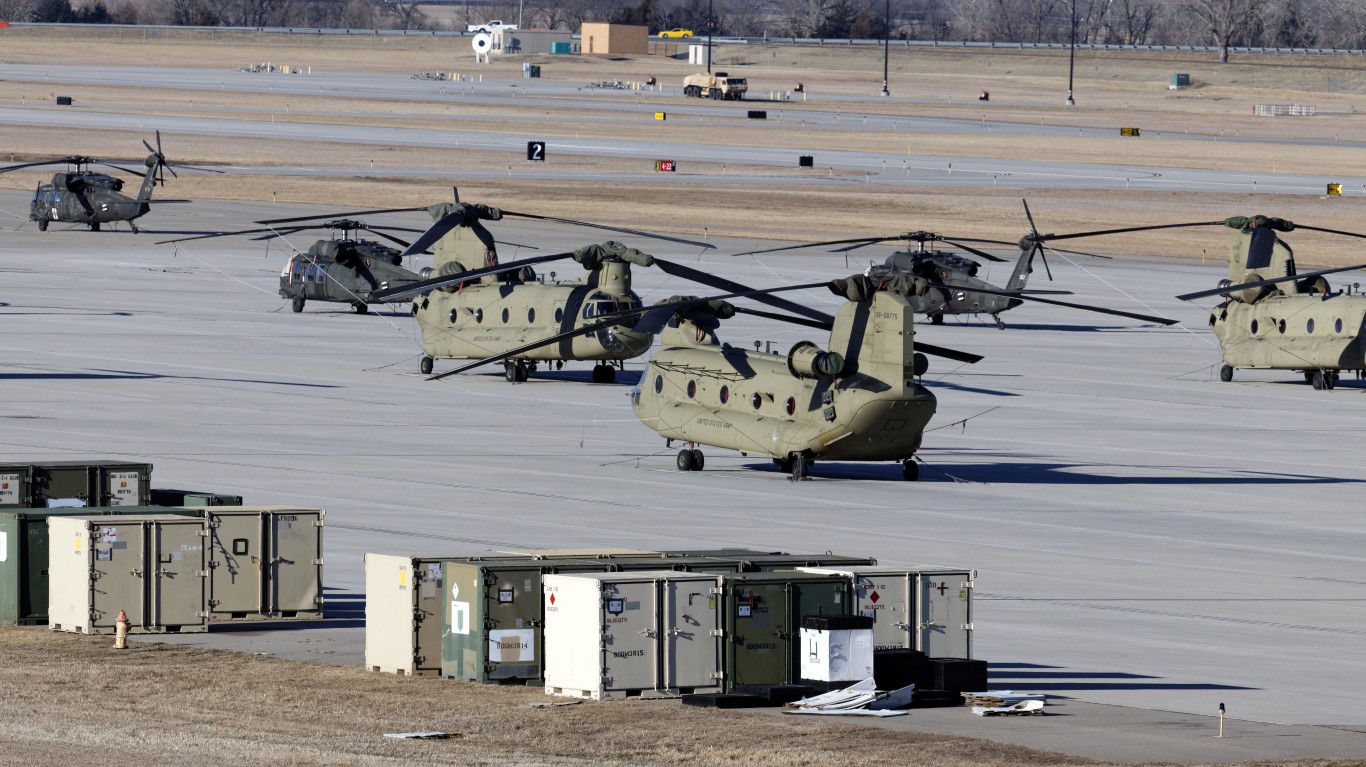
- Russia’s projected capacity: 1,148 units
- NATO’s projected capacity: 2,172 units
- United States’ projected capacity: 5,737 units
19. Aerial Refueling Craft
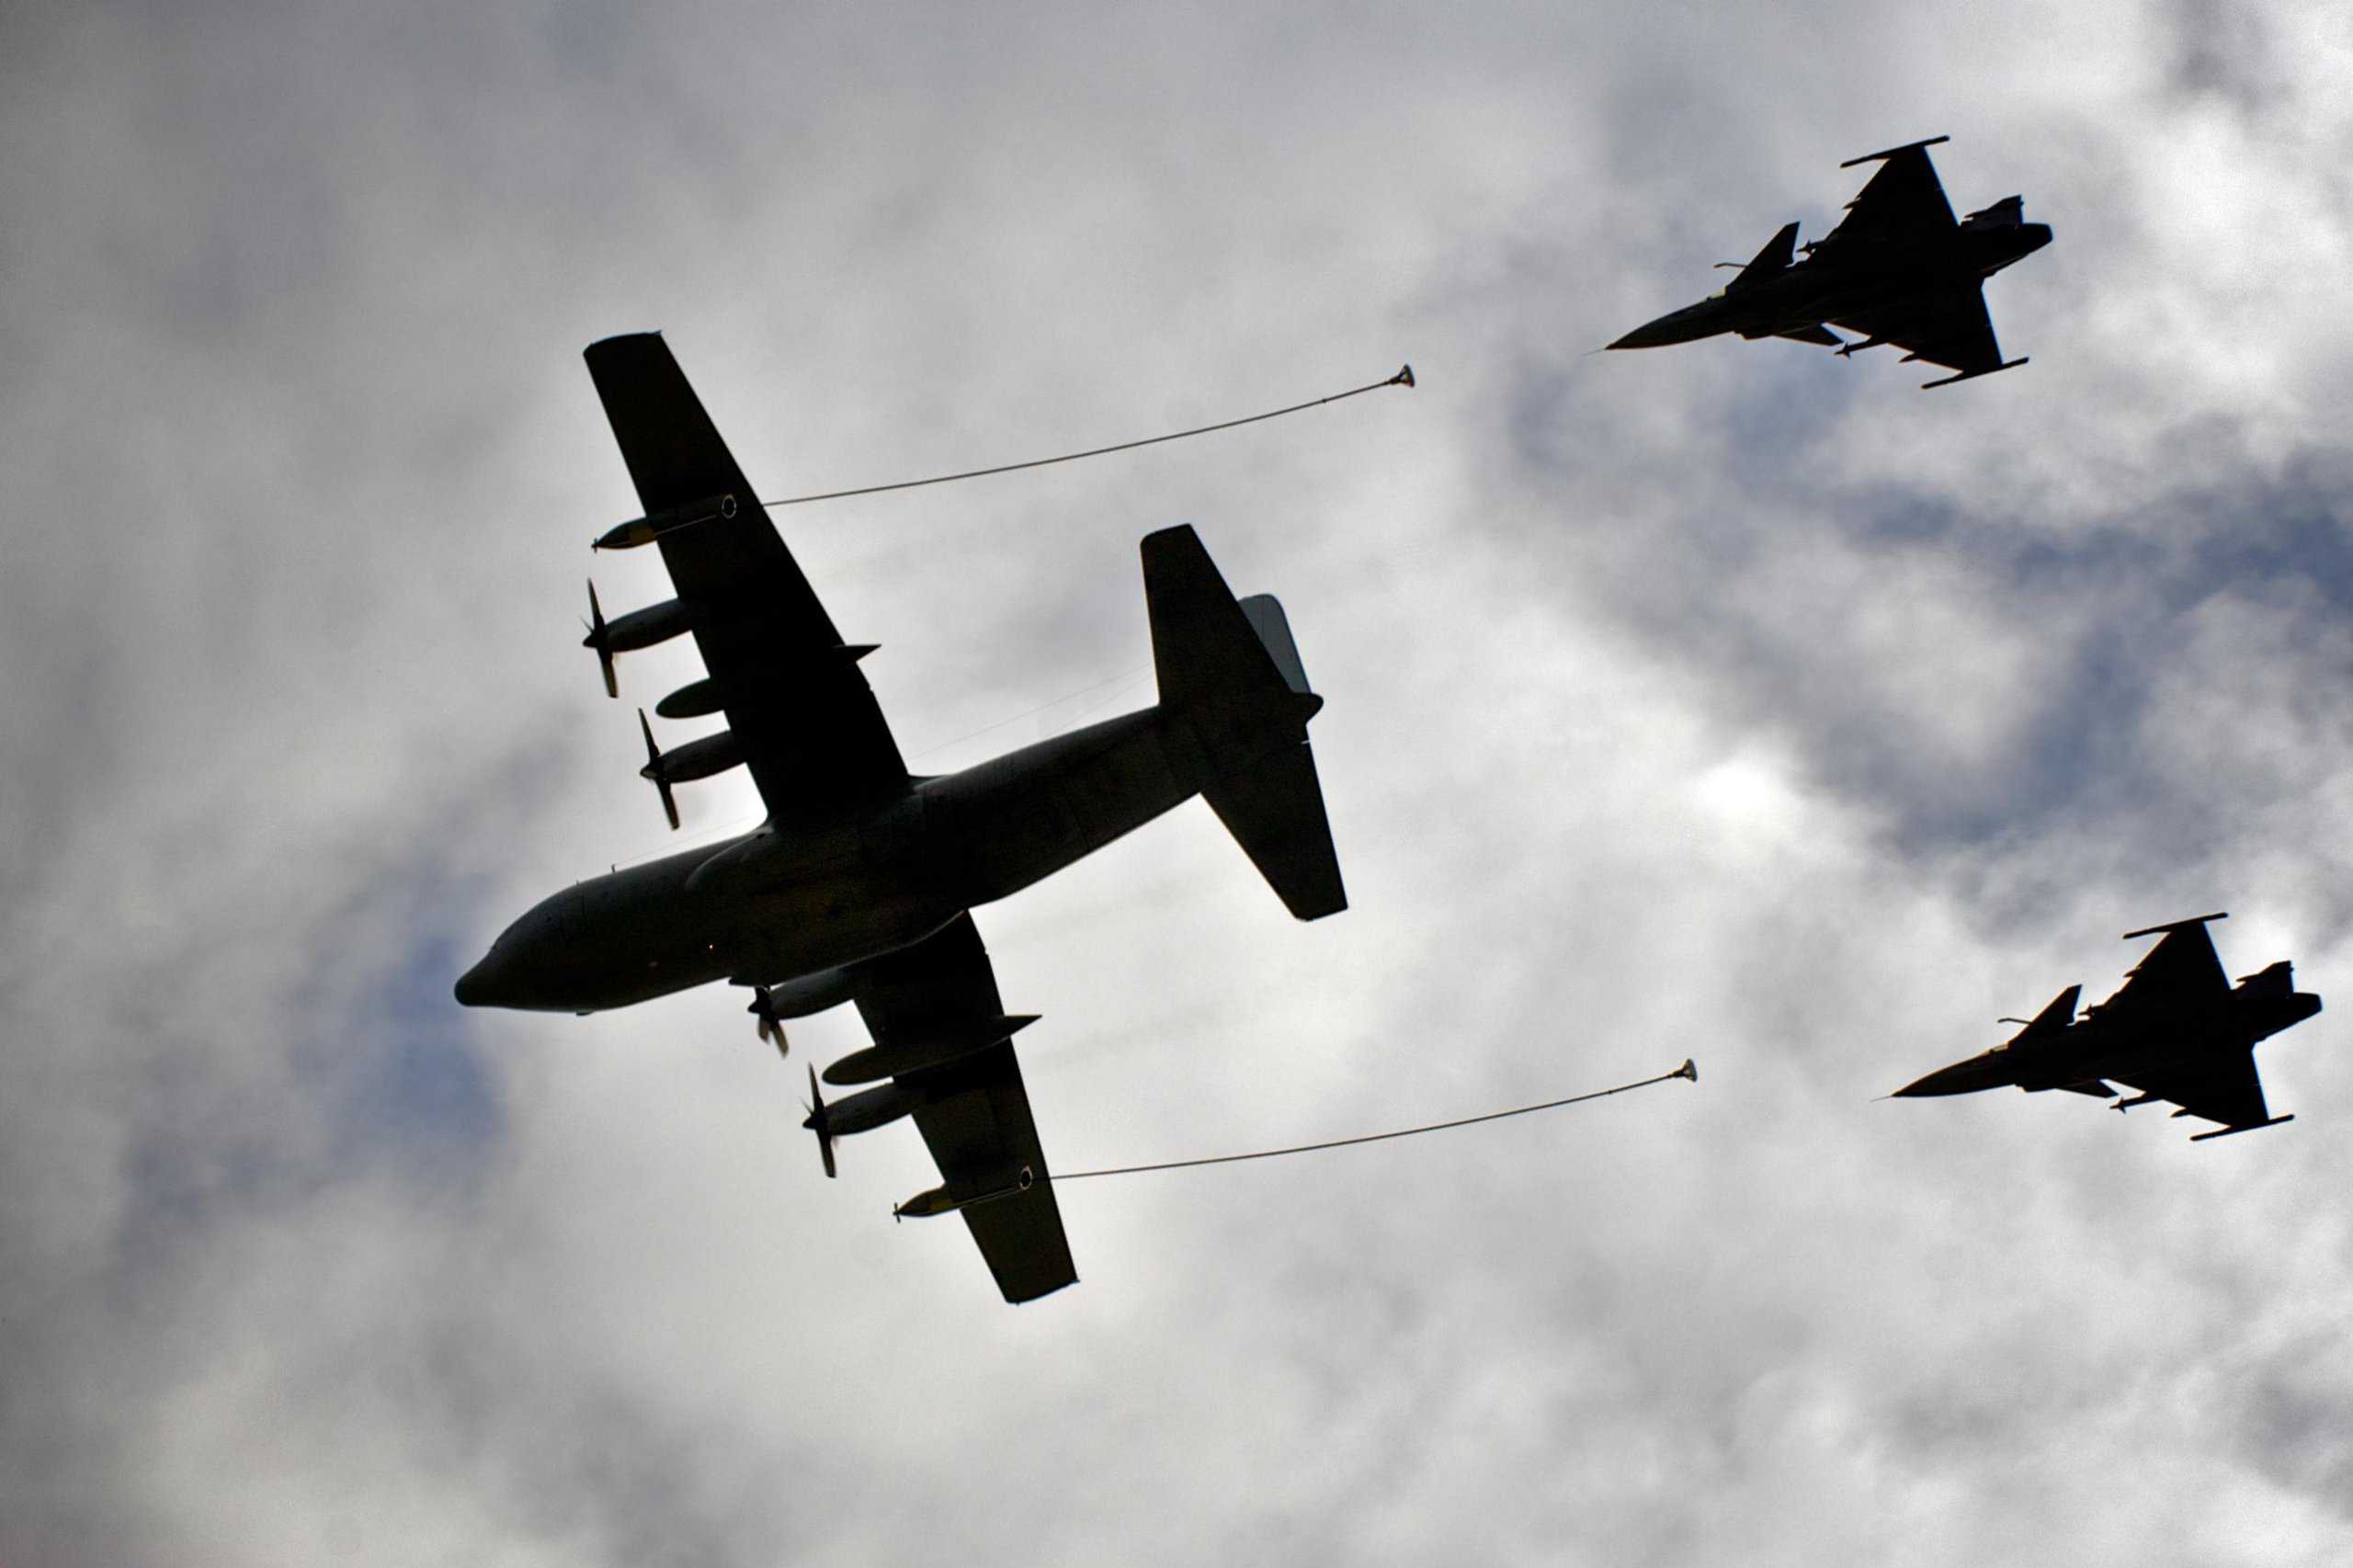
- Russia’s projected capacity: 14 units
- NATO’s projected capacity: 155 units
- United States’ projected capacity: 606 units
20. Special-mission Aircraft

- Russia’s projected capacity: 110 units
- NATO’s projected capacity: 244 units
- United States’ projected capacity: 695 units
21. Fixed-wing Transporters

- Russia’s projected capacity: 333 units
- NATO’s projected capacity: 381 units
- United States’ projected capacity: 957 units
22. Dedicated Attack Aircraft

- Russia’s projected capacity: 558 units
- NATO’s projected capacity: 277 units
- United States’ projected capacity: 896 units
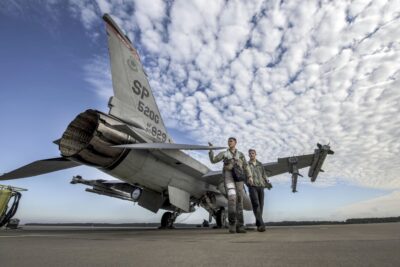
23. Fighter and Interceptor Aircraft

- Russia’s projected capacity: 580 units
- NATO’s projected capacity: 881 units
- United States’ projected capacity: 1,854 units
24. Total Airpower

- Russia’s projected capacity: 3,137 aircraft
- NATO’s projected capacity: 5,253 aircraft
- United States’ projected capacity: 13,209 aircraft
25. Reserve Manpower
- Russia’s projected capacity: 187,500 personnel
- NATO’s projected capacity: 649,150 personnel
- United States’ projected capacity: 799,500 personnel
26. Frontline Manpower
- Russia’s projected capacity: 623,175 personnel
- NATO’s projected capacity: 851,350 personnel
- United States’ projected capacity: 1,328,000 personnel
27. Combined Manpower
- Russia’s projected capacity: 810,000 personnel
- NATO’s projected capacity: 1,506,750 personnel
- United States’ projected capacity: 2,127,500 personnel