
The Federal Reserve’s 2022 Survey of Consumer Finances captured a housing market split into two Americas. For homeowners, the three years from 2019 to 2022 produced the single largest jump in housing wealth on record. For renters and would-be buyers, the same period produced the worst affordability ratio in modern history. The headline number is a 44% gain. The story underneath it is who got to keep that gain and who got priced out.
The 44% Number, in Plain Terms
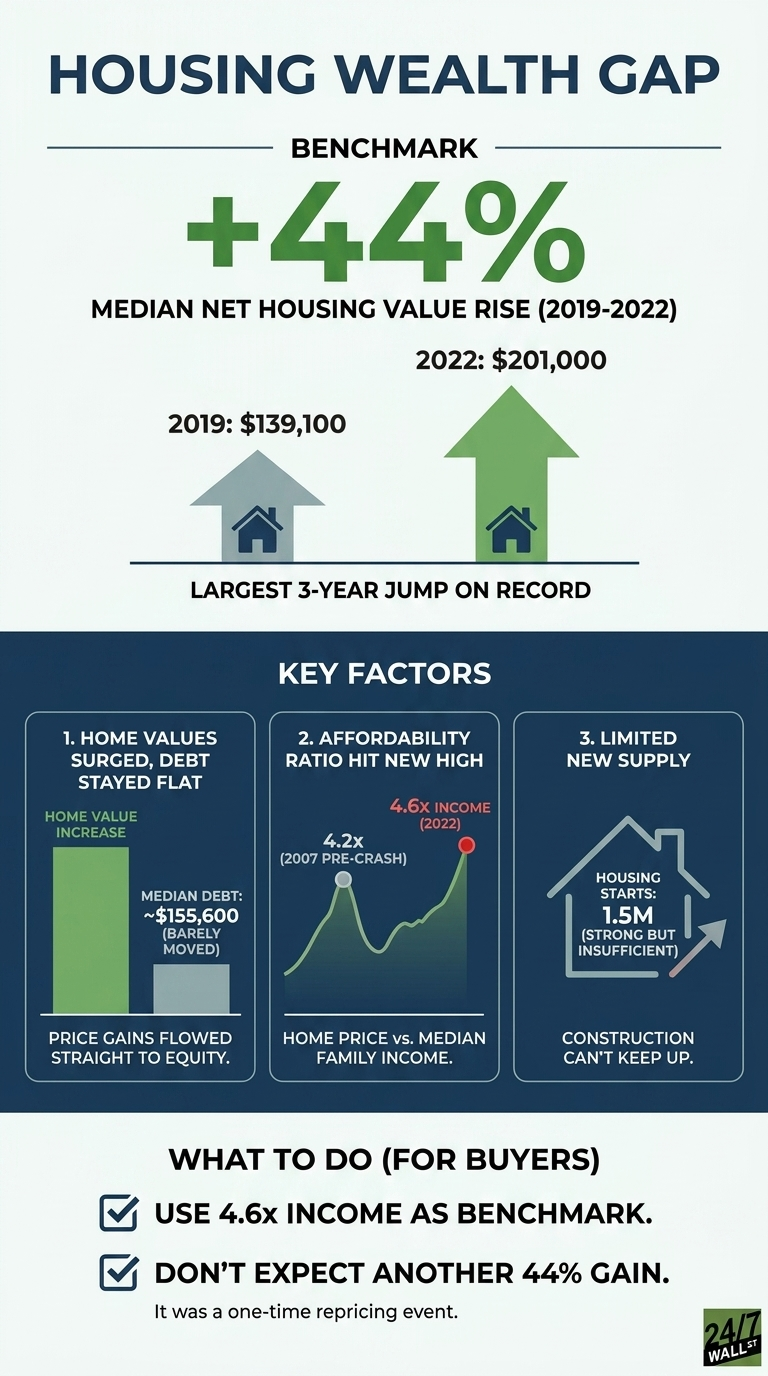
According to the Federal Reserve’s Survey of Consumer Finances, median net housing value rose 44% from $139,100 to $200,000 between 2019 and 2022. Net housing value is the equity portion: home value minus mortgage debt. The figure climbed because home prices surged while mortgage balances barely moved. Median home-secured debt decreased less than 1% to $155,600 over the same window, so almost the entire price increase flowed straight into owner equity rather than being absorbed by larger loans.
The distinction between those two patterns matters. When home values rise, and mortgage debt rises with them, equity gains are muted. When home values rise, and debt stays flat, the balance sheet effect is concentrated. The 2019 to 2022 period was the second pattern, which is why the Fed described it as the largest three-year increase on record in the modern Survey of Consumer Finances.
The Affordability Ratio Reached a New High
The same data set explains why new buyers are struggling. The ratio of median home value to median family income reached 4.6 times in 2022, surpassing the previous peak of 4.2 in 2007. The 2007 figure was the prior reference point for stretched housing markets, and it preceded the housing crash. The 2022 reading sits above it.
The ratio is the most direct affordability measure available because it strips out interest rates and loan terms and asks a simpler question: how many years of household income does a typical home cost? At 4.6 times, the answer is the highest reading in the survey’s data going back to 1998, surpassing the previous peak of 4.2 set in 2007. Real income gains over the period were not enough to offset the price increase, which is the mechanical reason the ratio kept climbing.
Where the Wealth Went
The gains were not evenly distributed as real median net worth surged 37% overall between 2019 and 2022, and the housing component drove a meaningful share of that increase. For families in the bottom 90% of the usual income distribution, rising house values and increased homeownership contributed substantially to overall net worth growth. The condition was simple: a household had to already own a home, or buy one during the window, to participate.
The homeownership rate increased slightly to 66.1% in 2022. That figure means roughly two-thirds of households captured the equity gains, and one-third did not. The third factor is that non-owners face a higher price-to-income ratio than buyers did at the 2007 peak, which is the structural reason the gap between owners and non-owners widened during the same period that overall household wealth was rising.
Why the Gap Persists
Existing homeowners who locked in low fixed mortgage rates before 2022 carry payments that reflect the older rate environment. New buyers face current borrowing costs against the higher price level. The price level rose 44% in equity terms, the income denominator did not keep pace, and the financing cost on the buyer side does not match what existing owners are paying. Each piece reinforces the others.
The Survey of Consumer Finances documents what happened without forecasting where home values will go next. What happened is that a three-year window produced a record equity gain for owners and a record affordability ratio for buyers, drawn from the same set of price changes.
Considerations for Households Still Trying to Buy
Three observations follow from the data:
- The 4.6 times income ratio stands as a benchmark alongside the 30% of income mortgage payment rule. A target home costing more than 4.6 times annual household income sits above the 2022 national median stretch.
- The fact that $155,600 in median home-secured debt reflects a population dominated by older mortgages. New loans on current prices will be larger, and the equity build will be slower.
- The 44% gain captured in the survey was a one-time repricing event rather than a recurring annual return. Underwriting a purchase on the assumption that the next three years will repeat is not supported by the data.
The post-pandemic housing market locked in the advantage for existing homeowners and extended the disadvantage for everyone still trying to enter the market. The Survey of Consumer Finances is the record of how that happened.