
The Federal Reserve’s 2022 Survey of Consumer Finances delivered a headline that sounded like progress for ordinary households: 58% of American families now hold stock either directly or through retirement and mutual fund accounts, up from 53% in 2019. Direct ownership of individual shares climbed from 15% to 21% over the same period, the largest change on record according to the Fed. The participation rate represents a meaningful step up from prior surveys. The dollar values behind that participation tell a different story, one where access to the market and meaningful ownership of it are two very different things.
The Average Hides the Median
The mean balance is the figure most people see in headlines, and it is almost always misleading for questions about distribution. If ten families each hold $5,000 in stock and an eleventh walks in with $5 million, the median holding is still $5,000 while the mean leaps past $450,000. The SCF reports both, and the distance between them is the entire wealth-gap story. Broad participation pulls the headline higher, but it does not move the typical family’s balance much.
What Each Group Actually Owns
Among families in the bottom half of the income distribution, only 34% owned any stock in 2022. Among families in the top income decile, the figure was 95%. Participation alone explains part of the gap, but the conditional balances explain the rest. For the bottom half of stockholders, the median holding was $12,600. For the top decile, the median holding was $608,000. That is roughly a 48-fold difference between the two groups, measured only among owners. The gap reflects the typical experience inside each band rather than a few outliers at the top.
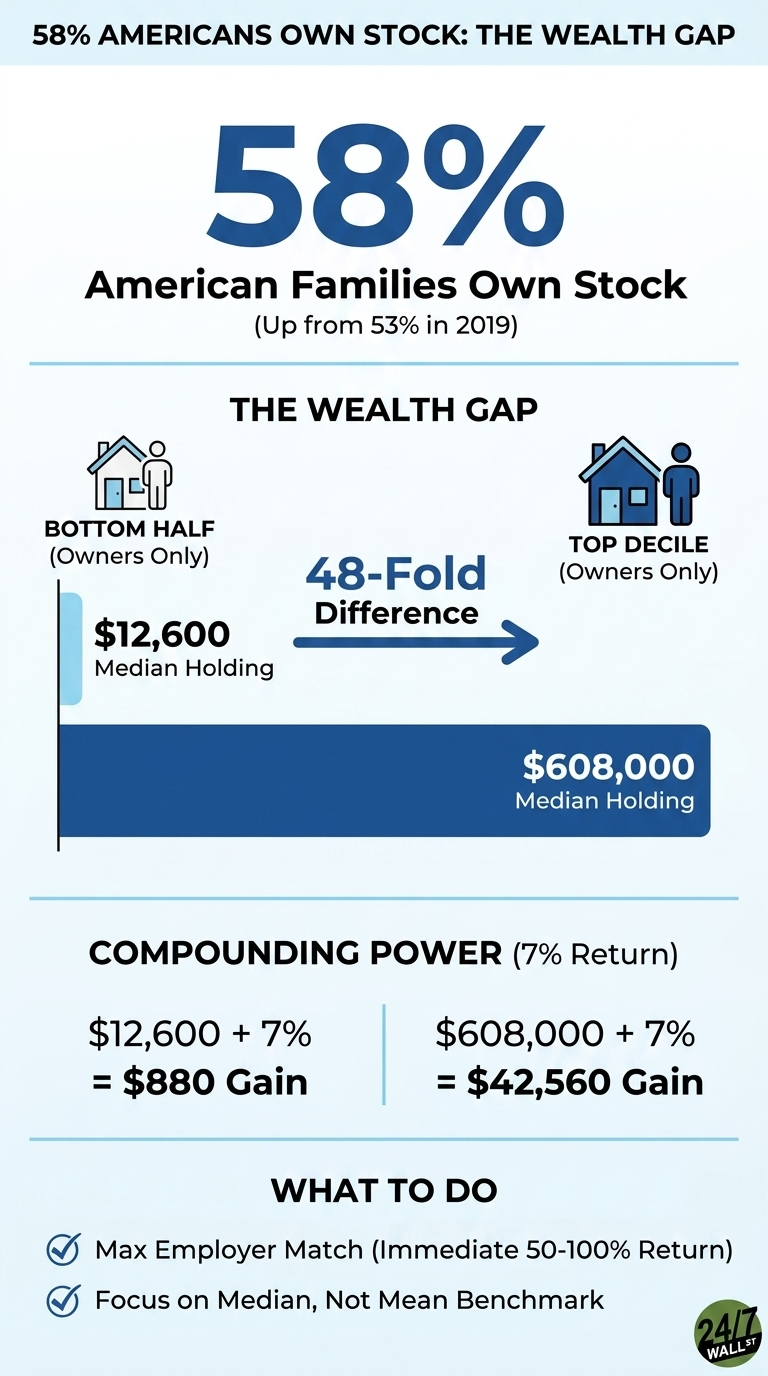
A $12,600 stock balance generates limited compounding power. Applied to a 7% real annual return, that holding adds roughly $880 of value in a strong year. A $608,000 balance at the same rate adds about $42,560. The dollar gain at the top in a single year exceeds the typical lower-income owner’s entire stock holding more than three times over. This is why broader participation has not narrowed the wealth distribution.
Housing Carries the Bottom Half
For families in the lower half of the income distribution, equity exposure is secondary. Their dominant asset is the home. Among all homeowners, the median net housing value reached $200,000 in 2022. Housing is illiquid, geographically concentrated, and leveraged through mortgage debt, which means price gains do not translate into spendable wealth unless the asset is sold, refinanced, or borrowed against. Equity portfolios held by higher-income families compound in the background and can be drawn down in retirement with far fewer frictions.
Net Worth Moved, But Not Evenly
Real median net worth across all families rose 37% between 2019 and 2022, the largest three-year jump in the survey’s modern history. The composition of that gain matters. Mean net worth in the bottom quintile of usual income fell from $132,200 to $129,700 over the same period. The largest absolute increases in both median and mean net worth landed in the upper-middle segment and the top decile, the same groups that hold the overwhelming majority of equity wealth. Stock market gains during the period flowed to the families already holding the largest portfolios.
What the SCF Data Shows About Who Benefits From Participation
Three patterns appear in the data for households measuring themselves against the benchmarks above:
- The equity share inside existing retirement accounts shapes long-run outcomes. The SCF counts indirect holdings in 401(k)s and IRAs toward the 58% participation figure, and a target-date fund weighted heavily toward bonds at a young age tends to underperform the equity benchmark that drove the top decile’s gains.
- The full employer match is the largest single-step return available to most savers. An unmatched dollar earns the market return; a matched dollar earns the market return on top of an immediate 50% to 100% gain, which has historically been the fastest path for a lower-income saver to move beyond a $12,600 conditional median.
- The median is a more representative benchmark than the mean. A $608,000 figure reflects the top decile, while the median for a given age and income band reflects what a typical household has actually reached.
The participation rate rose while ownership concentration held steady, and the SCF data shows both can be true at the same time.