24/7 Wall St. Insights
- This election cycle, Harris and Trump campaigns are focusing their resources on a handful of key swing-states, where the election will likely be decided.
- In most of the rest of the country, including Texas, the outcome of the race is effectively predetermined.
- However, Texas’s status as a red state is an oversimplification that belies a much more nuanced reality.
- Also: 2 Dividend Legends to Hold Forever
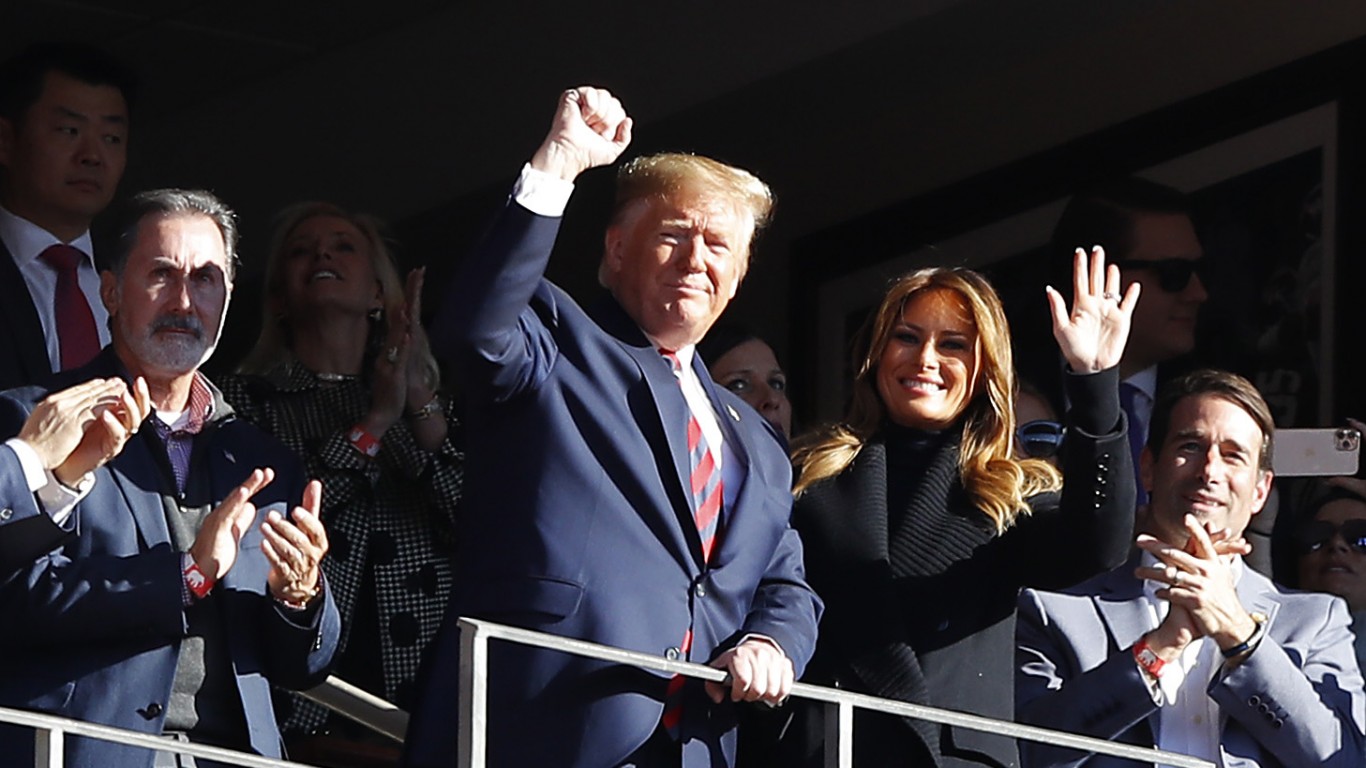
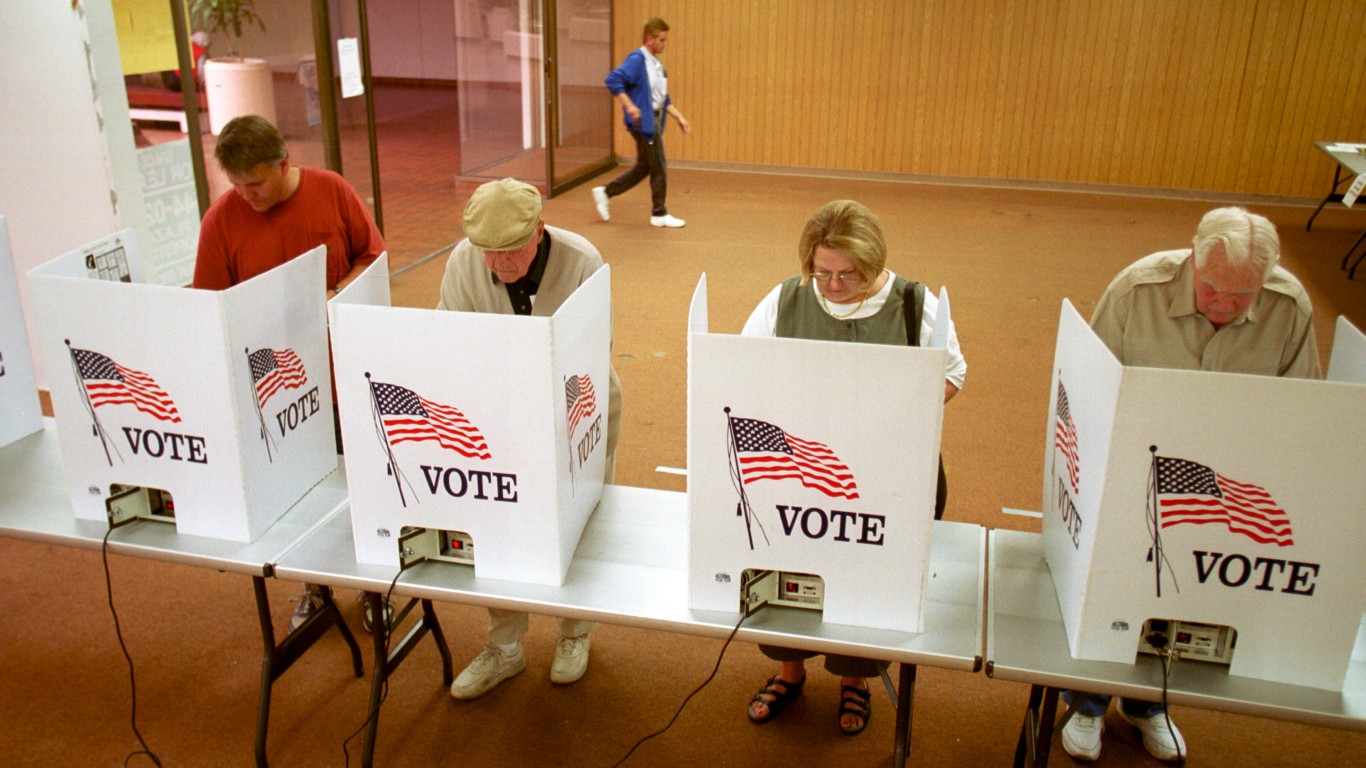
Election Day is looming, and in the wake of the first, and perhaps only, presidential debate in the 2024 race, Democrat Kamala Harris is leading Republican Donald Trump in the polls by the widest margin since the start of her campaign. According to a recent national survey conducted by Morning Consult, 51% of Americans now say they would vote for Harris if the election were today, compared to 45% who would support Trump.
However, Harris’ advantage in national polls is only a reflection of current voter sentiment, and public opinion is likely to shift in the coming weeks. Additionally, presidential races are not decided by popular vote, and this election cycle, the outcome will likely hinge on voters in a handful of closely contested swing states. In these states, which include Arizona, Georgia, North Carolina, Pennsylvania, and Wisconsin, both Trump and Harris are polling so closely that either one has a reasonable chance of winning in November. For either candidate to garner the 270 electoral votes necessary to win the White House, they will first need to persuade voters in these and other battleground states. (This is how Trump and Harris are polling in every key swing state.)
Unlike swing states — which are effectively a toss-up – a combination of polling results, the electorate’s political affiliation, and historical voting patterns show that most other states are already a virtual lock for either Trump or Harris. So-called blue states, like Massachusetts and Vermont, are places that Harris can reliably count on taking in November. Meanwhile, red states like Idaho and Wyoming are Republican strongholds that Trump will likely win handily.
Because the electoral outcome is effectively predetermined, these and other non-swing states are often characterized as political monoliths, home to populations of like-minded voters with similar values and priorities. This, however, is an oversimplification that belies a much more nuanced reality.
In Texas, long considered a red state, an average of 54.0% of voters have supported the Republican candidate across the last four presidential elections. In fact, Texas has gone to the Republican candidate in every presidential election since 1976, when Jimmy Carter, a Democrat, defeated Republican Gerald Ford. Barring any major, unforeseen shakeup, Texas is expected to align with historical voting patterns once again in 2024 and go to Trump. (Here is a look at the 15 least popular presidents, according to Millennials.)
Despite its status as a Republican stronghold, there are several parts of the state that have consistently broken with the prevailing political ideology in recent elections. According to voting records, there are 25 counties in Texas where an average of at least 50% of voters have supported the Democratic candidate across the last four presidential elections. In one of these counties, an average of 77.1% of voters cast ballots for the Democratic candidate over the same four general elections.
These are the most Democratic counties in Texas. All historical, county-level, voting statistics are from the MIT Election Data and Science Lab’s County Presidential Election Returns 2000-2020 database, as compiled in the Harvard Dataverse, V13.
Why It Matters

Because of the electoral college system, the outcome of presidential elections often comes down to voters in just a handful of closely contested states. In contrast to these battleground states, most of the country has reliably voted either Democratic or Republican in recent presidential elections. These states include Texas, which, barring any unforeseen shake ups in the race, is all but guaranteed to go to Trump in 2024. Still, Texas is not the partisan monolith it is often perceived to be.
25. Val Verde County
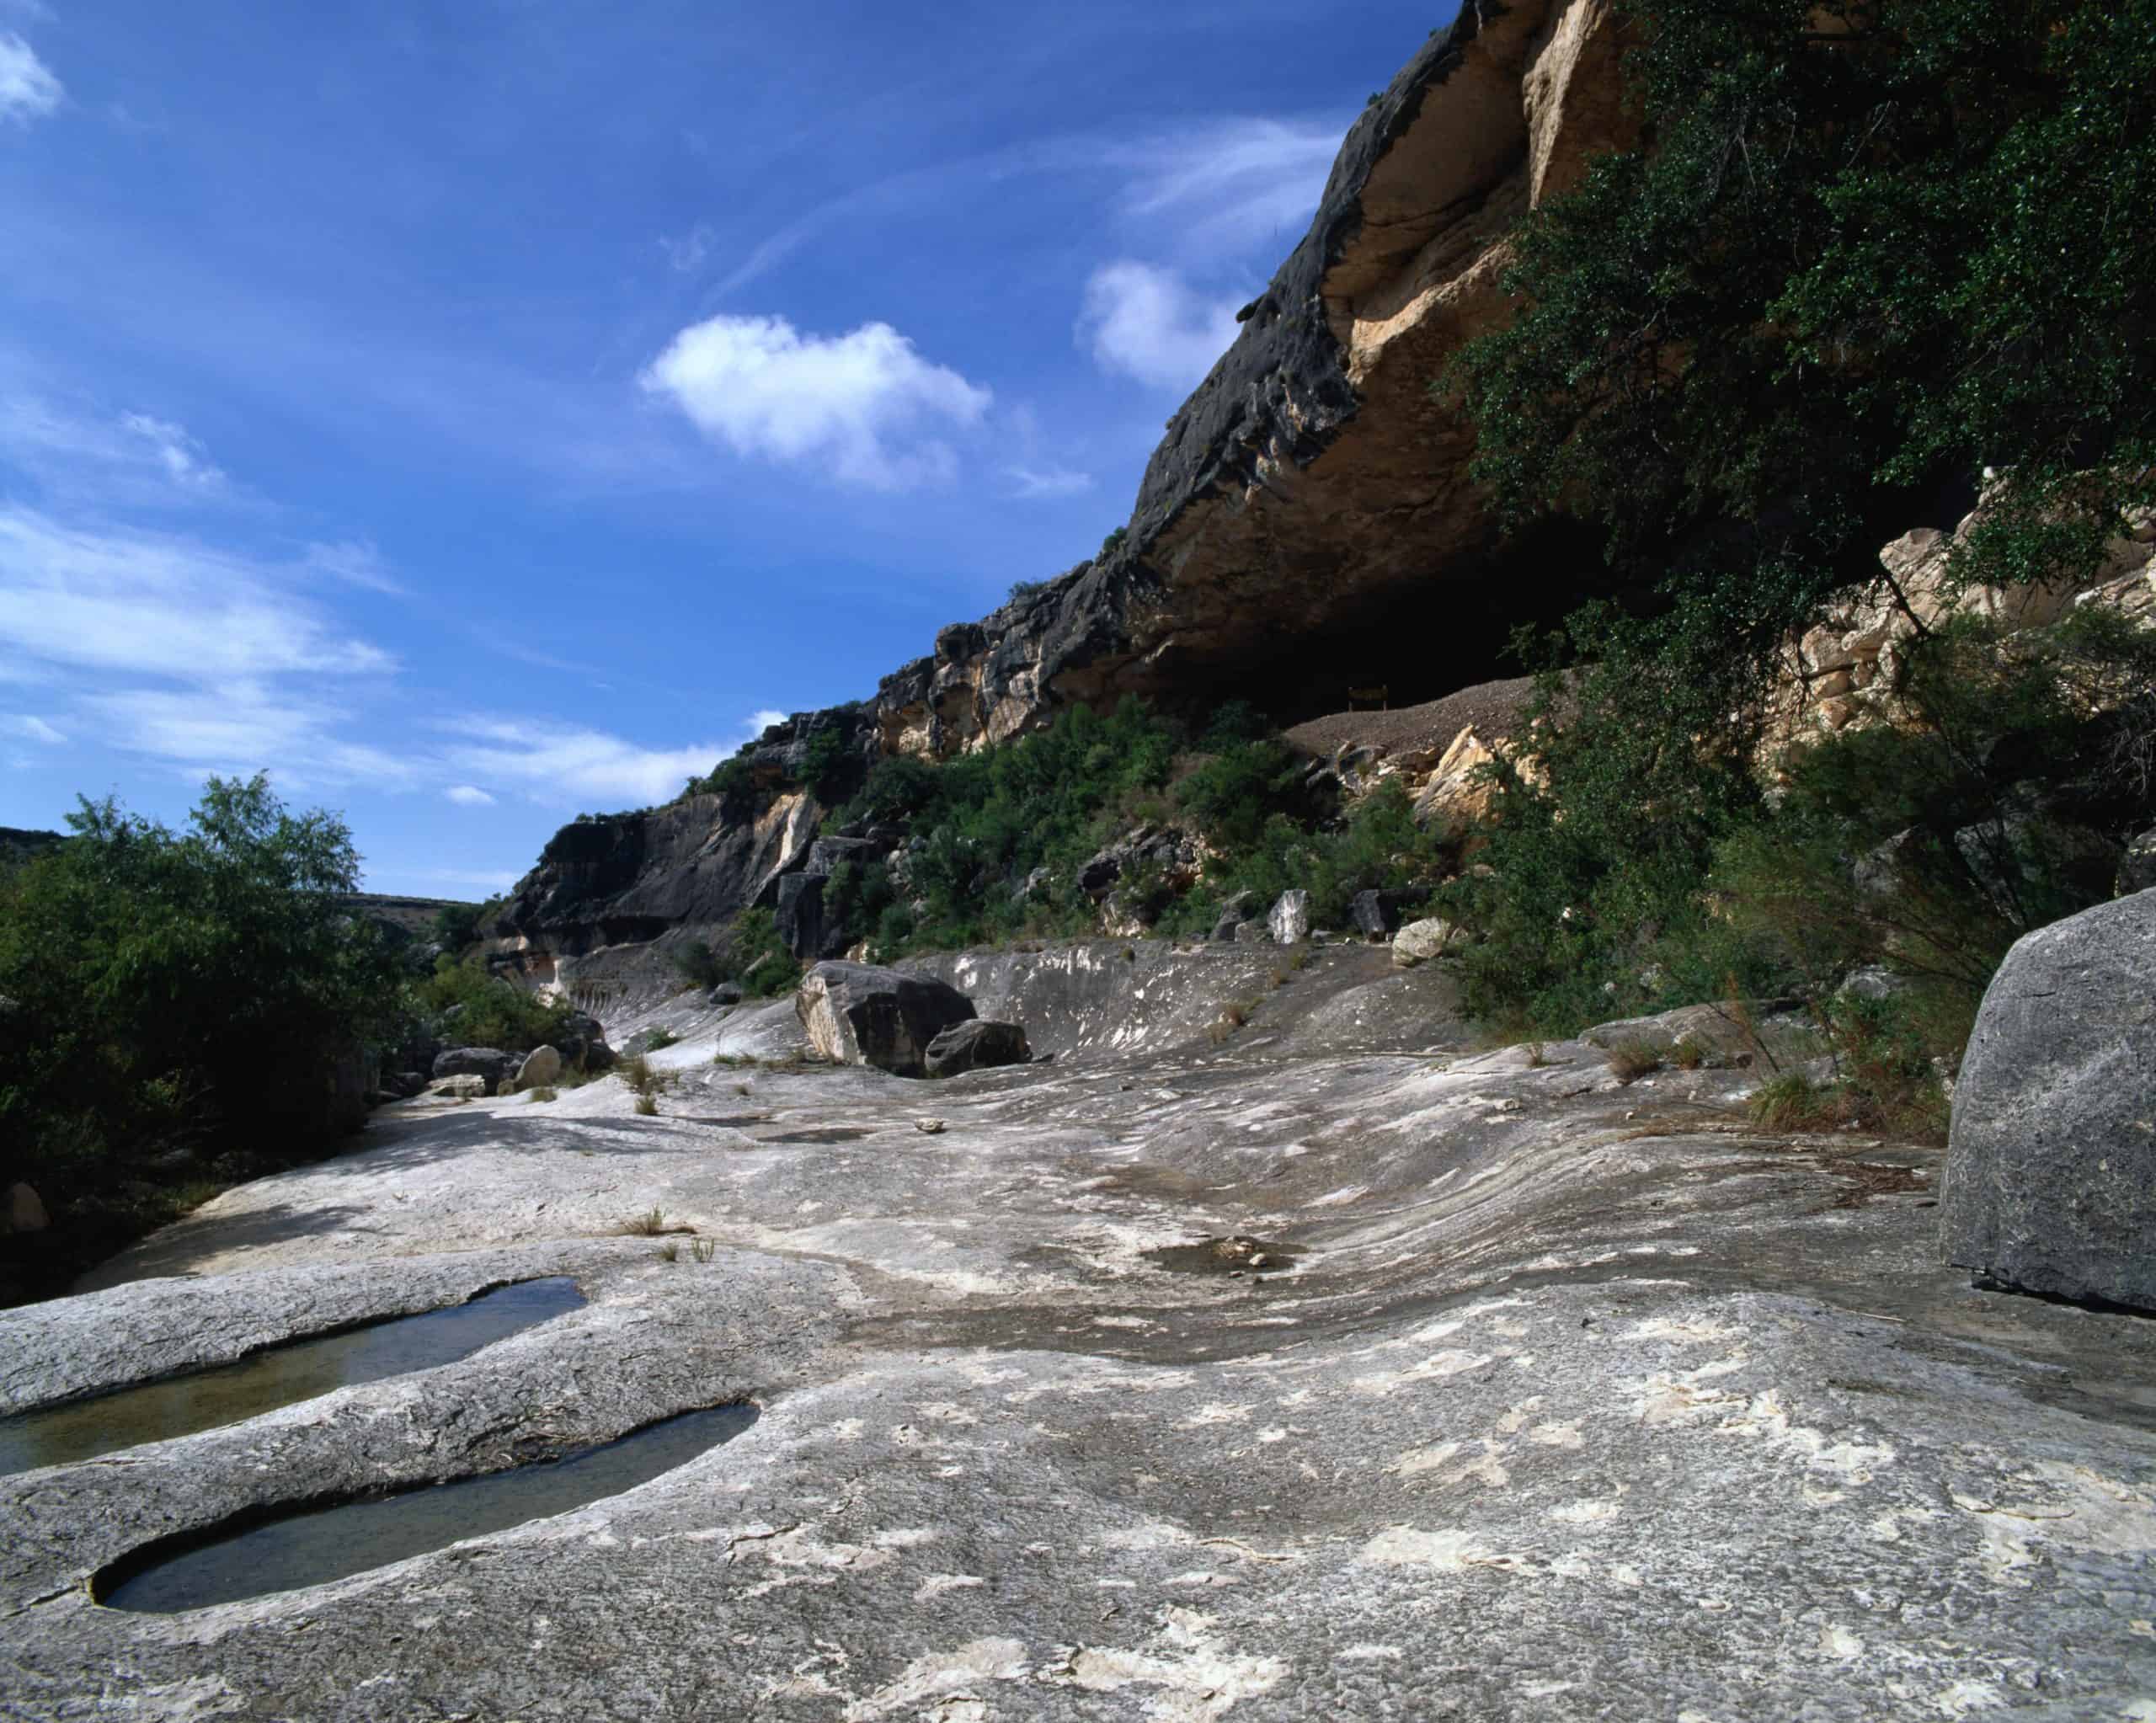
- Average popular vote split in last 4 presidential elections: 50.2% Democratic; 47.5% Republican
- Popular vote split in 2020 election: 44.3% Democrat (Joe Biden); 54.2% Republican (Donald Trump)
- Popular vote split in 2016 election: 51.1% Democrat (Hillary Clinton); 43.3% Republican (Donald Trump)
- Popular vote split in 2012 election: 52.0% Democrat (Barack Obama); 46.6% Republican (Mitt Romney)
- Popular vote split in 2008 election: 54.5% Democrat (Barack Obama); 44.9% Republican (John McCain)
- County population: 47,693
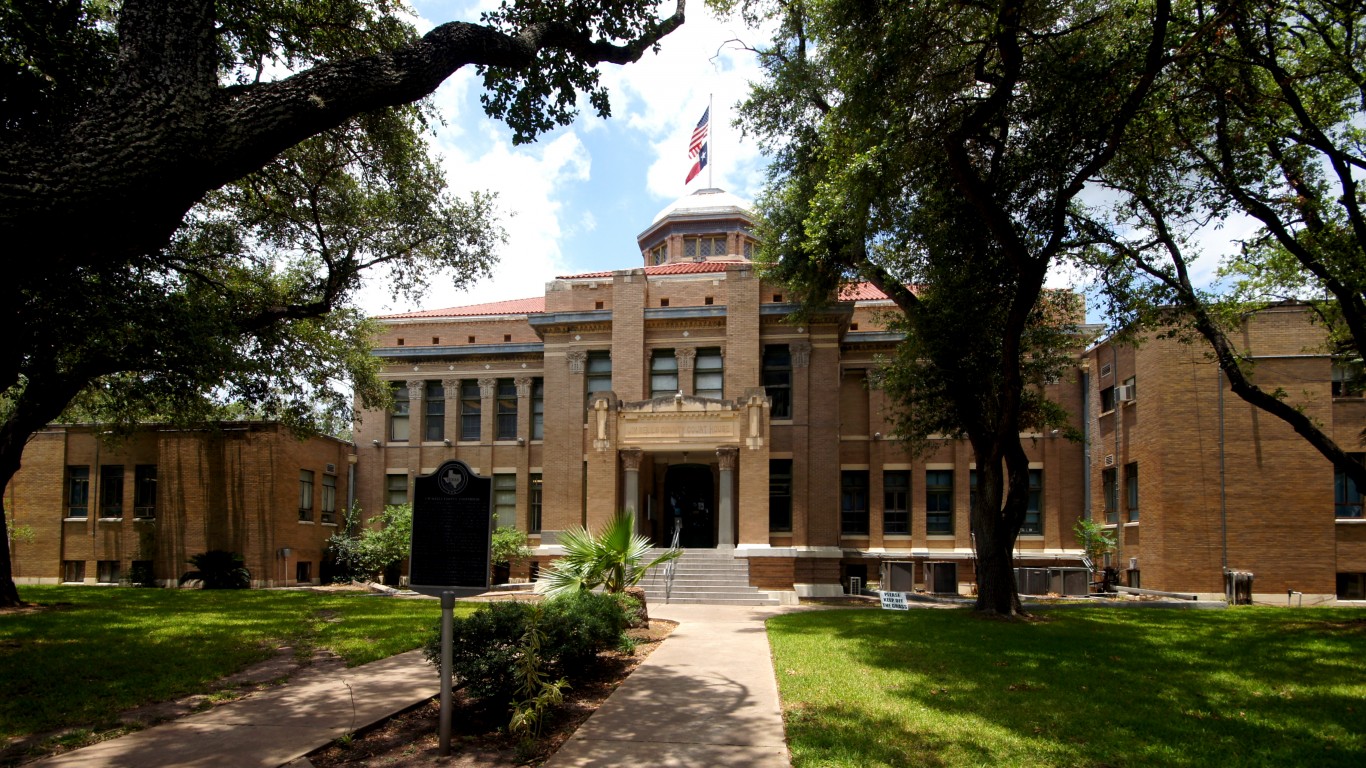
24. Fort Bend County
- Average popular vote split in last 4 presidential elections: 50.8% Democratic; 47.4% Republican
- Popular vote split in 2020 election: 54.7% Democrat (Joe Biden); 44.1% Republican (Donald Trump)
- Popular vote split in 2016 election: 51.4% Democrat (Hillary Clinton); 44.8% Republican (Donald Trump)
- Popular vote split in 2012 election: 46.1% Democrat (Barack Obama); 52.9% Republican (Mitt Romney)
- Popular vote split in 2008 election: 48.5% Democrat (Barack Obama); 50.9% Republican (John McCain)
- County population: 832,607
23. Kleberg County

- Average popular vote split in last 4 presidential elections: 51.1% Democratic; 47.1% Republican
- Popular vote split in 2020 election: 48.6% Democrat (Joe Biden); 50.3% Republican (Donald Trump)
- Popular vote split in 2016 election: 49.6% Democrat (Hillary Clinton); 45.9% Republican (Donald Trump)
- Popular vote split in 2012 election: 53.4% Democrat (Barack Obama); 45.6% Republican (Mitt Romney)
- Popular vote split in 2008 election: 53.2% Democrat (Barack Obama); 46.0% Republican (John McCain)
- County population: 30,860
22. Harris County

- Average popular vote split in last 4 presidential elections: 52.8% Democratic; 45.3% Republican
- Popular vote split in 2020 election: 56.0% Democrat (Joe Biden); 42.7% Republican (Donald Trump)
- Popular vote split in 2016 election: 54.0% Democrat (Hillary Clinton); 41.6% Republican (Donald Trump)
- Popular vote split in 2012 election: 49.4% Democrat (Barack Obama); 49.3% Republican (Mitt Romney)
- Popular vote split in 2008 election: 50.4% Democrat (Barack Obama); 48.8% Republican (John McCain)
- County population: 4,726,177
21. La Salle County
_IMG_4472.JPG#/media/File:LaSalle_County_rest_area_near_Cotulla,_TX_(revised)_IMG_4472.JPG "LaSalle County rest area near Cotulla, TX (revised) IMG 4472 by Billy Hathorn")
- Average popular vote split in last 4 presidential elections: 53.2% Democratic; 45.5% Republican
- Popular vote split in 2020 election: 43.7% Democrat (Joe Biden); 55.5% Republican (Donald Trump)
- Popular vote split in 2016 election: 54.8% Democrat (Hillary Clinton); 42.4% Republican (Donald Trump)
- Popular vote split in 2012 election: 58.6% Democrat (Barack Obama); 40.6% Republican (Mitt Romney)
- Popular vote split in 2008 election: 59.2% Democrat (Barack Obama); 40.2% Republican (John McCain)
- County population: 6,965
20. Jim Wells County
- Average popular vote split in last 4 presidential elections: 53.3% Democratic; 45.7% Republican
- Popular vote split in 2020 election: 44.8% Democrat (Joe Biden); 54.5% Republican (Donald Trump)
- Popular vote split in 2016 election: 54.1% Democrat (Hillary Clinton); 43.8% Republican (Donald Trump)
- Popular vote split in 2012 election: 58.1% Democrat (Barack Obama); 41.2% Republican (Mitt Romney)
- Popular vote split in 2008 election: 57.8% Democrat (Barack Obama); 41.7% Republican (John McCain)
- County population: 39,060
19. Frio County

- Average popular vote split in last 4 presidential elections: 54.5% Democratic; 44.5% Republican
- Popular vote split in 2020 election: 45.9% Democrat (Joe Biden); 53.5% Republican (Donald Trump)
- Popular vote split in 2016 election: 55.5% Democrat (Hillary Clinton); 42.2% Republican (Donald Trump)
- Popular vote split in 2012 election: 59.9% Democrat (Barack Obama); 39.3% Republican (Mitt Romney)
- Popular vote split in 2008 election: 59.2% Democrat (Barack Obama); 40.5% Republican (John McCain)
- County population: 18,151
18. Bexar County
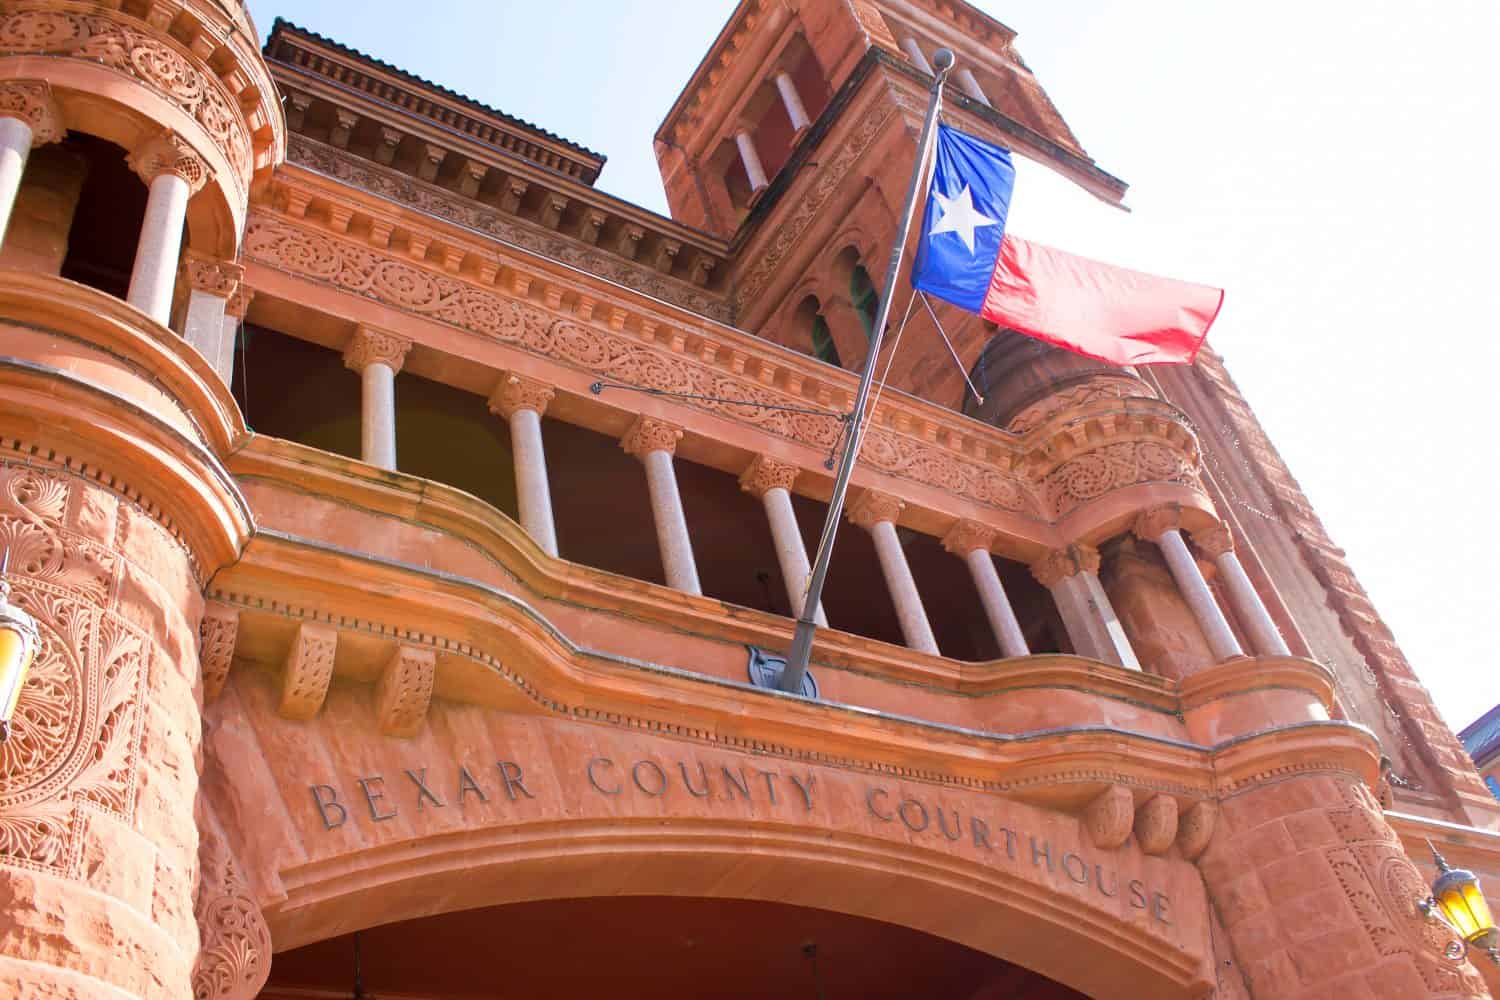
- Average popular vote split in last 4 presidential elections: 54.5% Democratic; 43.2% Republican
- Popular vote split in 2020 election: 58.2% Democrat (Joe Biden); 40.0% Republican (Donald Trump)
- Popular vote split in 2016 election: 54.2% Democrat (Hillary Clinton); 40.8% Republican (Donald Trump)
- Popular vote split in 2012 election: 51.6% Democrat (Barack Obama); 47.0% Republican (Mitt Romney)
- Popular vote split in 2008 election: 52.4% Democrat (Barack Obama); 46.8% Republican (John McCain)
- County population: 2,014,059
17. Culberson County
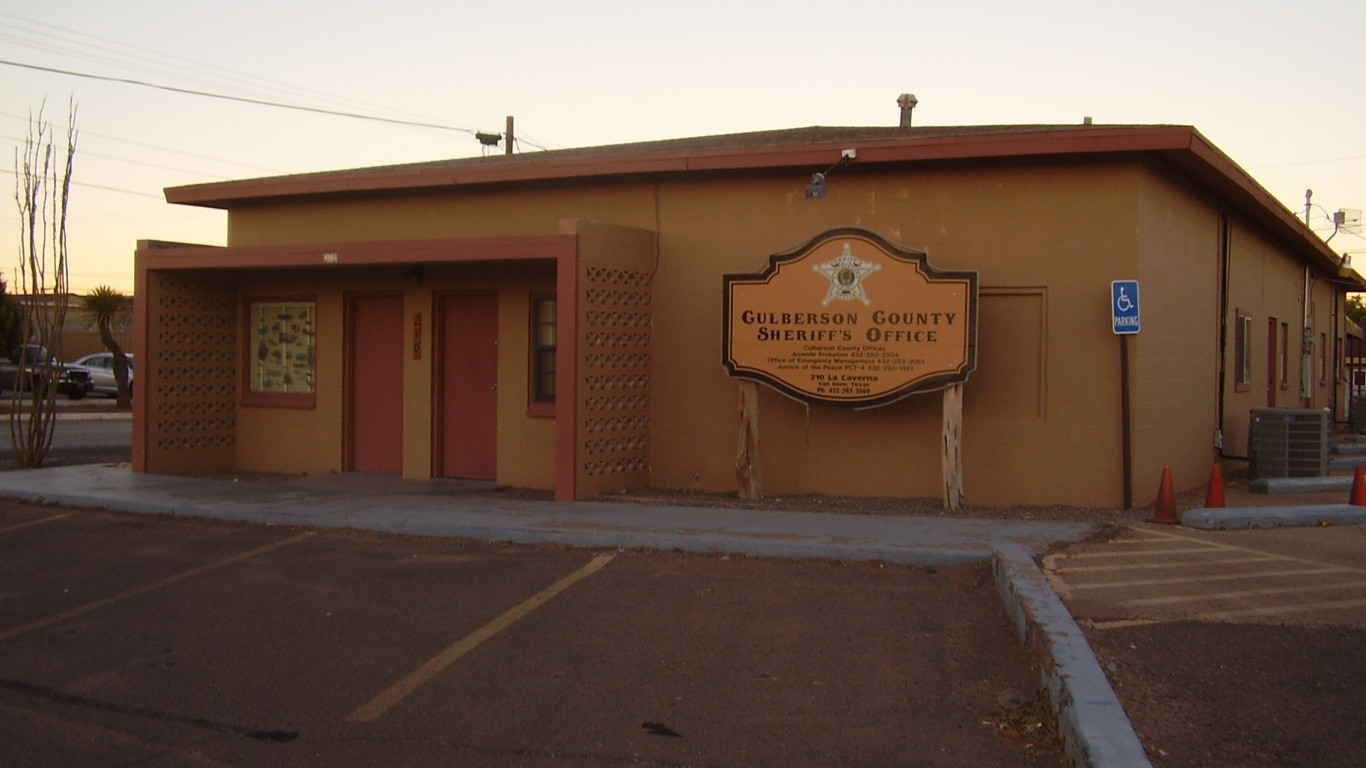
- Average popular vote split in last 4 presidential elections: 59.7% Democratic; 38.1% Republican
- Popular vote split in 2020 election: 50.7% Democrat (Joe Biden); 48.0% Republican (Donald Trump)
- Popular vote split in 2016 election: 59.2% Democrat (Hillary Clinton); 36.5% Republican (Donald Trump)
- Popular vote split in 2012 election: 64.6% Democrat (Barack Obama); 33.6% Republican (Mitt Romney)
- Popular vote split in 2008 election: 64.8% Democrat (Barack Obama); 33.9% Republican (John McCain)
- County population: 2,181
16. Dallas County

- Average popular vote split in last 4 presidential elections: 60.4% Democratic; 37.6% Republican
- Popular vote split in 2020 election: 65.1% Democrat (Joe Biden); 33.4% Republican (Donald Trump)
- Popular vote split in 2016 election: 60.8% Democrat (Hillary Clinton); 34.6% Republican (Donald Trump)
- Popular vote split in 2012 election: 57.1% Democrat (Barack Obama); 41.7% Republican (Mitt Romney)
- Popular vote split in 2008 election: 57.3% Democrat (Barack Obama); 42.0% Republican (John McCain)
- County population: 2,604,053
15. Cameron County
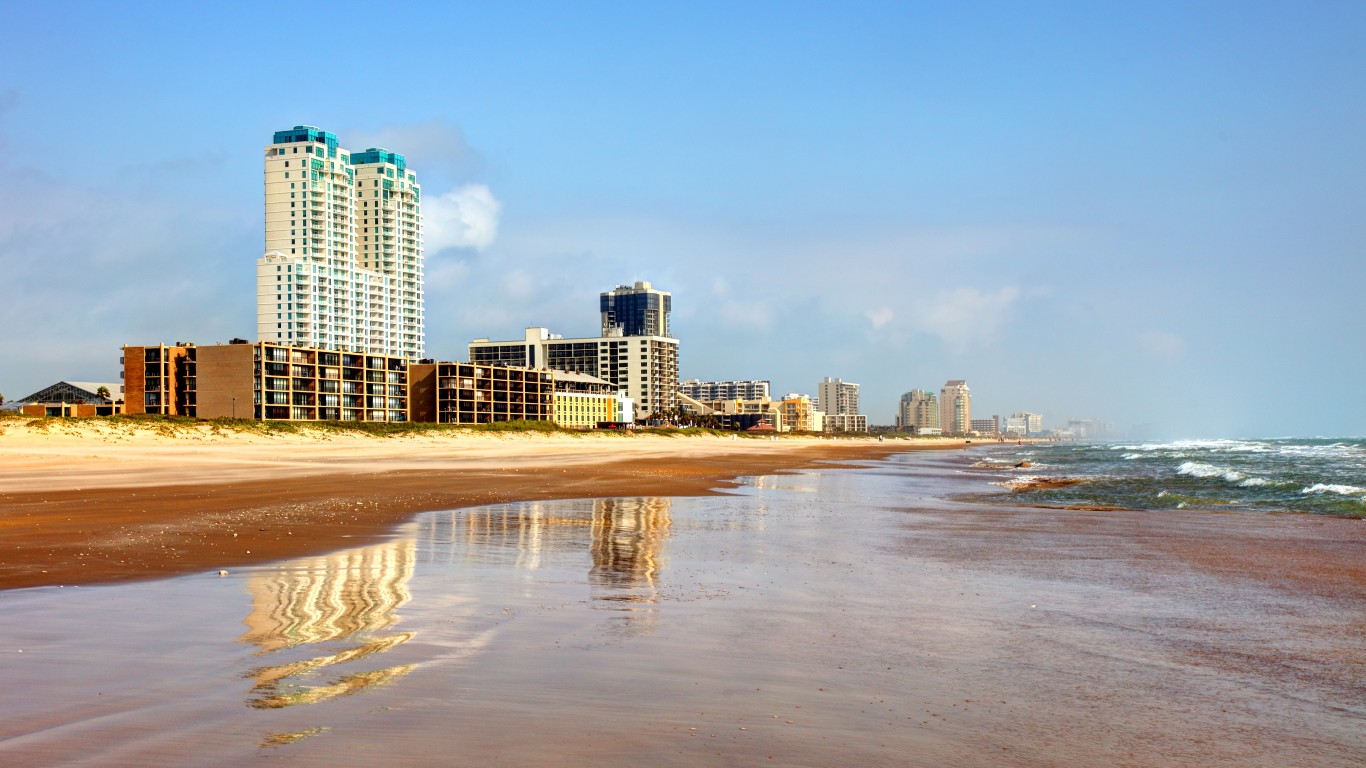
- Average popular vote split in last 4 presidential elections: 61.8% Democratic; 36.6% Republican
- Popular vote split in 2020 election: 56.1% Democrat (Joe Biden); 42.9% Republican (Donald Trump)
- Popular vote split in 2016 election: 64.5% Democrat (Hillary Clinton); 32.0% Republican (Donald Trump)
- Popular vote split in 2012 election: 65.0% Democrat (Barack Obama); 33.9% Republican (Mitt Romney)
- Popular vote split in 2008 election: 64.1% Democrat (Barack Obama); 35.3% Republican (John McCain)
- County population: 421,854
14. Zapata County
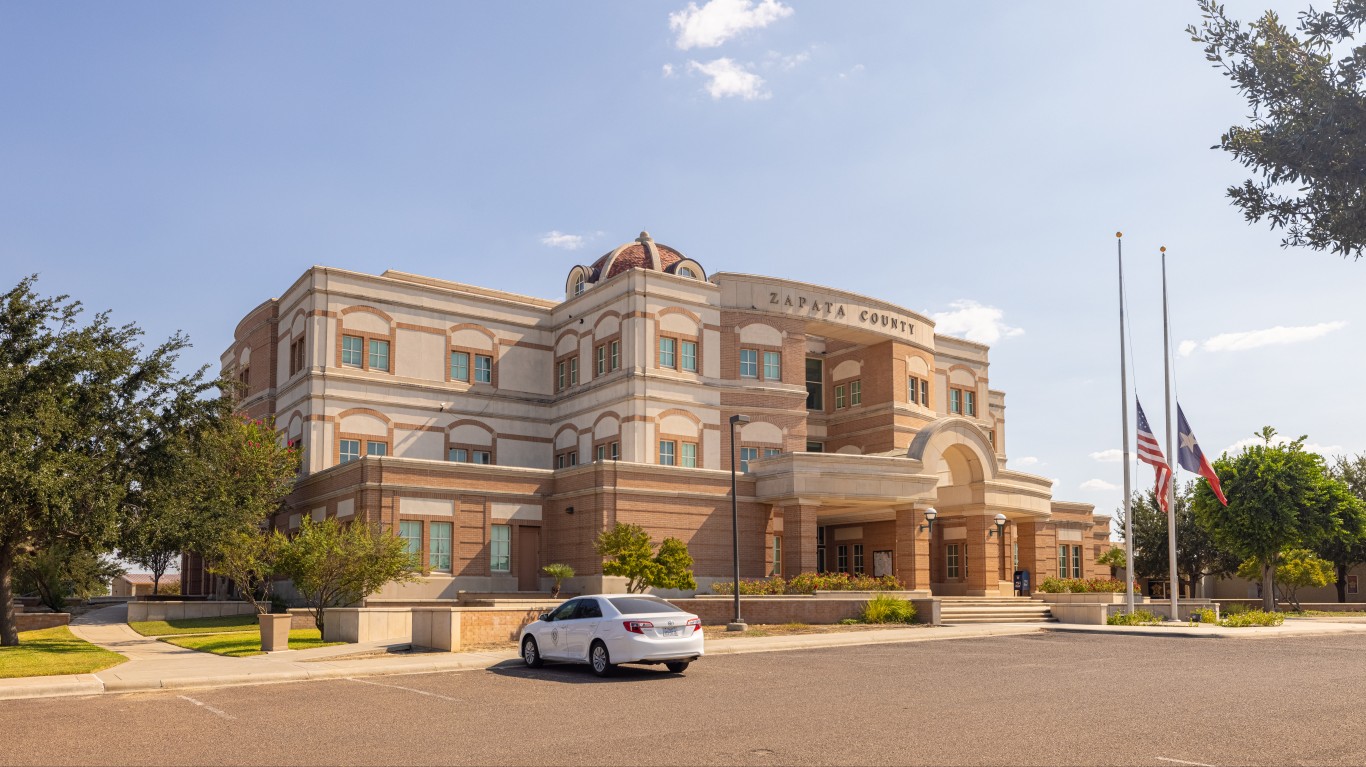
- Average popular vote split in last 4 presidential elections: 62.2% Democratic; 37.1% Republican
- Popular vote split in 2020 election: 47.1% Democrat (Joe Biden); 52.5% Republican (Donald Trump)
- Popular vote split in 2016 election: 65.7% Democrat (Hillary Clinton); 32.7% Republican (Donald Trump)
- Popular vote split in 2012 election: 71.3% Democrat (Barack Obama); 28.1% Republican (Mitt Romney)
- Popular vote split in 2008 election: 67.7% Democrat (Barack Obama); 32.1% Republican (John McCain)
- County population: 13,896
13. Hidalgo County
- Average popular vote split in last 4 presidential elections: 65.5% Democratic; 32.9% Republican
- Popular vote split in 2020 election: 58.0% Democrat (Joe Biden); 41.0% Republican (Donald Trump)
- Popular vote split in 2016 election: 68.5% Democrat (Hillary Clinton); 28.0% Republican (Donald Trump)
- Popular vote split in 2012 election: 70.4% Democrat (Barack Obama); 28.6% Republican (Mitt Romney)
- Popular vote split in 2008 election: 69.0% Democrat (Barack Obama); 30.3% Republican (John McCain)
- County population: 873,167
12. Willacy County
- Average popular vote split in last 4 presidential elections: 65.7% Democratic; 33.3% Republican
- Popular vote split in 2020 election: 56.0% Democrat (Joe Biden); 44.0% Republican (Donald Trump)
- Popular vote split in 2016 election: 67.2% Democrat (Hillary Clinton); 30.4% Republican (Donald Trump)
- Popular vote split in 2012 election: 71.1% Democrat (Barack Obama); 28.0% Republican (Mitt Romney)
- Popular vote split in 2008 election: 69.5% Democrat (Barack Obama); 29.7% Republican (John McCain)
- County population: 20,308
11. Travis County
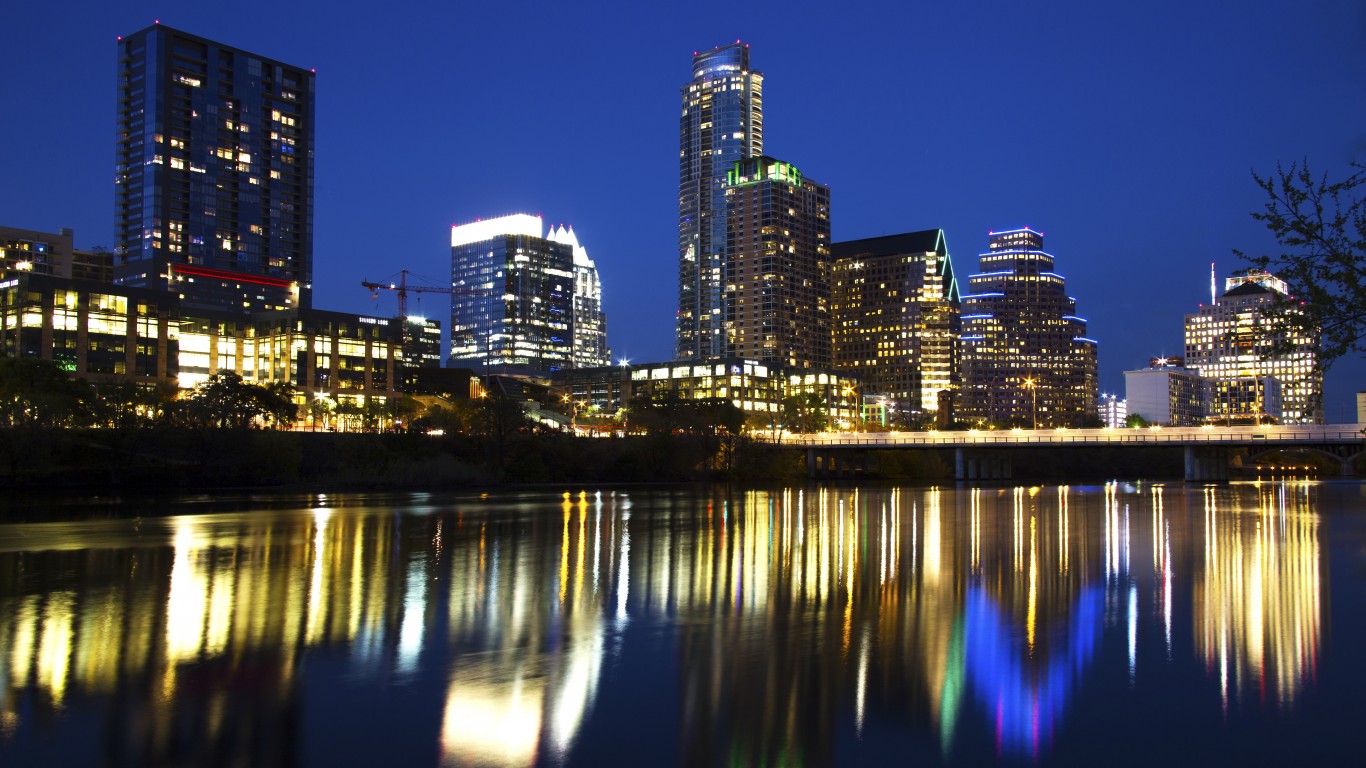
- Average popular vote split in last 4 presidential elections: 66.1% Democratic; 30.4% Republican
- Popular vote split in 2020 election: 71.6% Democrat (Joe Biden); 26.5% Republican (Donald Trump)
- Popular vote split in 2016 election: 65.8% Democrat (Hillary Clinton); 27.1% Republican (Donald Trump)
- Popular vote split in 2012 election: 60.1% Democrat (Barack Obama); 36.2% Republican (Mitt Romney)
- Popular vote split in 2008 election: 63.9% Democrat (Barack Obama); 34.4% Republican (John McCain)
- County population: 1,289,054
10. Duval County

- Average popular vote split in last 4 presidential elections: 66.7% Democratic; 32.4% Republican
- Popular vote split in 2020 election: 51.0% Democrat (Joe Biden); 48.3% Republican (Donald Trump)
- Popular vote split in 2016 election: 66.8% Democrat (Hillary Clinton); 31.6% Republican (Donald Trump)
- Popular vote split in 2012 election: 76.7% Democrat (Barack Obama); 22.6% Republican (Mitt Romney)
- Popular vote split in 2008 election: 74.8% Democrat (Barack Obama); 24.4% Republican (John McCain)
- County population: 9,960
9. El Paso County

- Average popular vote split in last 4 presidential elections: 66.9% Democratic; 30.9% Republican
- Popular vote split in 2020 election: 66.8% Democrat (Joe Biden); 31.6% Republican (Donald Trump)
- Popular vote split in 2016 election: 69.1% Democrat (Hillary Clinton); 25.9% Republican (Donald Trump)
- Popular vote split in 2012 election: 65.5% Democrat (Barack Obama); 33.1% Republican (Mitt Romney)
- Popular vote split in 2008 election: 65.9% Democrat (Barack Obama); 33.4% Republican (John McCain)
- County population: 863,832
8. Presidio County

- Average popular vote split in last 4 presidential elections: 68.2% Democratic; 29.6% Republican
- Popular vote split in 2020 election: 66.0% Democrat (Joe Biden); 32.5% Republican (Donald Trump)
- Popular vote split in 2016 election: 66.0% Democrat (Hillary Clinton); 29.5% Republican (Donald Trump)
- Popular vote split in 2012 election: 70.6% Democrat (Barack Obama); 27.7% Republican (Mitt Romney)
- Popular vote split in 2008 election: 71.3% Democrat (Barack Obama); 27.8% Republican (John McCain)
- County population: 6,168
7. Dimmit County
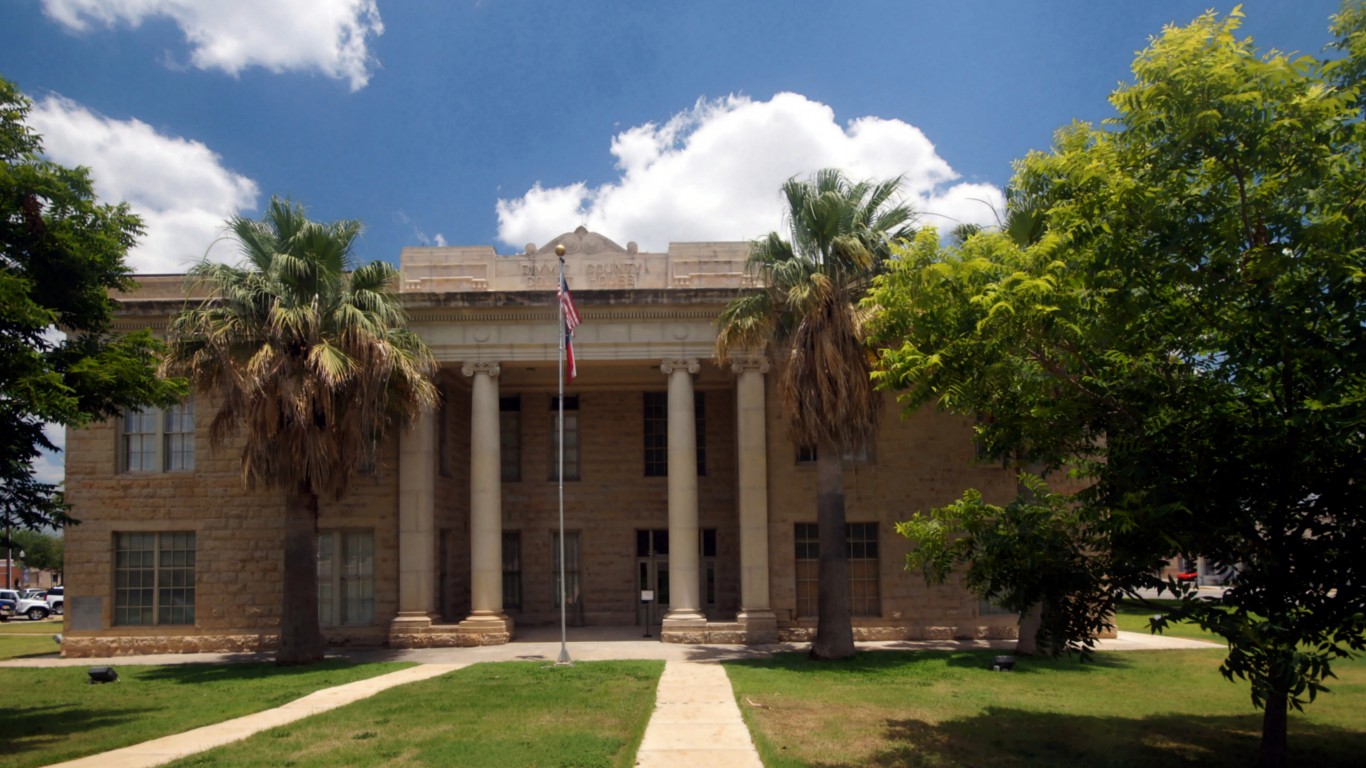
- Average popular vote split in last 4 presidential elections: 69.2% Democratic; 29.8% Republican
- Popular vote split in 2020 election: 61.8% Democrat (Joe Biden); 37.8% Republican (Donald Trump)
- Popular vote split in 2016 election: 67.4% Democrat (Hillary Clinton); 30.2% Republican (Donald Trump)
- Popular vote split in 2012 election: 73.4% Democrat (Barack Obama); 26.1% Republican (Mitt Romney)
- Popular vote split in 2008 election: 75.0% Democrat (Barack Obama); 24.4% Republican (John McCain)
- County population: 8,672
6. Webb County
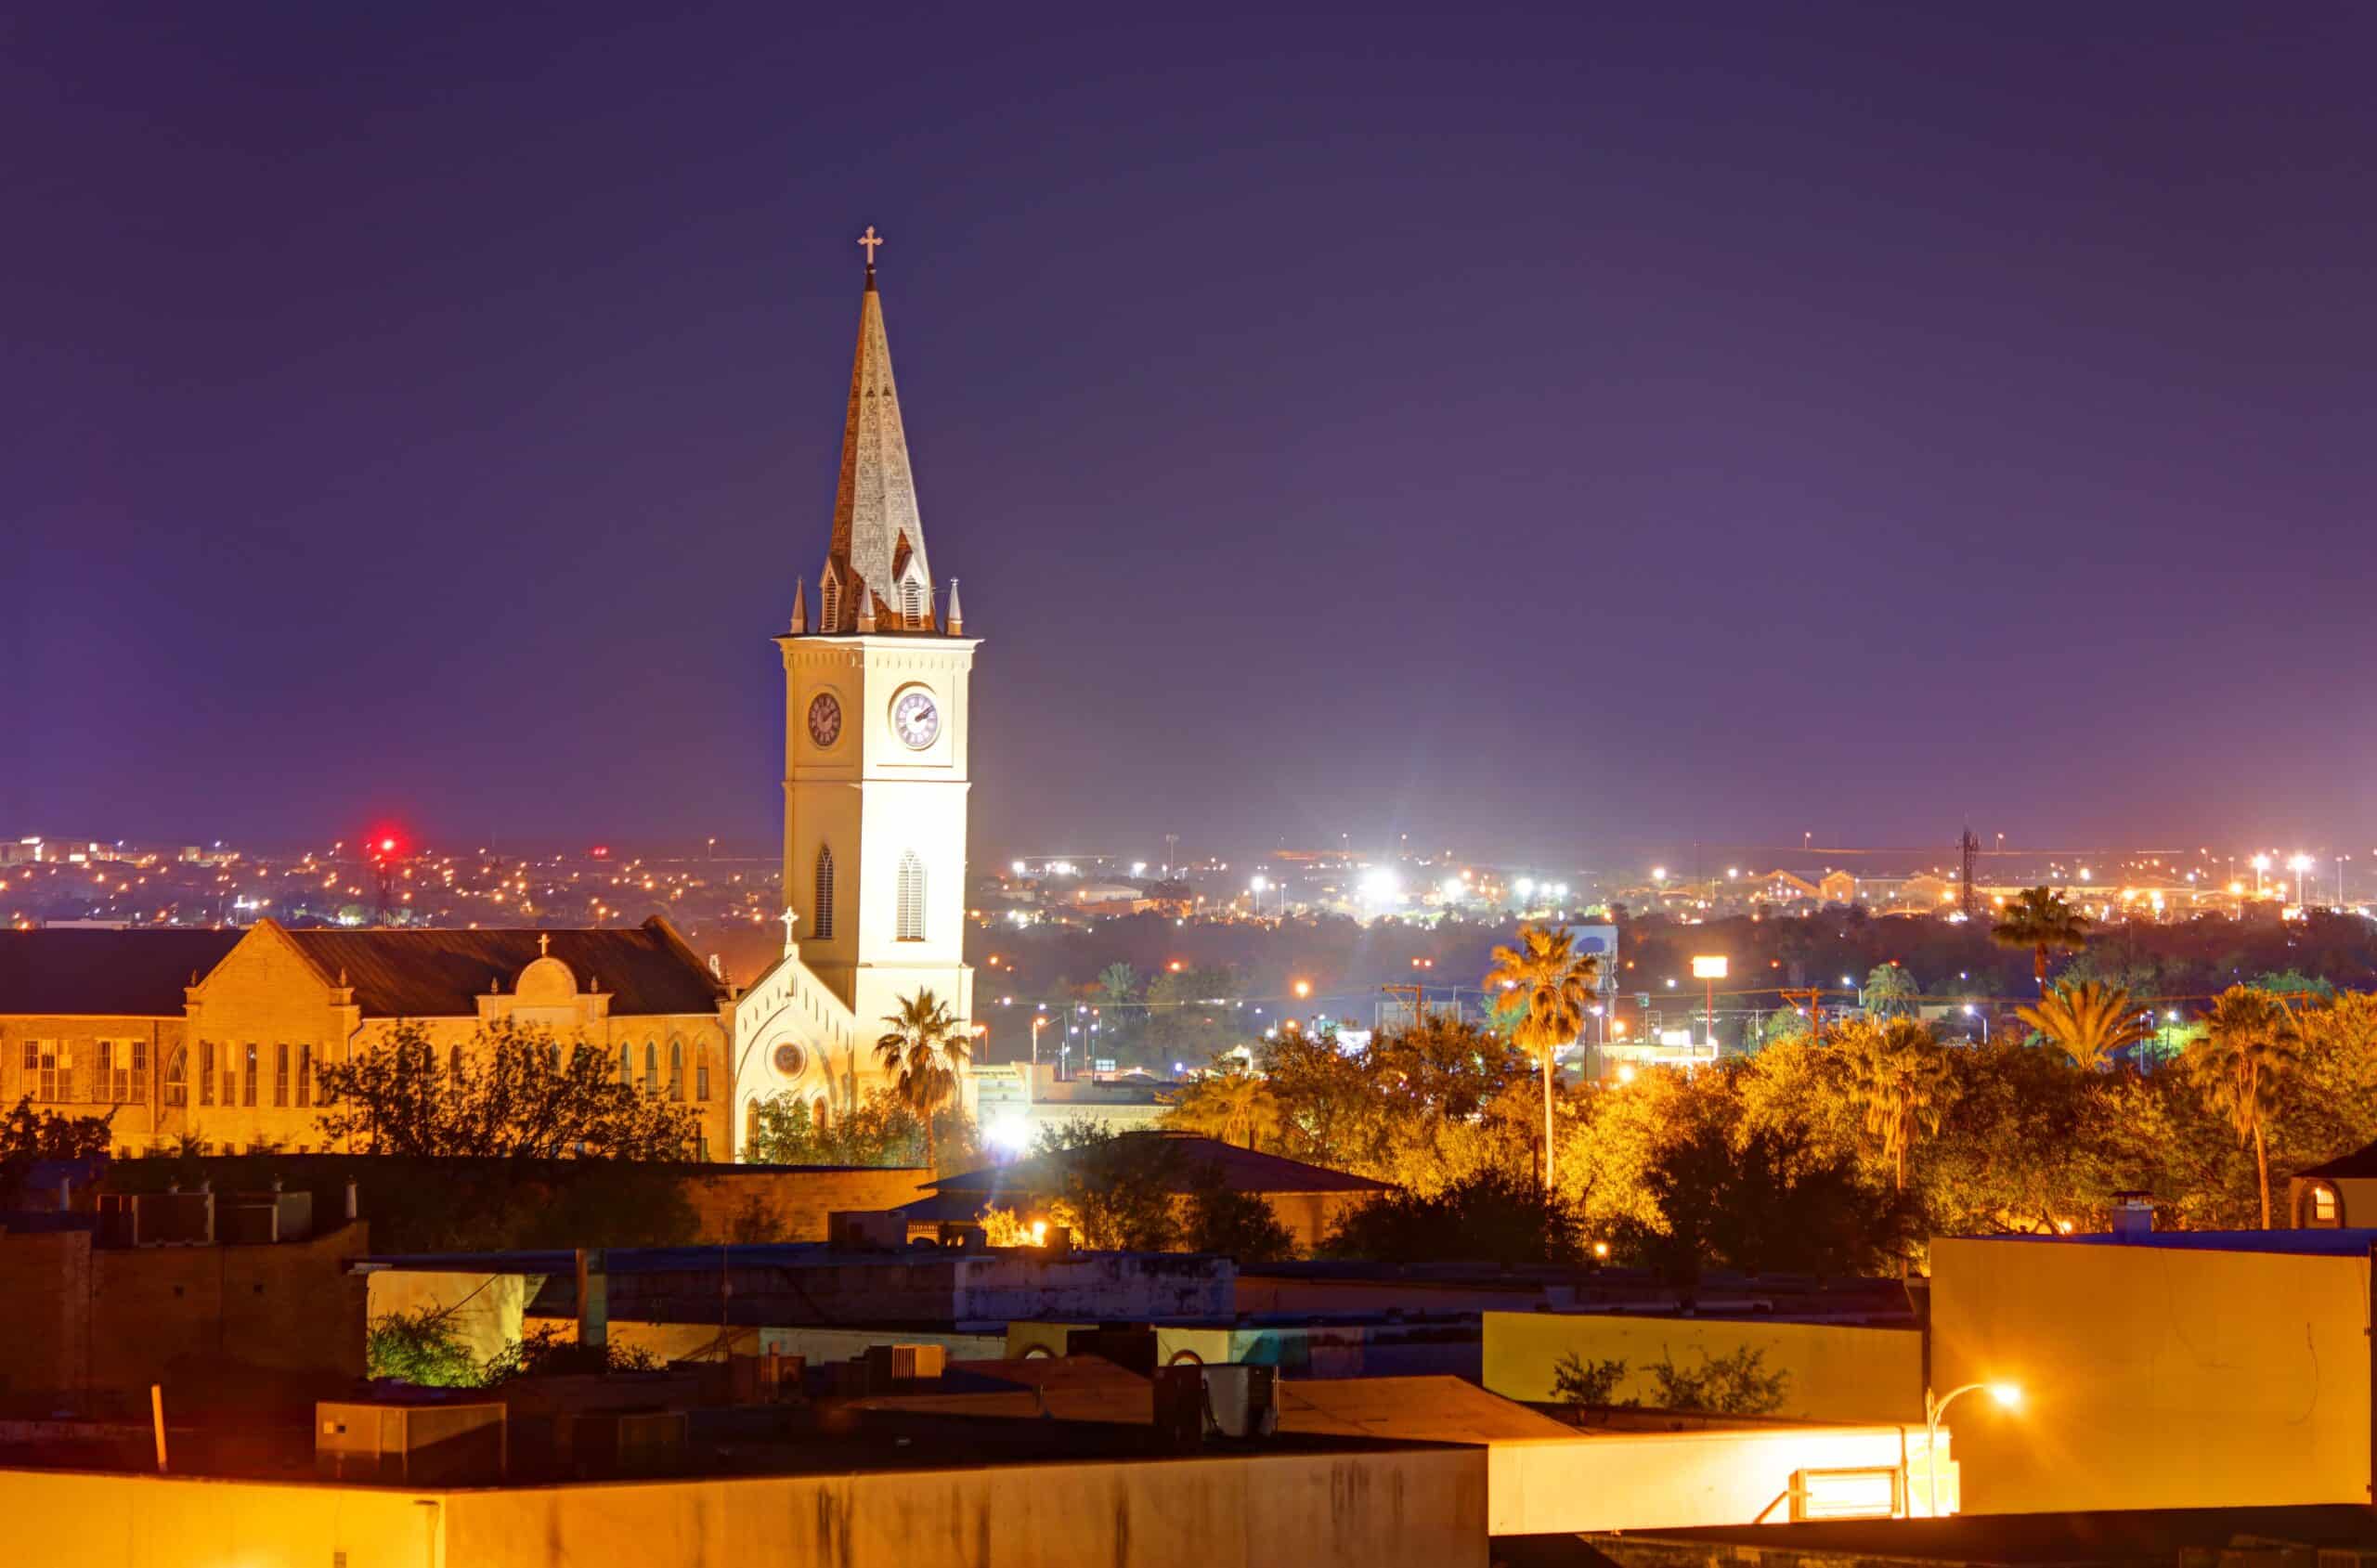
- Average popular vote split in last 4 presidential elections: 70.1% Democratic; 28.5% Republican
- Popular vote split in 2020 election: 61.1% Democrat (Joe Biden); 37.9% Republican (Donald Trump)
- Popular vote split in 2016 election: 74.3% Democrat (Hillary Clinton); 22.8% Republican (Donald Trump)
- Popular vote split in 2012 election: 76.6% Democrat (Barack Obama); 22.6% Republican (Mitt Romney)
- Popular vote split in 2008 election: 71.4% Democrat (Barack Obama); 28.0% Republican (John McCain)
- County population: 267,282
5. Maverick County
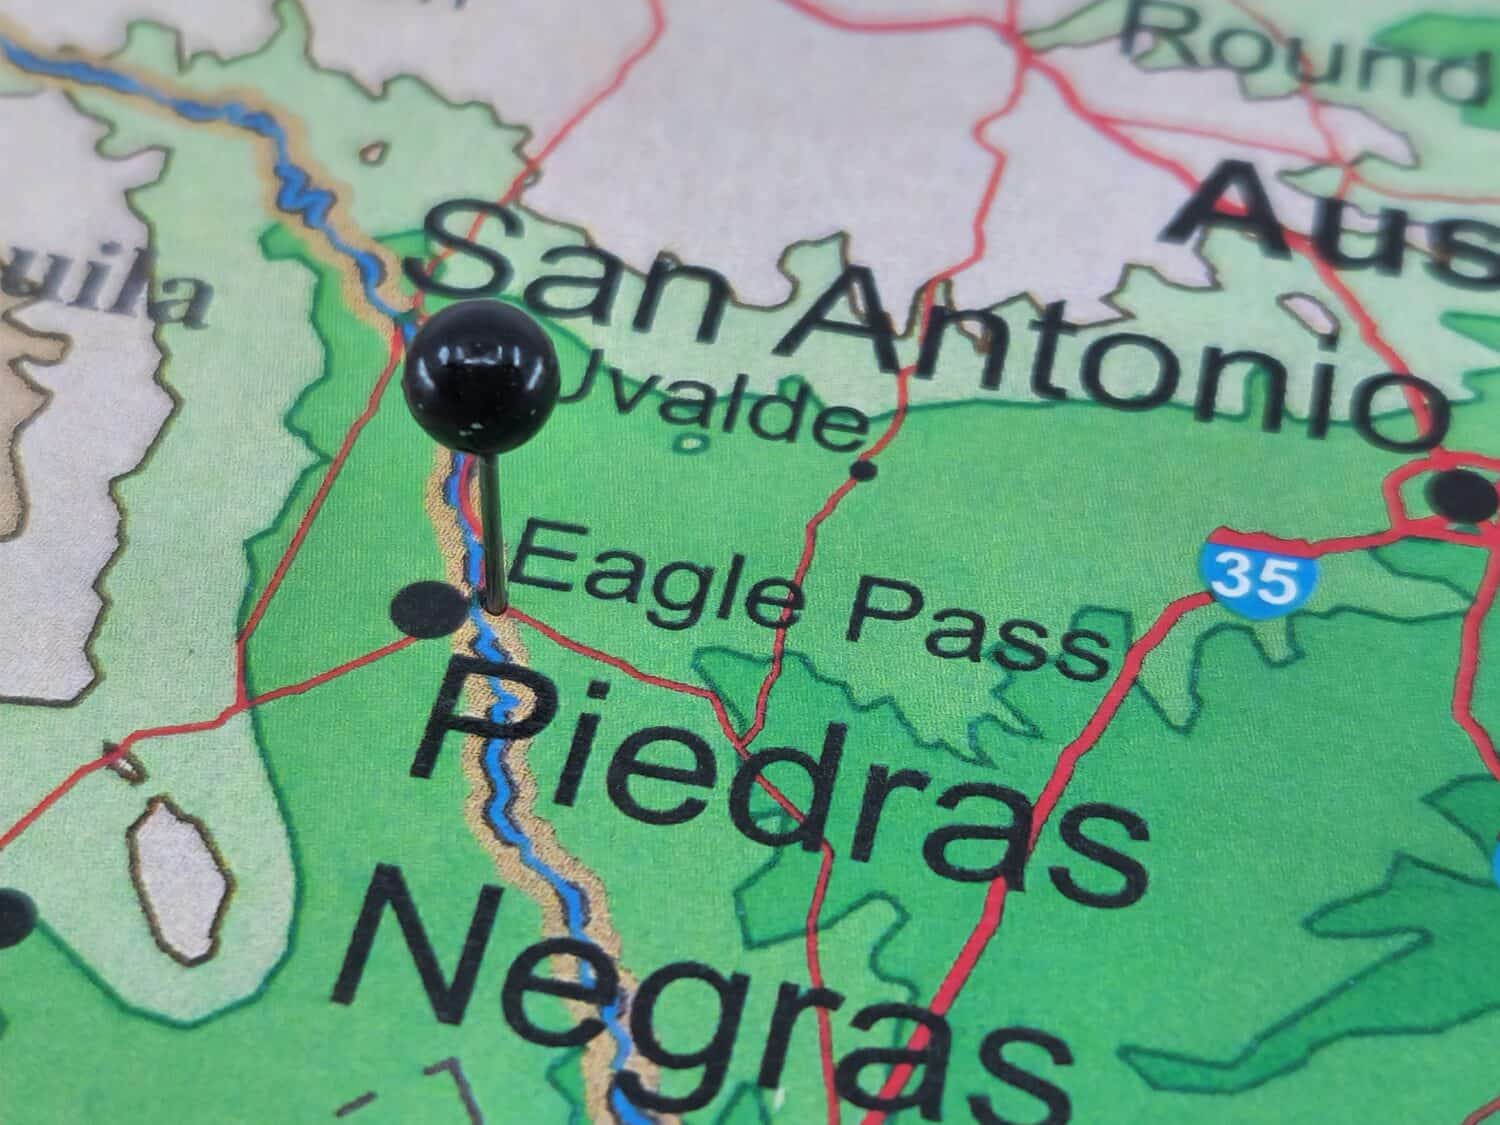
- Average popular vote split in last 4 presidential elections: 70.6% Democratic; 28.1% Republican
- Popular vote split in 2020 election: 54.3% Democrat (Joe Biden); 44.8% Republican (Donald Trump)
- Popular vote split in 2016 election: 76.5% Democrat (Hillary Clinton); 20.7% Republican (Donald Trump)
- Popular vote split in 2012 election: 78.6% Democrat (Barack Obama); 20.6% Republican (Mitt Romney)
- Popular vote split in 2008 election: 78.2% Democrat (Barack Obama); 21.2% Republican (John McCain)
- County population: 57,806
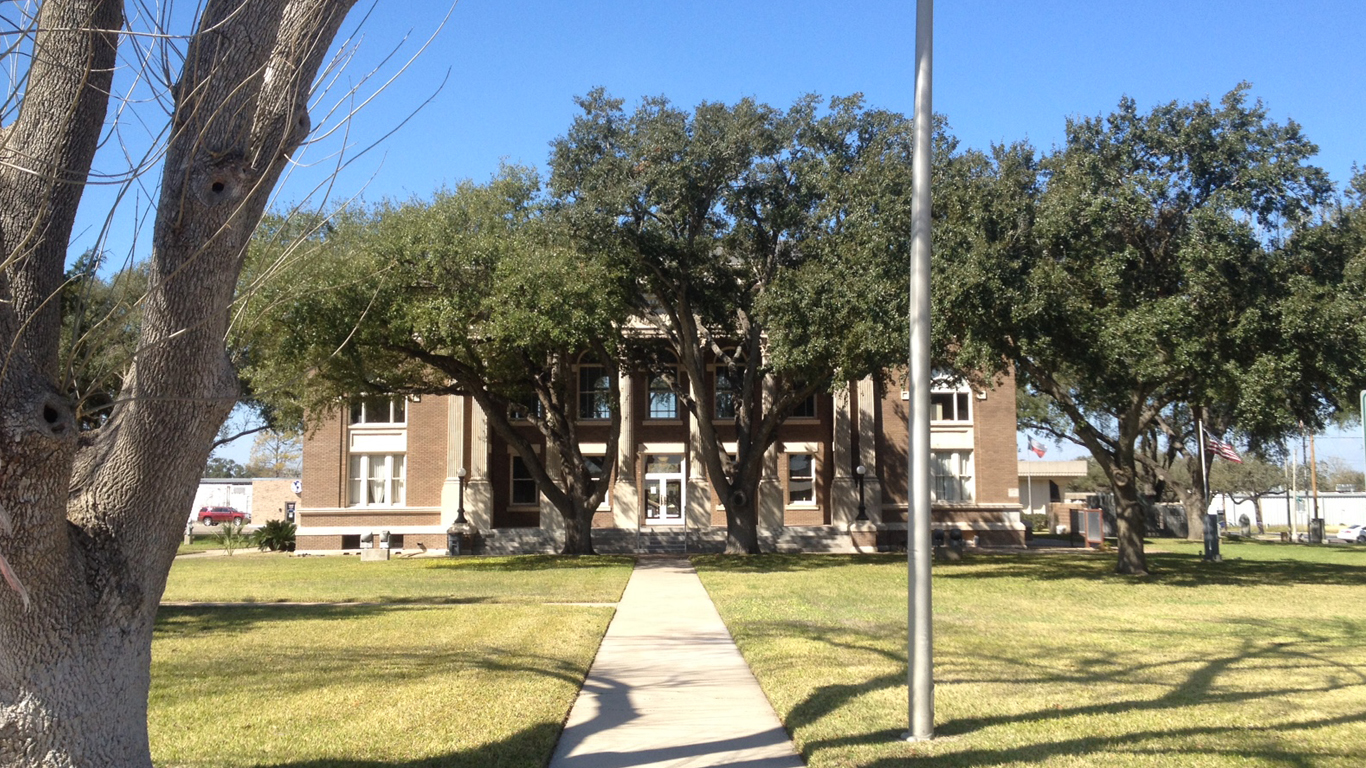
4. Jim Hogg County

- Average popular vote split in last 4 presidential elections: 71.6% Democratic; 27.4% Republican
- Popular vote split in 2020 election: 58.8% Democrat (Joe Biden); 40.9% Republican (Donald Trump)
- Popular vote split in 2016 election: 77.2% Democrat (Hillary Clinton); 20.3% Republican (Donald Trump)
- Popular vote split in 2012 election: 78.0% Democrat (Barack Obama); 21.4% Republican (Mitt Romney)
- Popular vote split in 2008 election: 73.6% Democrat (Barack Obama); 26.0% Republican (John McCain)
- County population: 4,830
3. Brooks County
- Average popular vote split in last 4 presidential elections: 71.9% Democratic; 27.3% Republican
- Popular vote split in 2020 election: 59.2% Democrat (Joe Biden); 40.2% Republican (Donald Trump)
- Popular vote split in 2016 election: 74.6% Democrat (Hillary Clinton); 23.6% Republican (Donald Trump)
- Popular vote split in 2012 election: 78.5% Democrat (Barack Obama); 21.1% Republican (Mitt Romney)
- Popular vote split in 2008 election: 75.7% Democrat (Barack Obama); 24.1% Republican (John McCain)
- County population: 7,059
2. Starr County
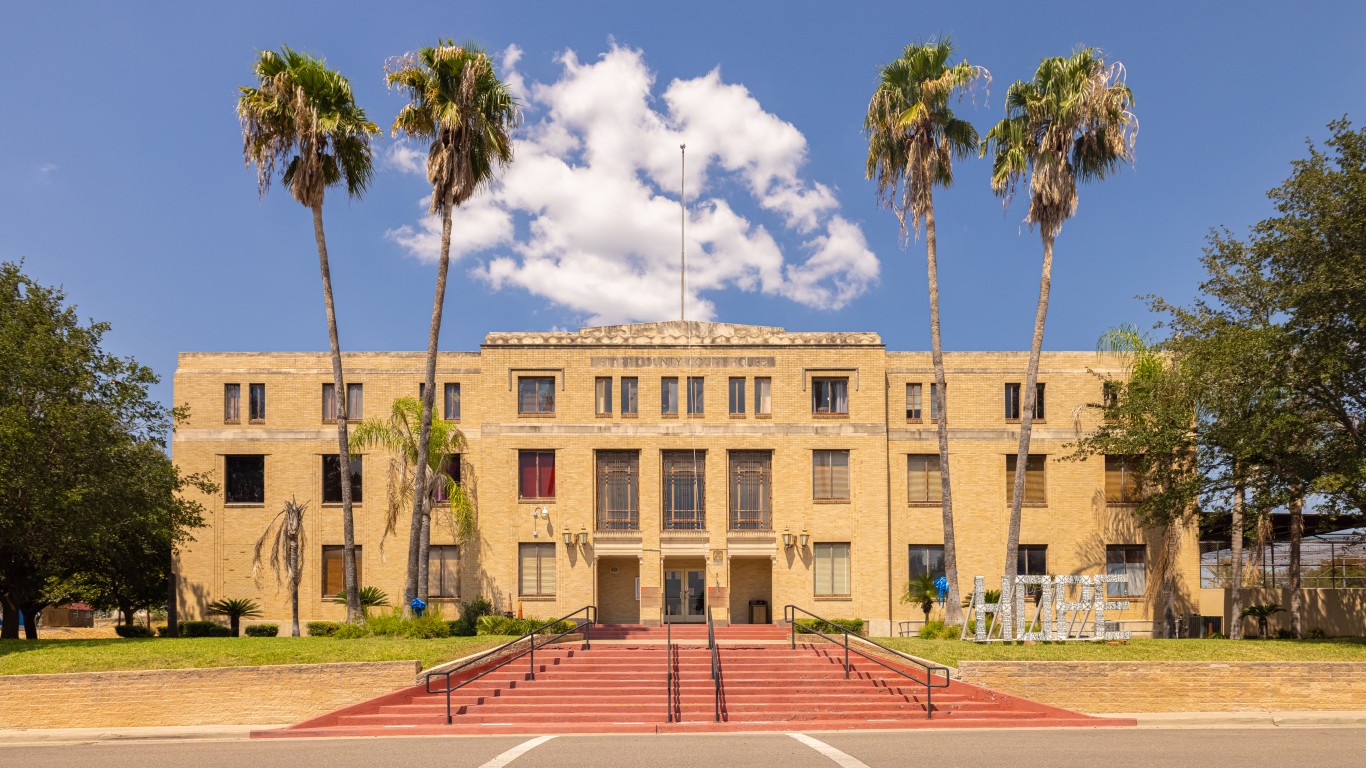
- Average popular vote split in last 4 presidential elections: 72.5% Democratic; 26.5% Republican
- Popular vote split in 2020 election: 52.1% Democrat (Joe Biden); 47.1% Republican (Donald Trump)
- Popular vote split in 2016 election: 79.1% Democrat (Hillary Clinton); 18.9% Republican (Donald Trump)
- Popular vote split in 2012 election: 86.3% Democrat (Barack Obama); 13.0% Republican (Mitt Romney)
- Popular vote split in 2008 election: 84.5% Democrat (Barack Obama); 15.2% Republican (John McCain)
- County population: 65,716
1. Zavala County
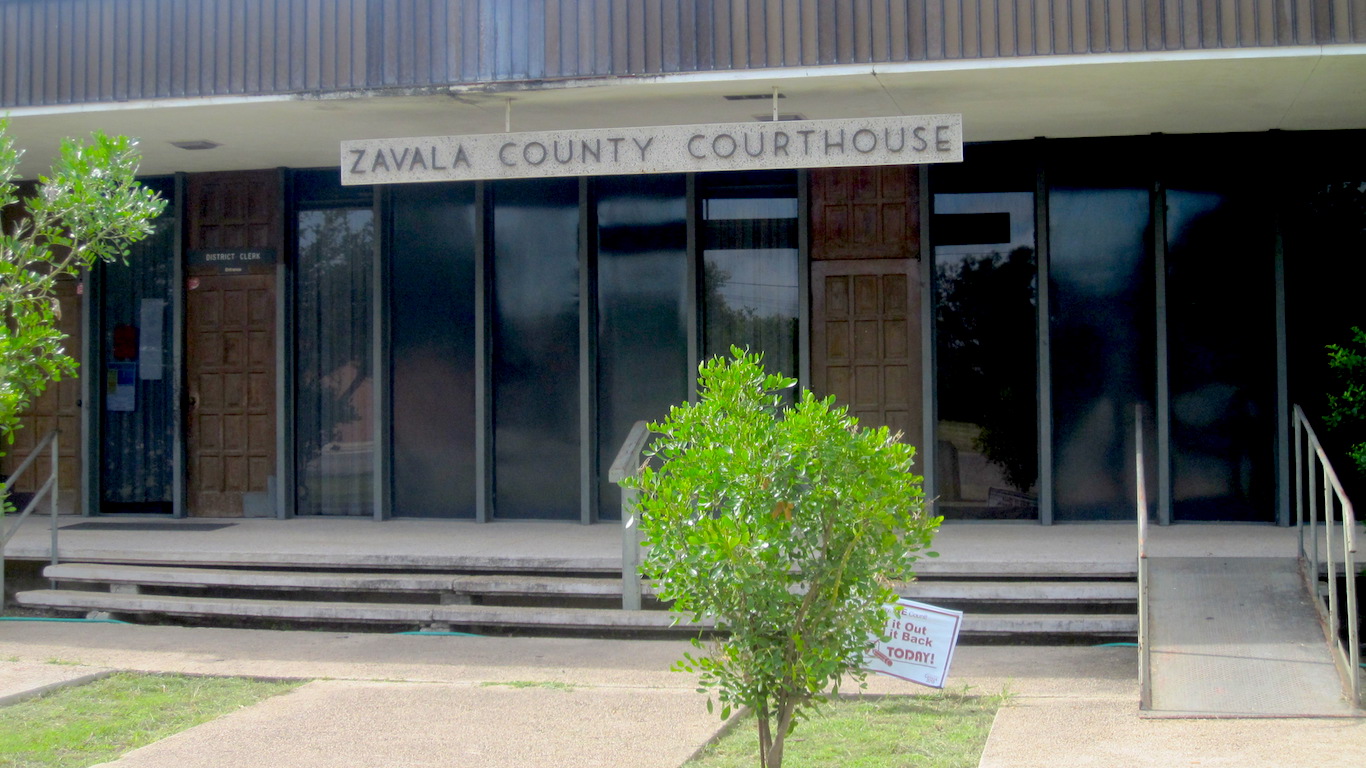
- Average popular vote split in last 4 presidential elections: 77.1% Democratic; 21.9% Republican
- Popular vote split in 2020 election: 65.4% Democrat (Joe Biden); 34.0% Republican (Donald Trump)
- Popular vote split in 2016 election: 77.6% Democrat (Hillary Clinton); 20.4% Republican (Donald Trump)
- Popular vote split in 2012 election: 83.3% Democrat (Barack Obama); 15.7% Republican (Mitt Romney)
- Popular vote split in 2008 election: 84.2% Democrat (Barack Obama); 15.4% Republican (John McCain)
- County population: 9,700