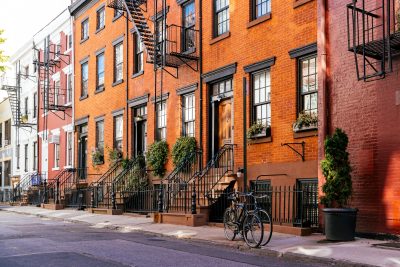
Living in a diverse neighborhood doesn’t just mean having more restaurants of different cuisines … as yummy as that may sound. It also means having the ability to experience a myriad of cultures, music, languages, sports, or fashion. While diversity can indeed mean people of different religion, age, gender, sexuality, socioeconomic status, and so on, if we only consider race and ethnicities, the overall racial and ethnic diversity of the United States has increased since 2010, according to 2020 Census analyses.
To better represent diversity, the Census developed an index that measures the chance that two people chosen at random will be from different race and ethnicity groups.
24/7 Wall St. used the idea to determine more specifically the diversity of neighborhoods on the East Coast. Reviewing five-year data on race and ethnicity from the U.S. Census Bureau’s 2022 American Community Survey, neighborhoods were ranked based on the probability that two residents picked at random will be of different race or ethnicity. Racial and ethnic groups include white, Black or African American, American Indian and Alaska Native, Asian, Native Hawaiian and other Pacific Islander, Hispanic or Latino, some other race alone, and two or more races.
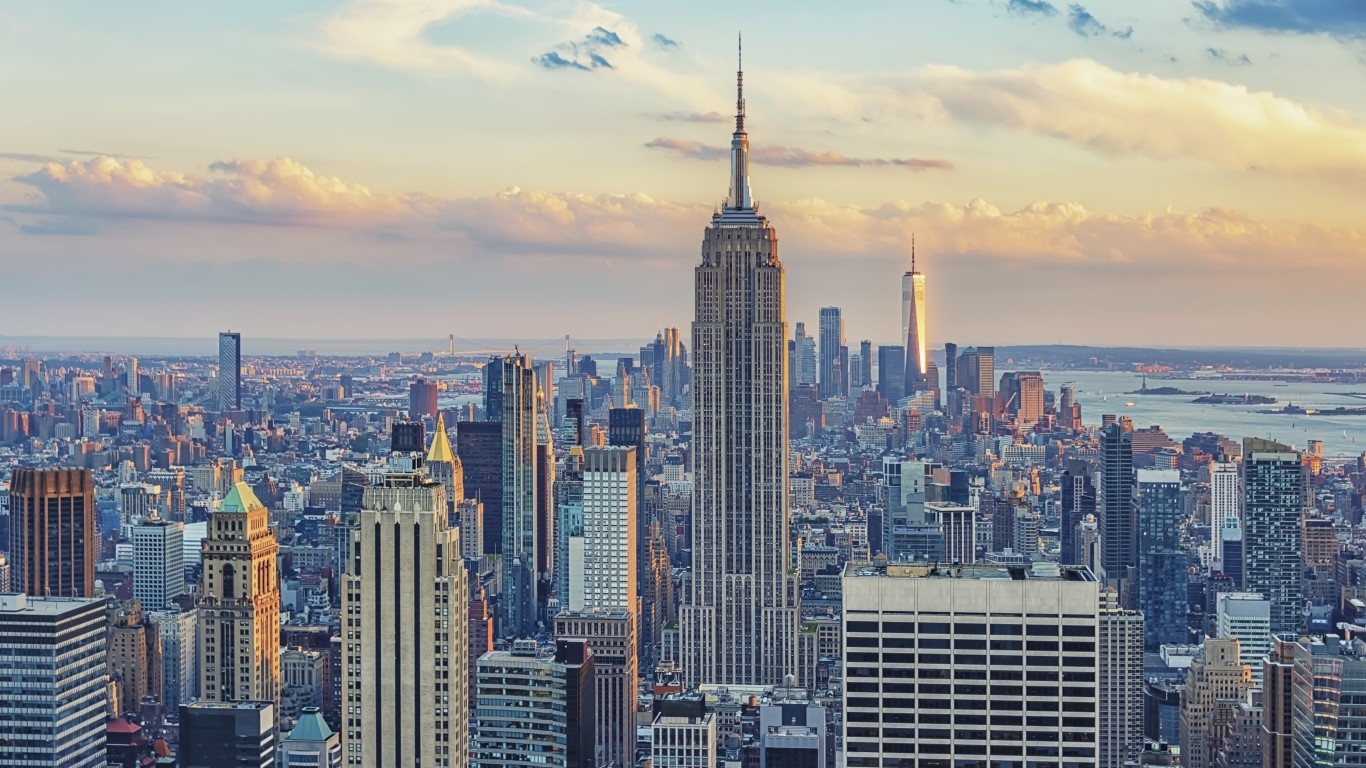
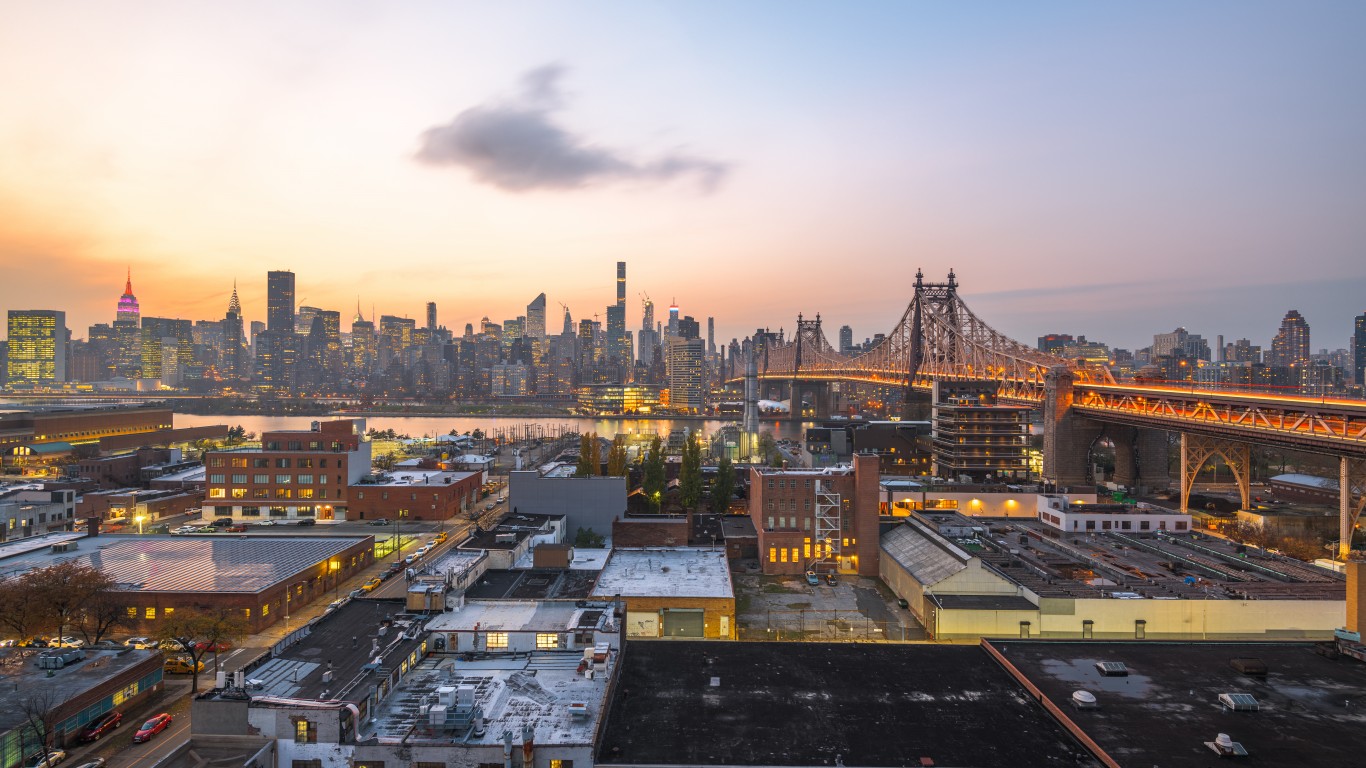
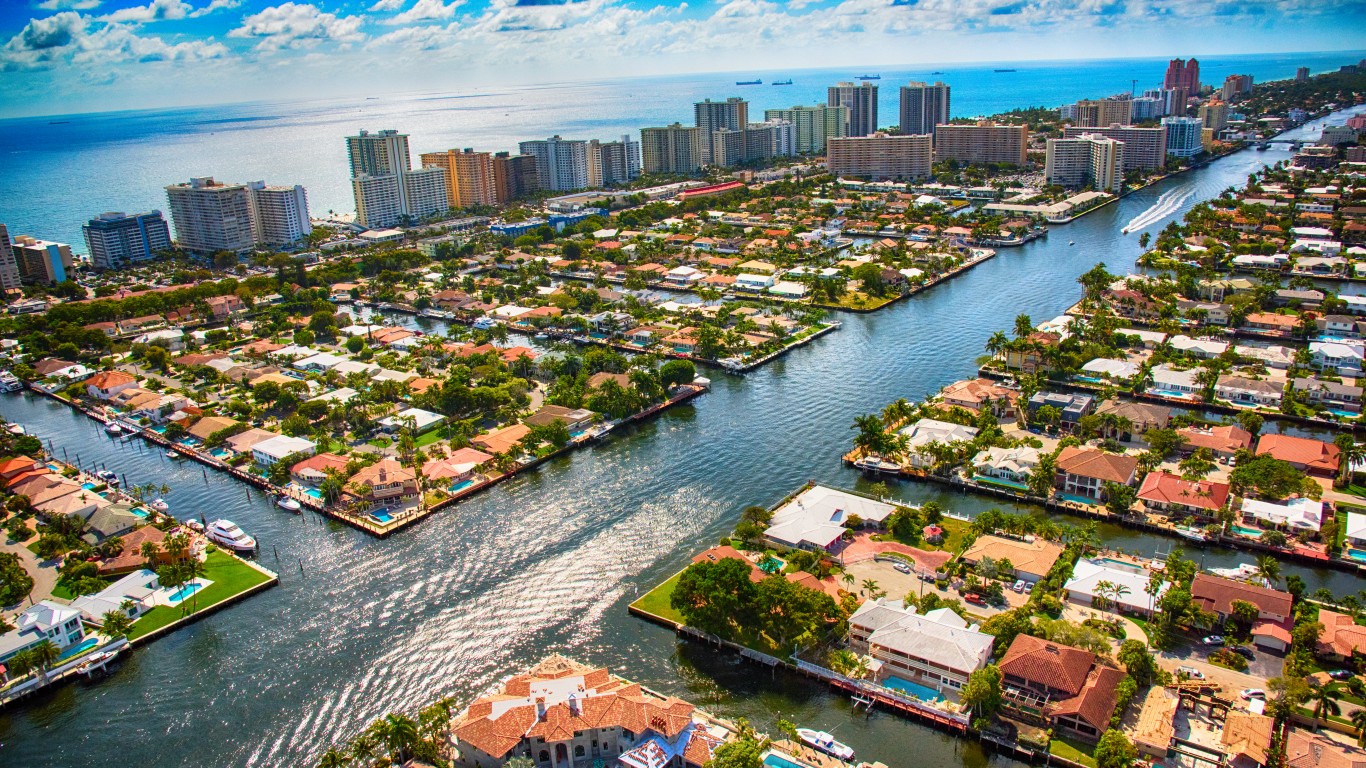
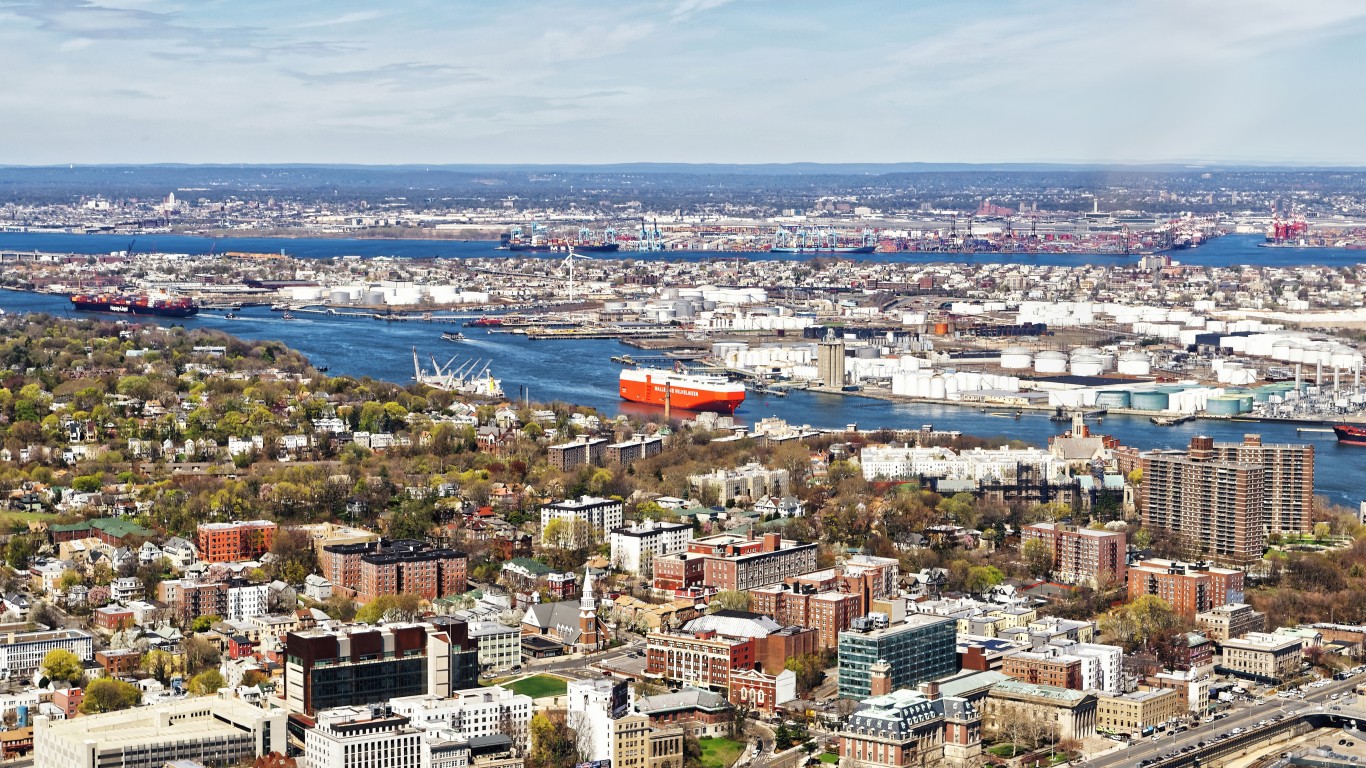
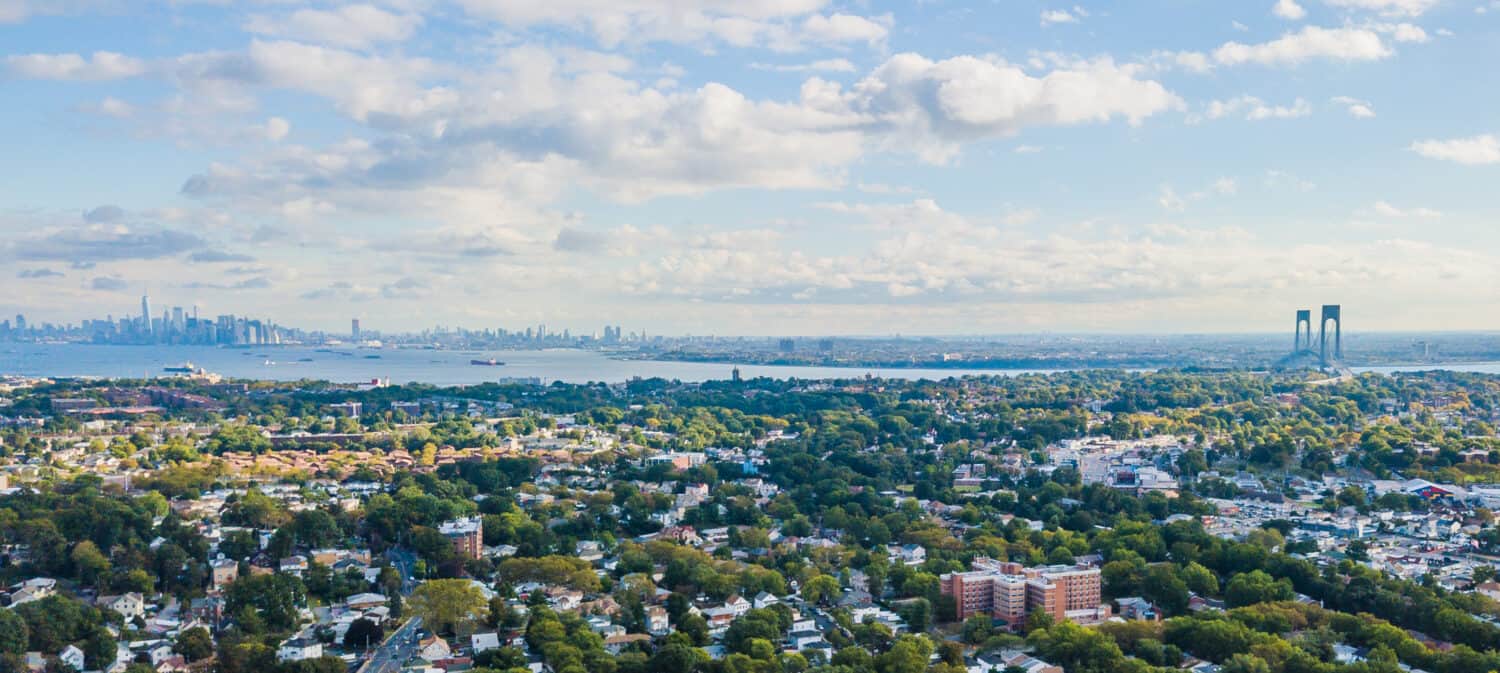
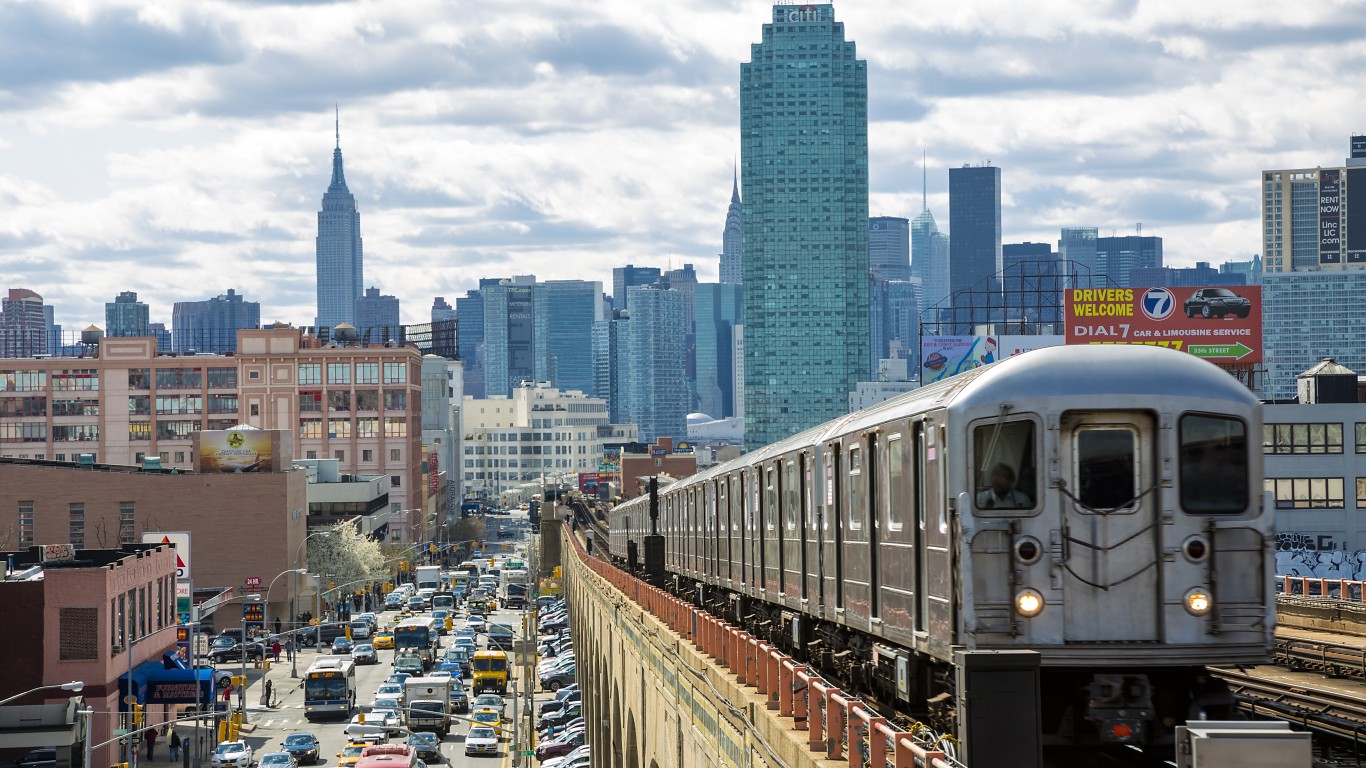
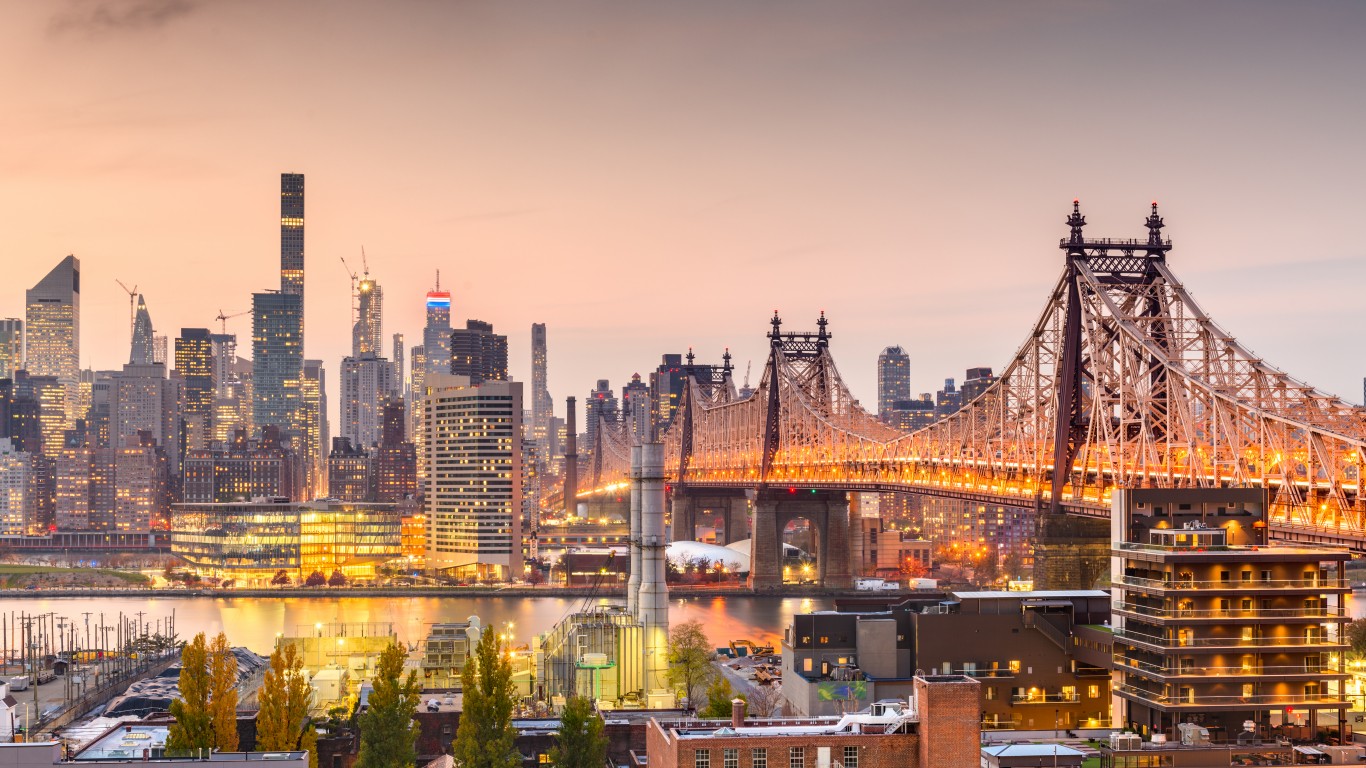
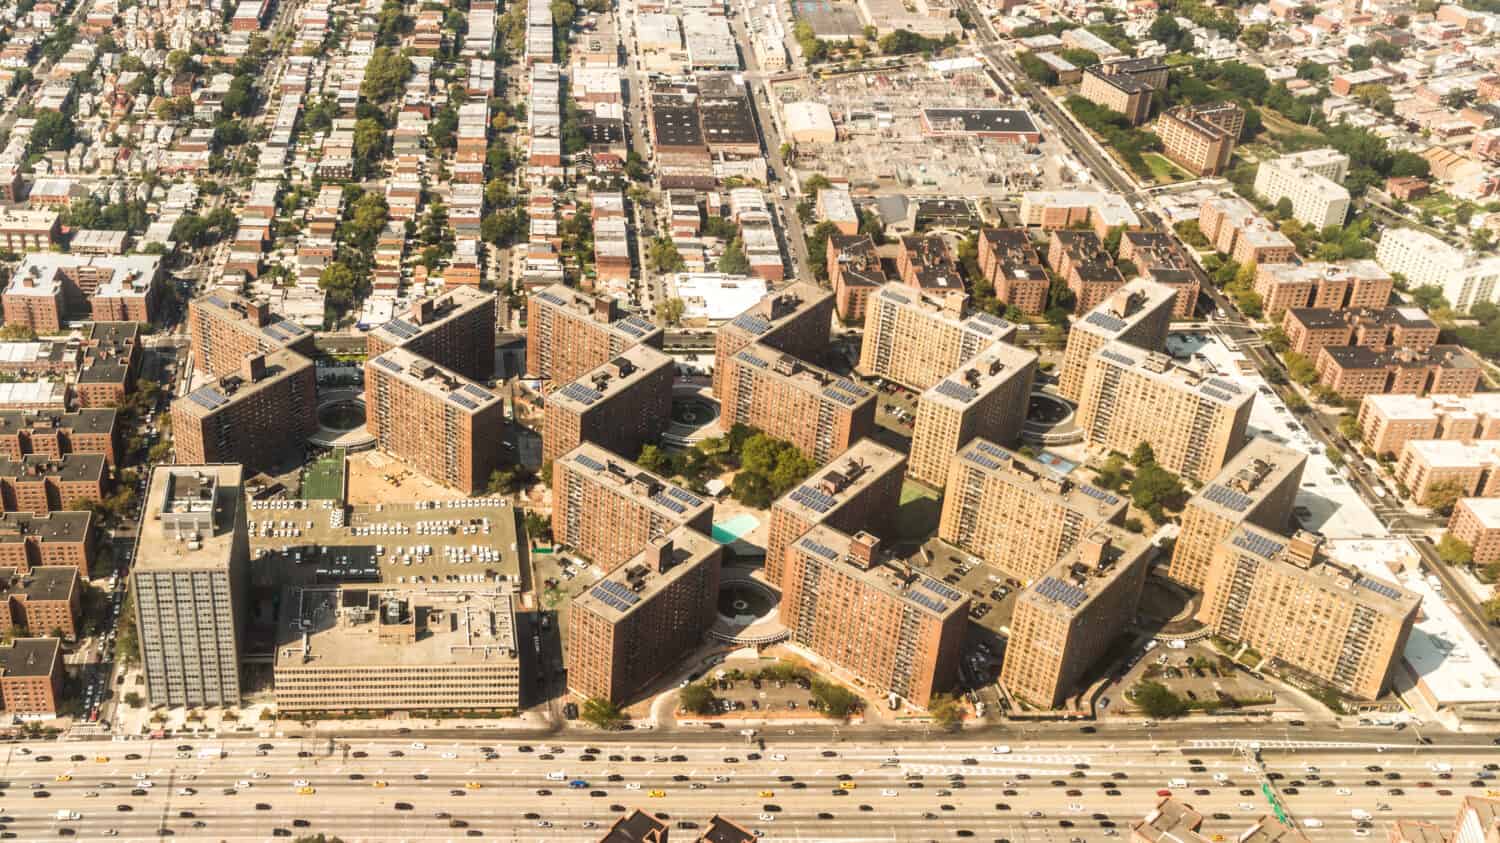
Not surprising, considering New York City is the country’s largest metropolitan area and attracts people of all backgrounds, New York state is home to 18 of the most diverse neighborhoods on the East Coast, followed by six in Florida and five each in Pennsylvania and Massachusetts. Ten of the neighborhoods are in New York City alone, including five in Queens, three in Staten Island, and one each in Brooklyn and Manhattan. (Not just on the East Coast, also see: America’s Most Diverse Neighborhoods.)
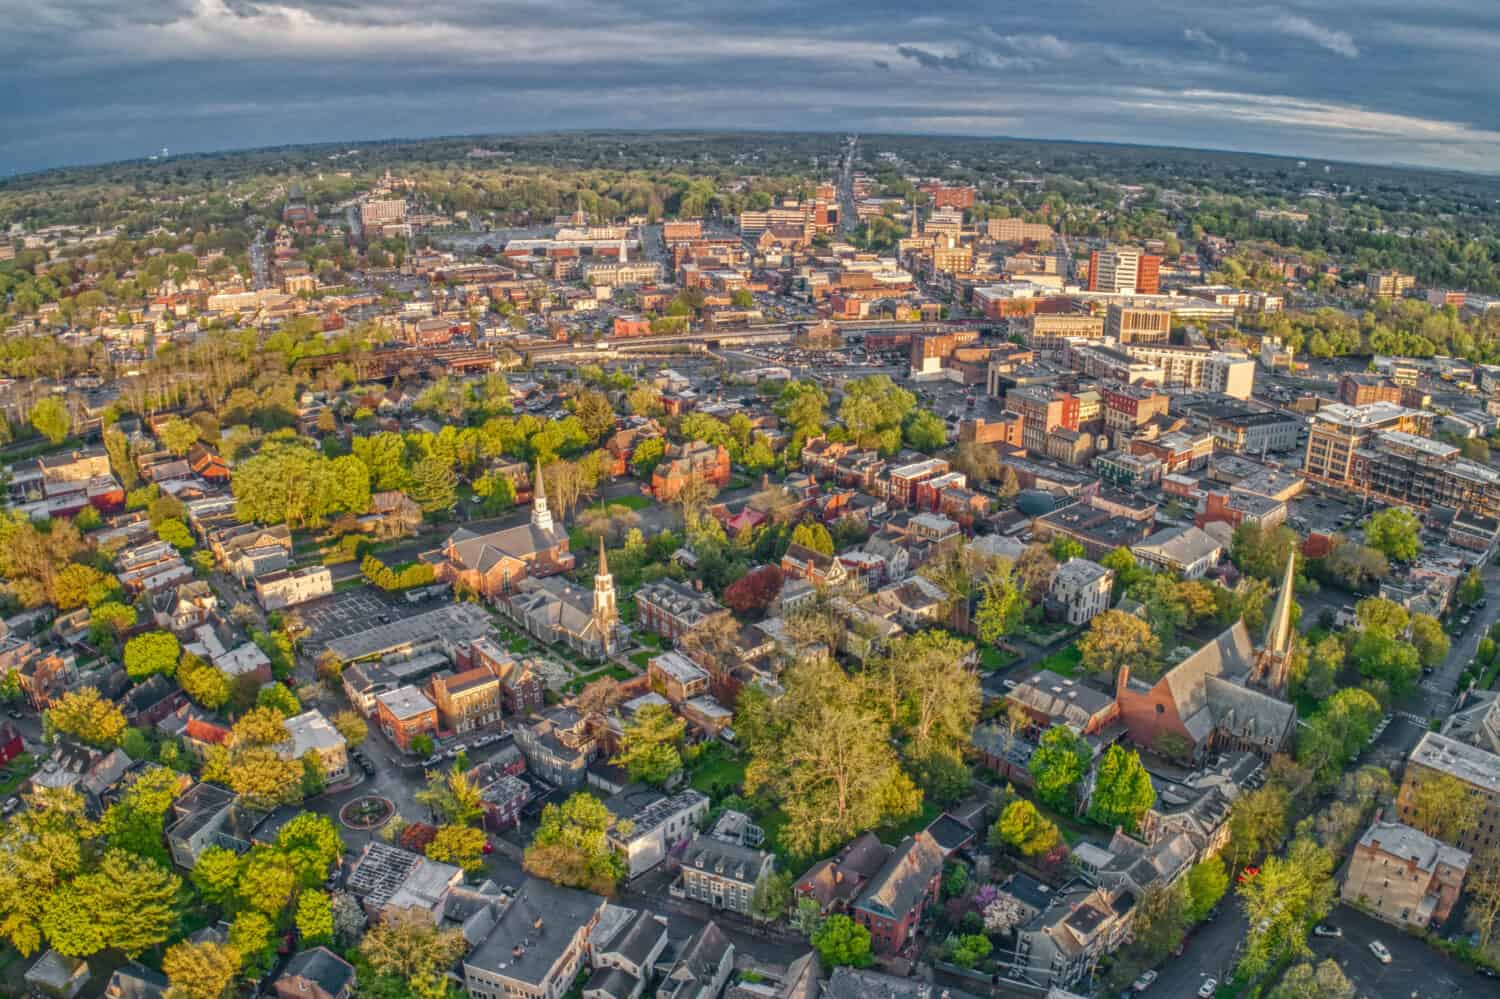
Many of the New York City neighborhoods also have home values well above $500,000, though the most diverse neighborhood and the third most diverse neighborhood on the East Coast — those in Schenectady, New York — have considerably lower home values of less than $165,000, based on Zillow data. The U.S. typical home value in November 2023 was $342,099.
Full Methodology
To determine the most diverse neighborhoods on the East Coast, 24/7 Wall St. reviewed five-year data on race and ethnicity from the U.S. Census Bureau’s 2022 American Community Survey. Neighborhoods were ranked based on the probability that two residents picked at random will be of different race or ethnicity. Racial and ethnic groups include white, Black or African American, American Indian and Alaska Native, Asian, Native Hawaiian and other Pacific Islander, Hispanic or Latino, some other race alone, and two or more races. The probability that any two residents picked at random will belong to a different racial or ethnic category is equivalent to the sum of the squares of each group’s share of the population, subtracted from 1. The same method is used in the USA Today Diversity Index as well as the racial and ethnic diversity index of the Disseminating Diversity Working Group of the Census Bureau.
Data on population by race and ethnicity were aggregated from the census tract level to the neighborhood level using 2022 census tract boundary definitions from the U.S. Census Bureau and 2017 neighborhood boundary definitions from Zillow. Census tracts with at least 50% spatial overlap within the neighborhood boundary were included in population aggregation. Data on estimated median home value is the November 2023 Zillow Home Value Index, a measure of typical home values for homes in the 35th to 65th percentile range.
50. Skunk City (Syracuse, NY)
- Likelihood two random residents are different race or ethnicity: 73.2%
- Most prevalent race or ethnicity group: Black or African American (34.9%)
- Est. typical home value, Nov 2023: $81,821
- Est. population in 2022: 2,291
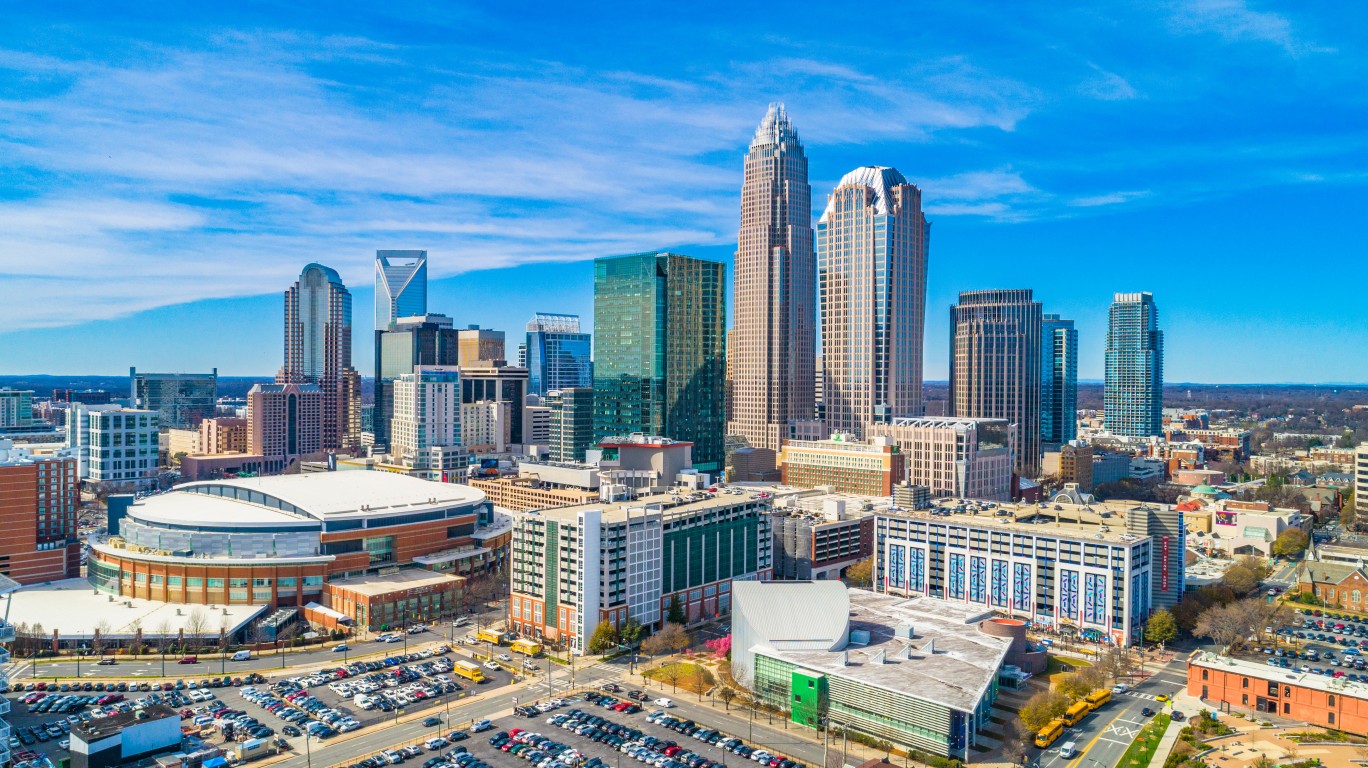
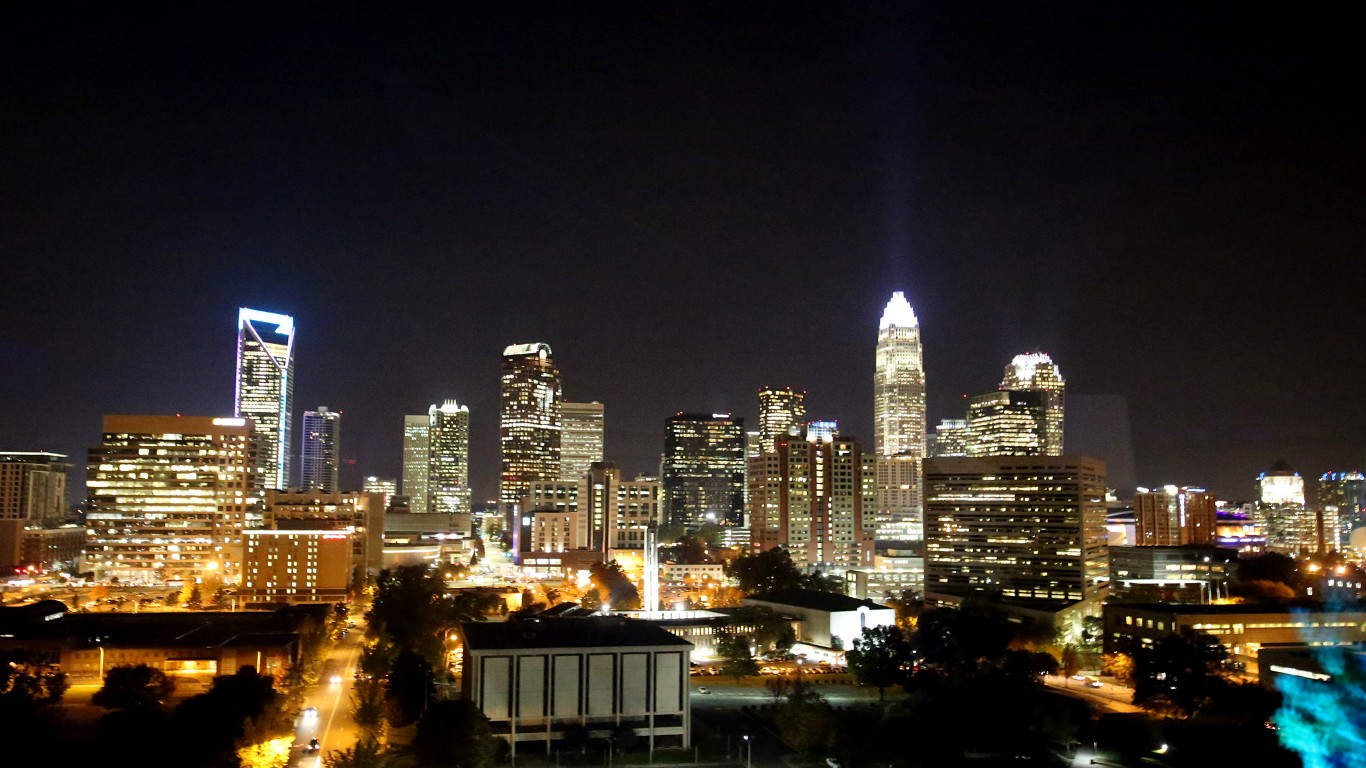
49. Griers Fork (Charlotte, NC)
- Likelihood two random residents are different race or ethnicity: 73.3%
- Most prevalent race or ethnicity group: Hispanic or Latino (31.1%)
- Est. typical home value, Nov 2023: $329,799
- Est. population in 2022: 3,712
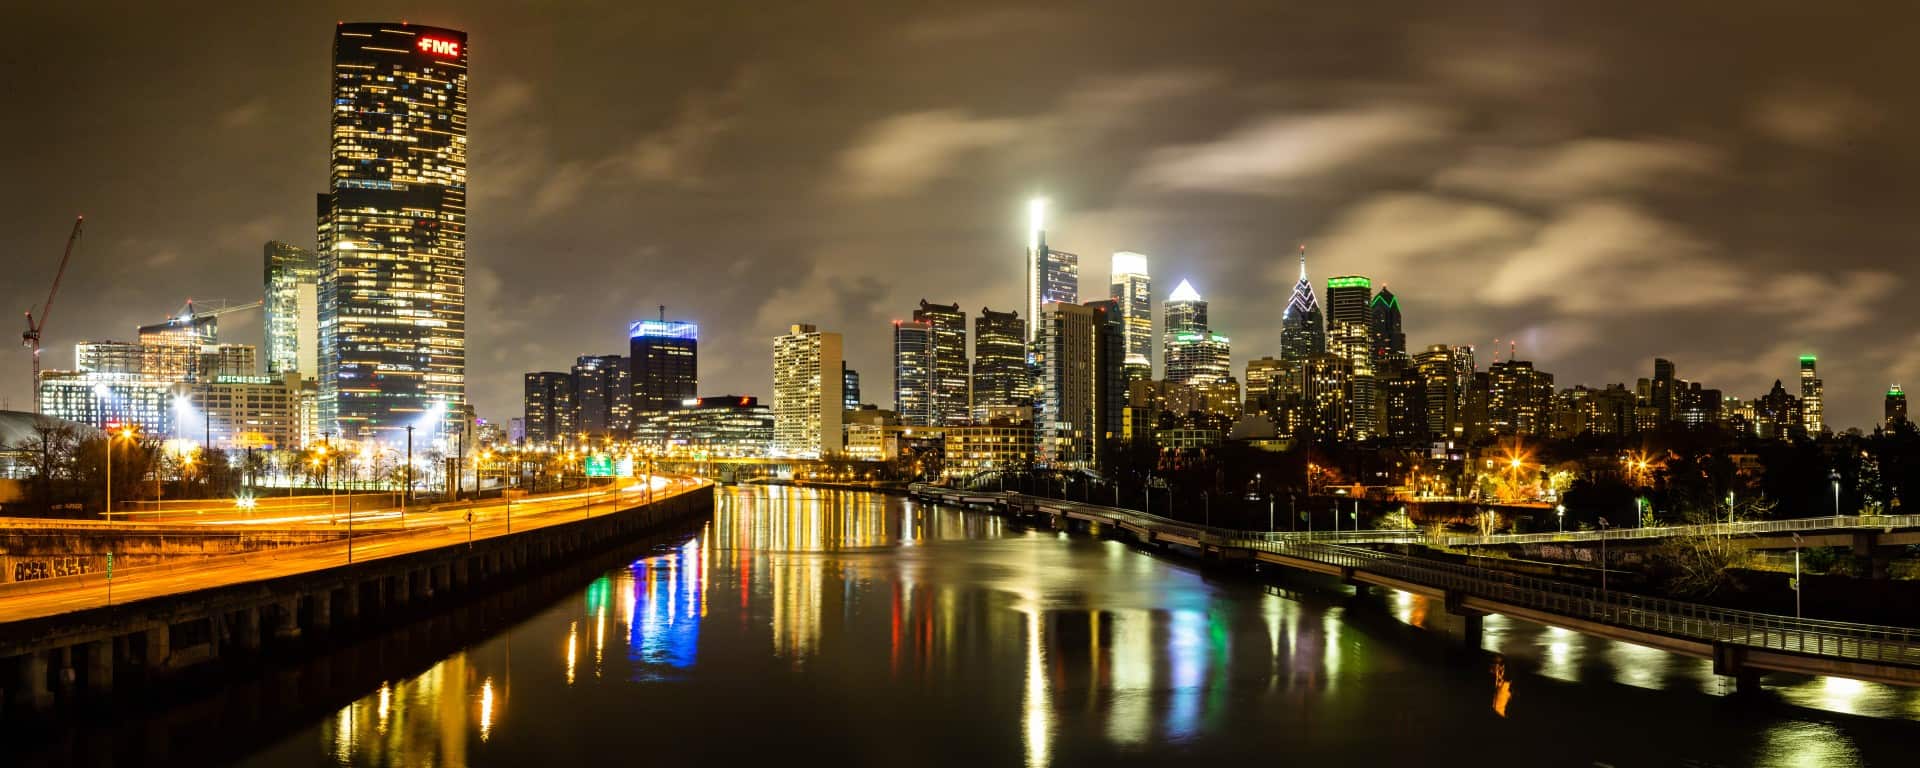
48. Holmesburg (Philadelphia, PA)
- Likelihood two random residents are different race or ethnicity: 73.4%
- Most prevalent race or ethnicity group: White (38.4%)
- Est. typical home value, Nov 2023: $204,125
- Est. population in 2022: 18,557
47. Lower East Side (Manhattan, NY)
- Likelihood two random residents are different race or ethnicity: 73.5%
- Most prevalent race or ethnicity group: Asian (34.4%)
- Est. typical home value, Nov 2023: $945,725
- Est. population in 2022: 58,967
46. Holliswood (Queens, NY)
- Likelihood two random residents are different race or ethnicity: 73.5%
- Most prevalent race or ethnicity group: White (34.6%)
- Est. typical home value, Nov 2023: N/A
- Est. population in 2022: 4,746
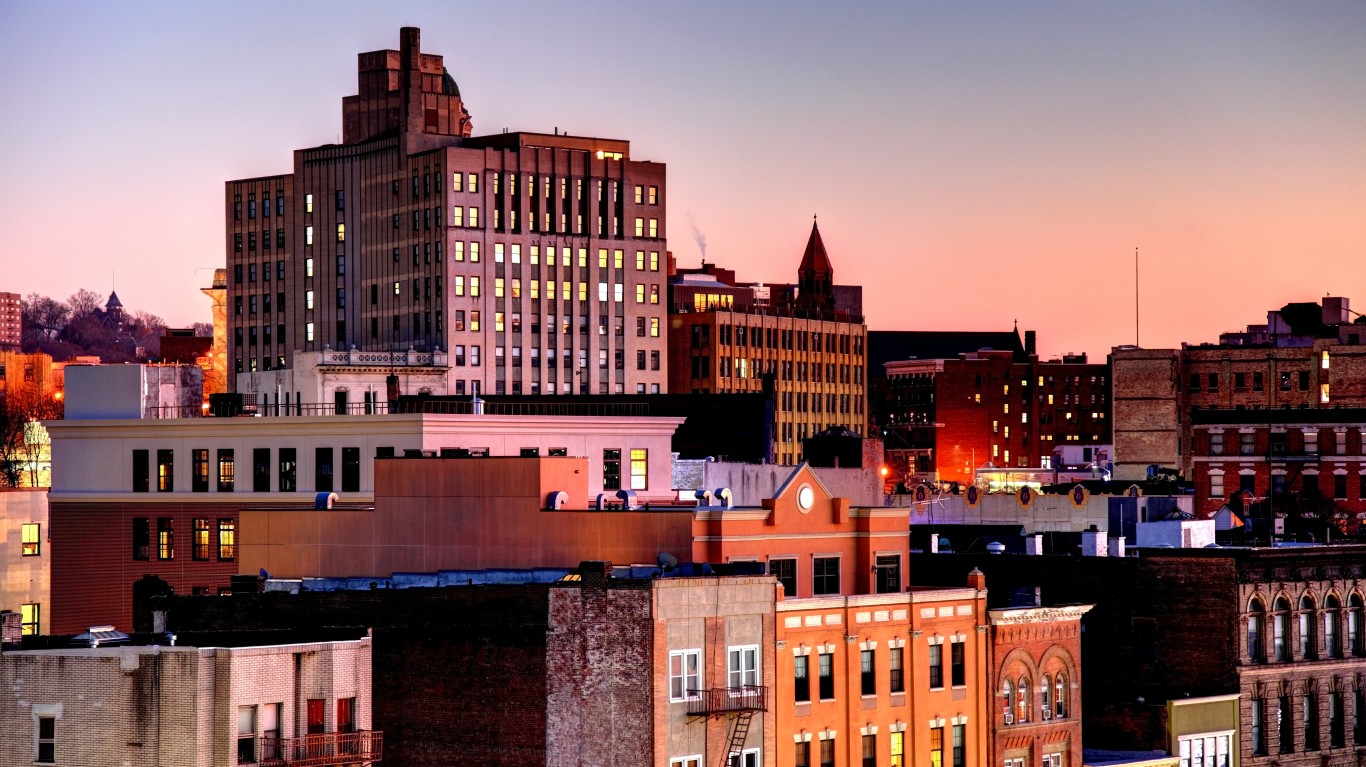
45. The Heights (Wilkes-Barre, PA)
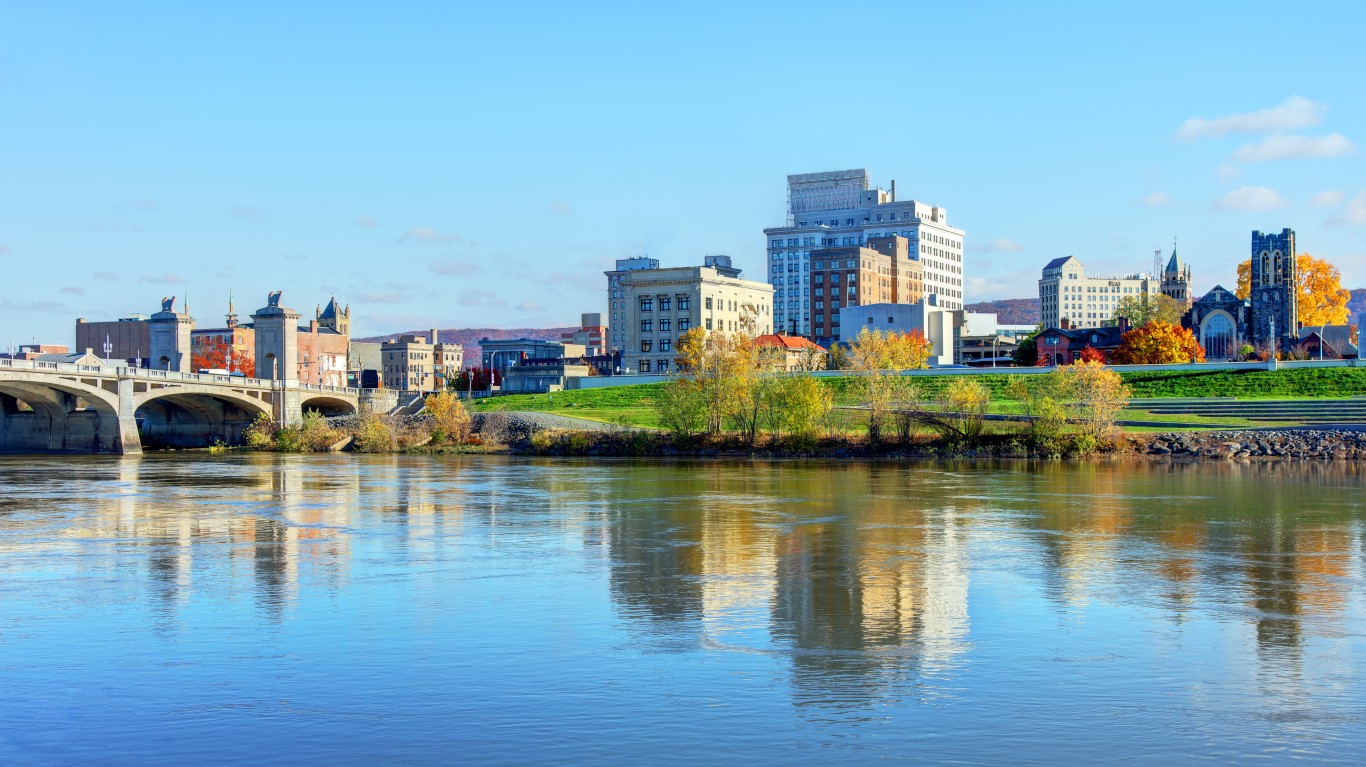
- Likelihood two random residents are different race or ethnicity: 73.5%
- Most prevalent race or ethnicity group: White (39.0%)
- Est. typical home value, Nov 2023: $108,682
- Est. population in 2022: 3,778
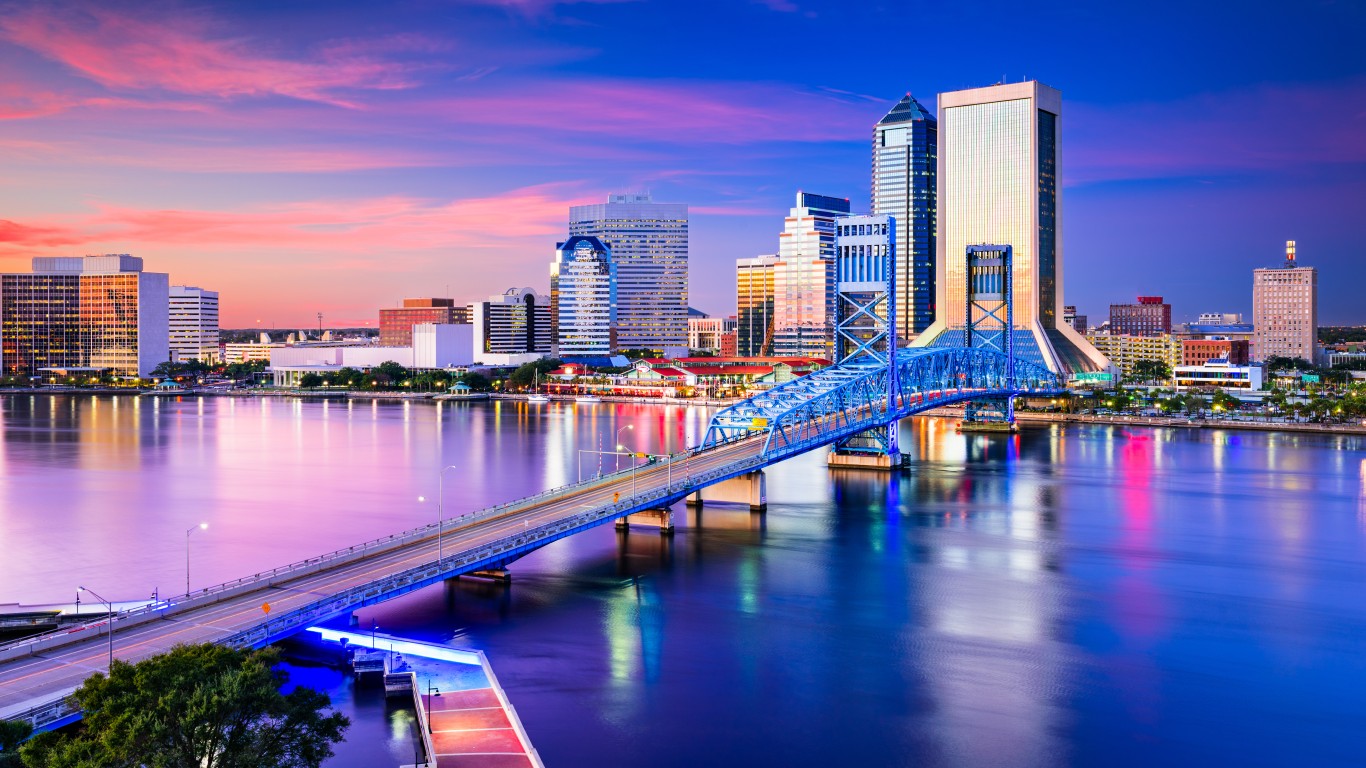
44. Englewood (Jacksonville, FL)
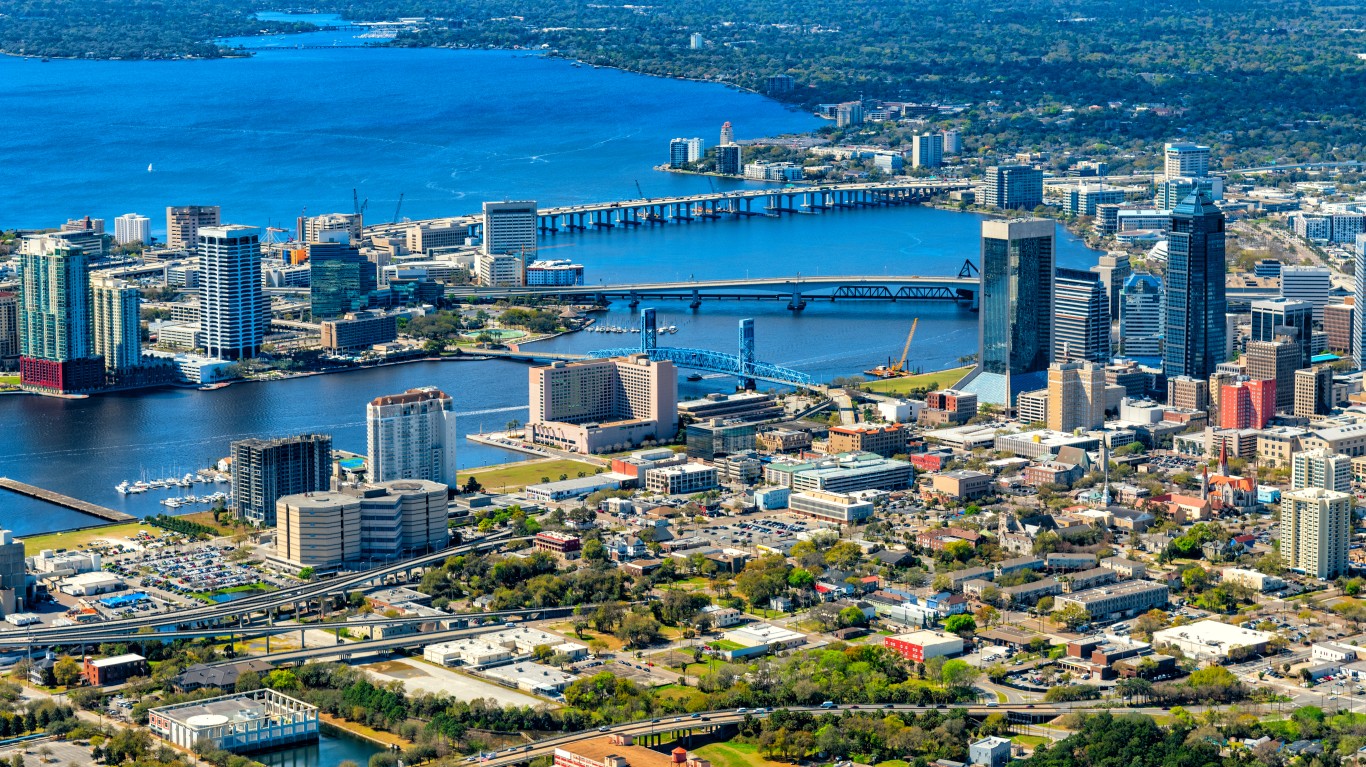
- Likelihood two random residents are different race or ethnicity: 73.6%
- Most prevalent race or ethnicity group: White (32.1%)
- Est. typical home value, Nov 2023: $247,675
- Est. population in 2022: 8,777
43. Brooklawn/ St. Vincent’s (Bridgeport, CT)
- Likelihood two random residents are different race or ethnicity: 73.6%
- Most prevalent race or ethnicity group: White (38.5%)
- Est. typical home value, Nov 2023: $316,994
- Est. population in 2022: 21,955
42. Downtown (Bridgeport, CT)
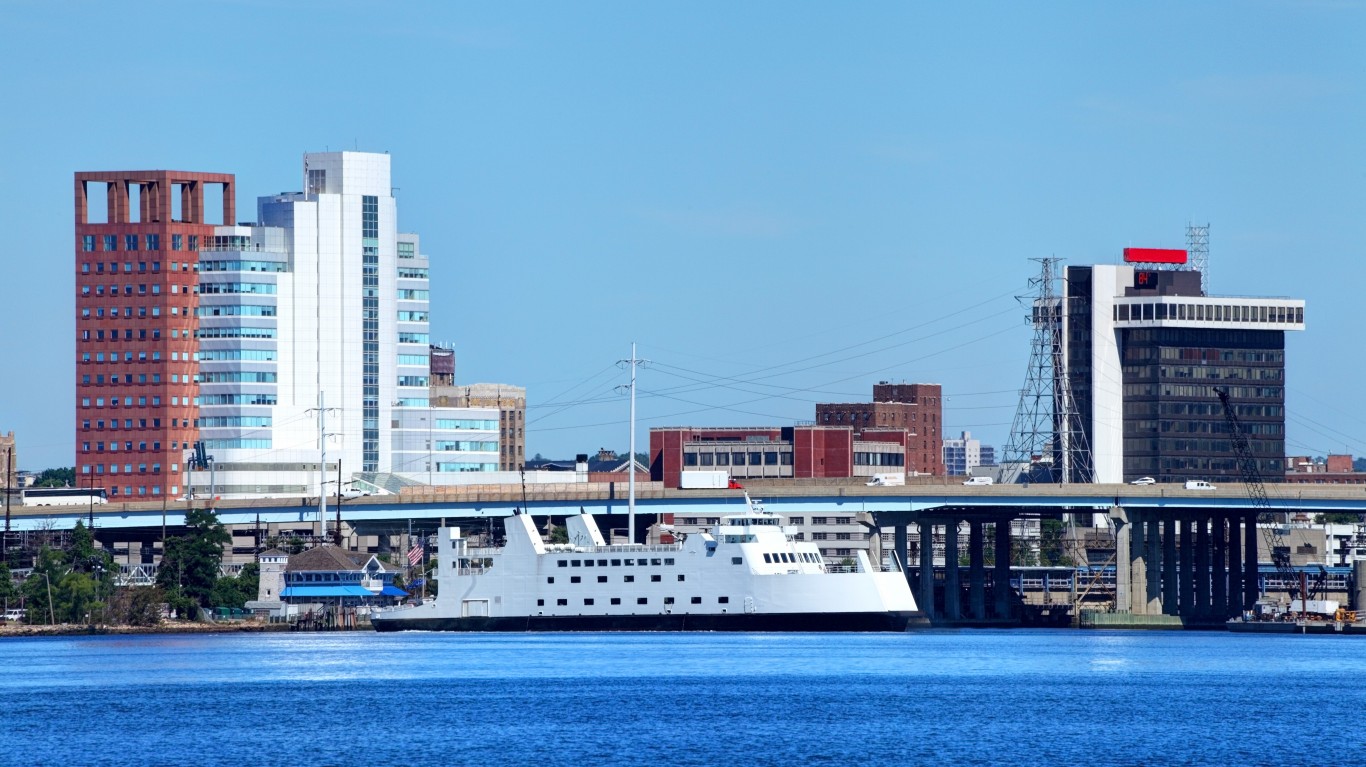
- Likelihood two random residents are different race or ethnicity: 73.7%
- Most prevalent race or ethnicity group: White (34.5%)
- Est. typical home value, Nov 2023: N/A
- Est. population in 2022: 1,565
41. Cresthaven (Pompano Beach, FL)
- Likelihood two random residents are different race or ethnicity: 73.7%
- Most prevalent race or ethnicity group: White (36.7%)
- Est. typical home value, Nov 2023: $381,793
- Est. population in 2022: 8,169
40. New Brighton (Staten Island, NY)
- Likelihood two random residents are different race or ethnicity: 73.7%
- Most prevalent race or ethnicity group: Hispanic or Latino (30.9%)
- Est. typical home value, Nov 2023: $573,883
- Est. population in 2022: 6,654
39. Tompkinsville (Staten Island, NY)
- Likelihood two random residents are different race or ethnicity: 73.8%
- Most prevalent race or ethnicity group: White (40.3%)
- Est. typical home value, Nov 2023: $570,707
- Est. population in 2022: 1,656
38. Graniteville (Staten Island, NY)
- Likelihood two random residents are different race or ethnicity: 73.9%
- Most prevalent race or ethnicity group: White (36.6%)
- Est. typical home value, Nov 2023: $621,094
- Est. population in 2022: 12,167
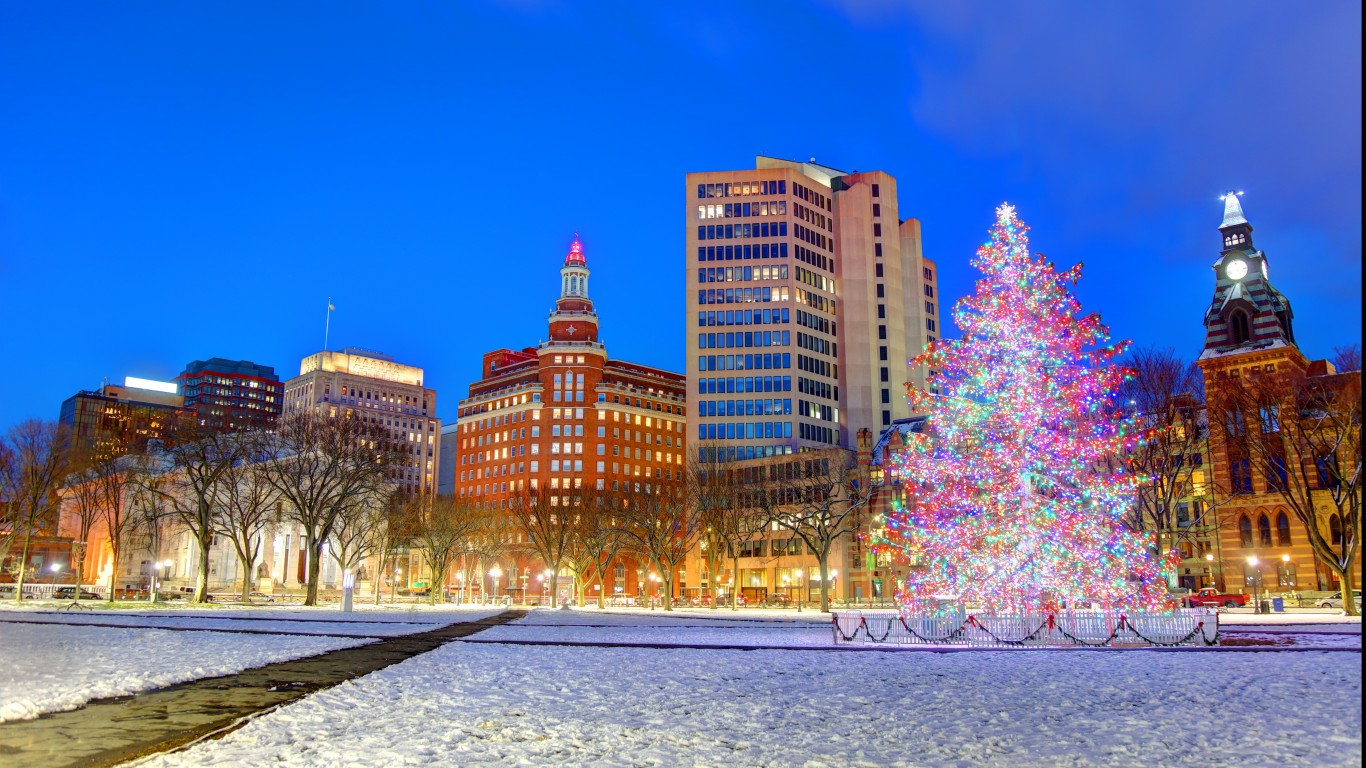
37. Downtown (Stamford, CT)
- Likelihood two random residents are different race or ethnicity: 73.9%
- Most prevalent race or ethnicity group: White (34.6%)
- Est. typical home value, Nov 2023: $311,376
- Est. population in 2022: 23,495
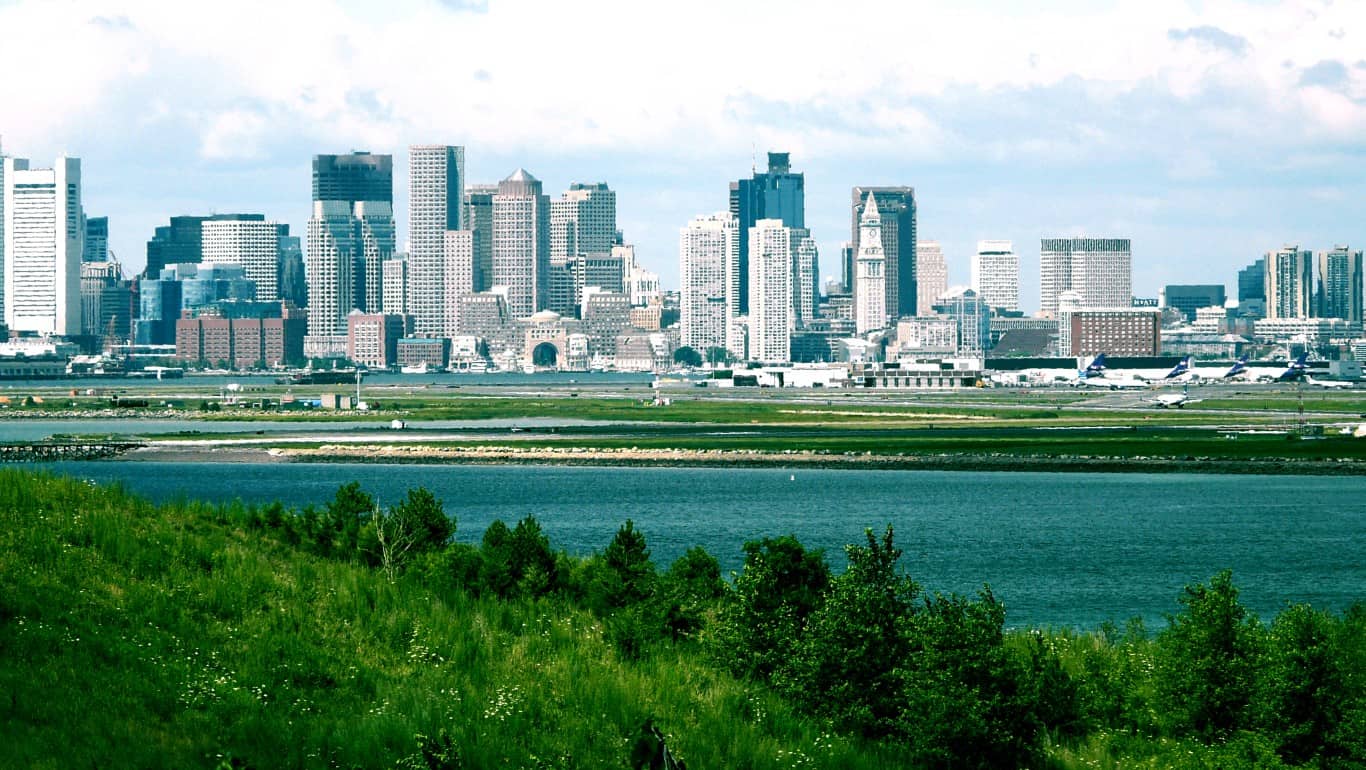
36. Mission Hill (Boston, MA)
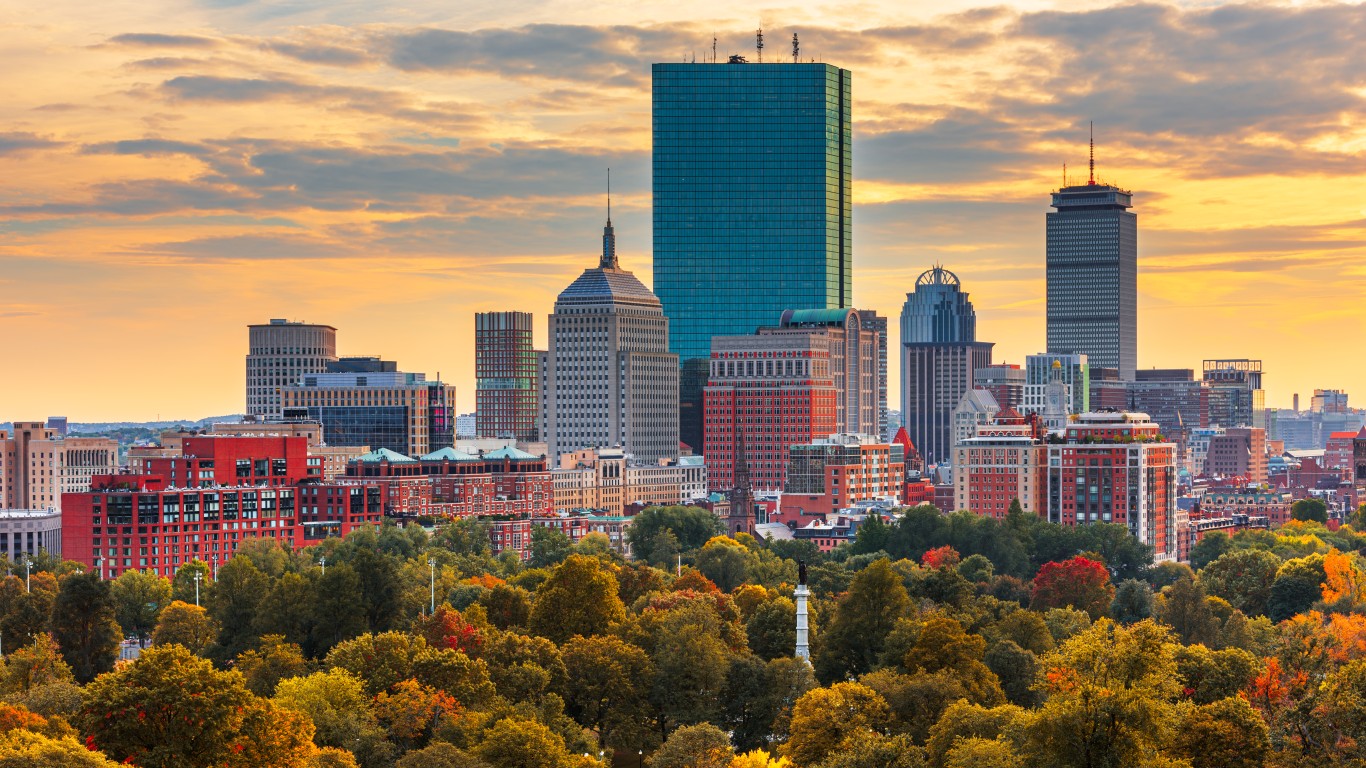
- Likelihood two random residents are different race or ethnicity: 73.9%
- Most prevalent race or ethnicity group: White (38.7%)
- Est. typical home value, Nov 2023: $770,621
- Est. population in 2022: 13,723
35. Yorkshire (Charlotte, NC)
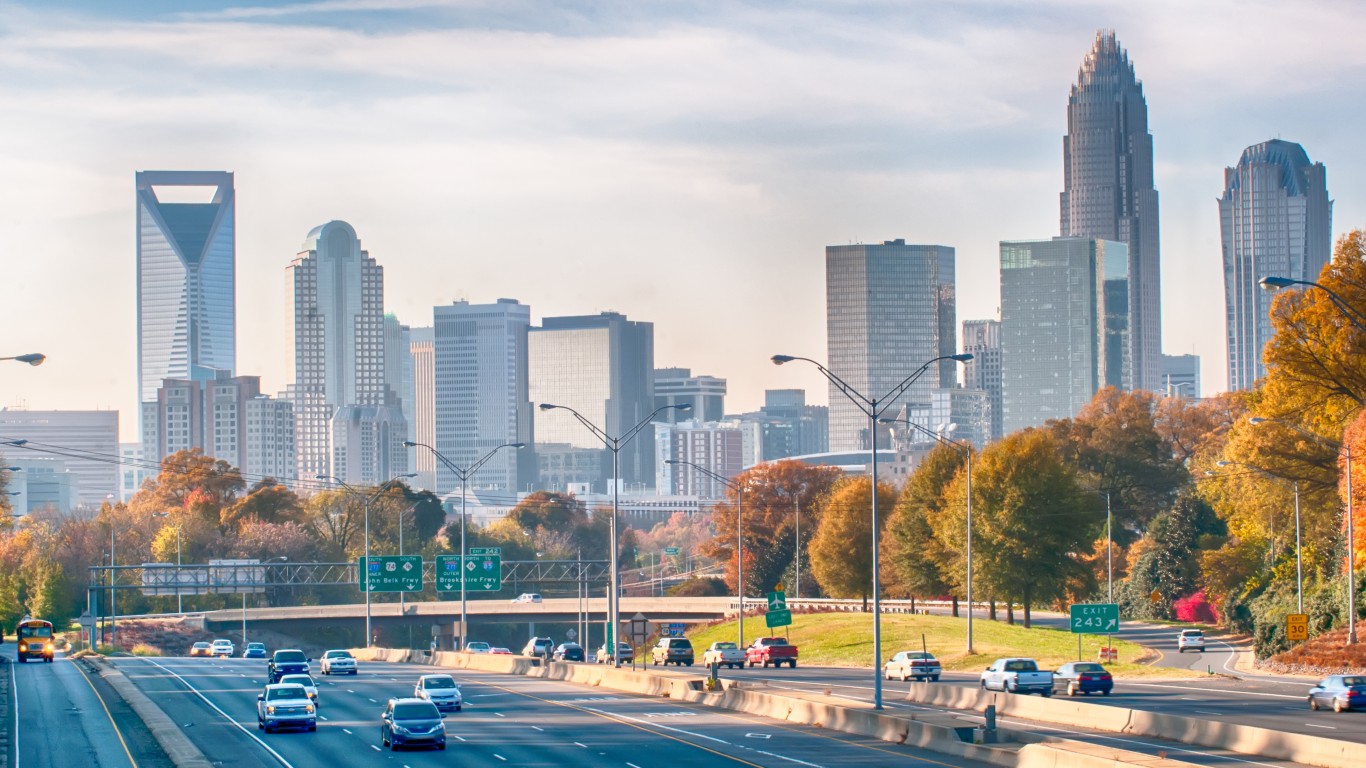
- Likelihood two random residents are different race or ethnicity: 73.9%
- Most prevalent race or ethnicity group: Black or African American (33.1%)
- Est. typical home value, Nov 2023: $393,198
- Est. population in 2022: 11,935
34. Military (Buffalo, NY)
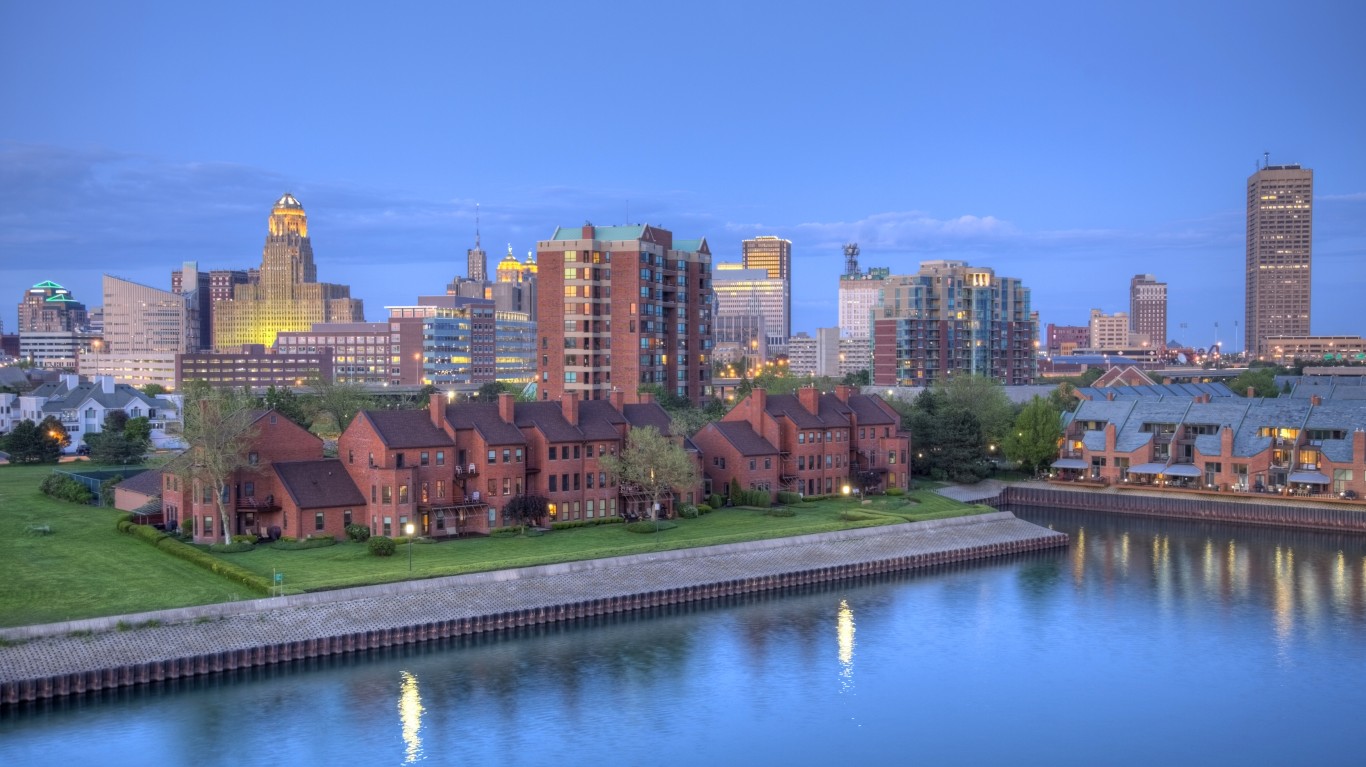
- Likelihood two random residents are different race or ethnicity: 73.9%
- Most prevalent race or ethnicity group: Black or African American (33.2%)
- Est. typical home value, Nov 2023: $172,855
- Est. population in 2022: 4,815
33. Adair Park (Atlanta, GA)
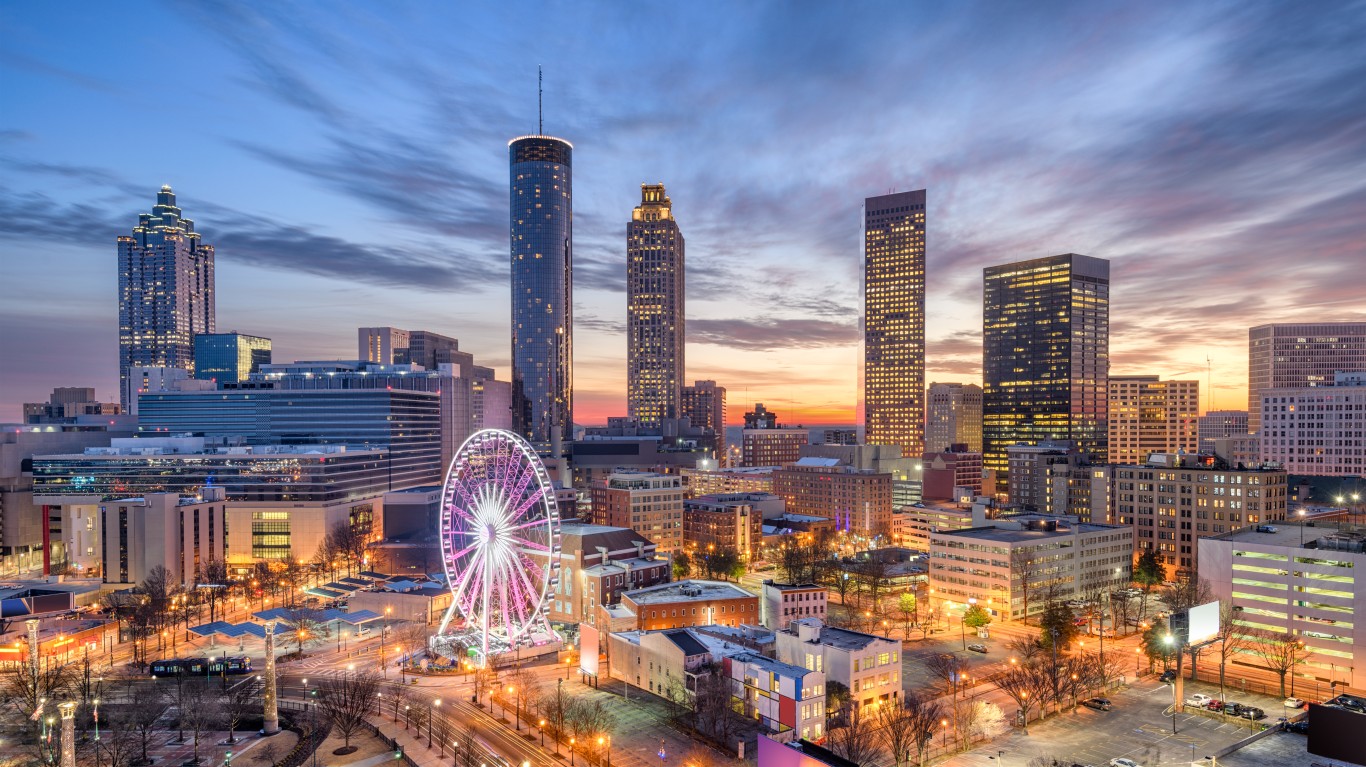
- Likelihood two random residents are different race or ethnicity: 73.9%
- Most prevalent race or ethnicity group: Black or African American (35.4%)
- Est. typical home value, Nov 2023: $383,417
- Est. population in 2022: 1,116
32. Windsor Park (Charlotte, NC)
- Likelihood two random residents are different race or ethnicity: 74.0%
- Most prevalent race or ethnicity group: Black or African American (29.9%)
- Est. typical home value, Nov 2023: $343,608
- Est. population in 2022: 10,163
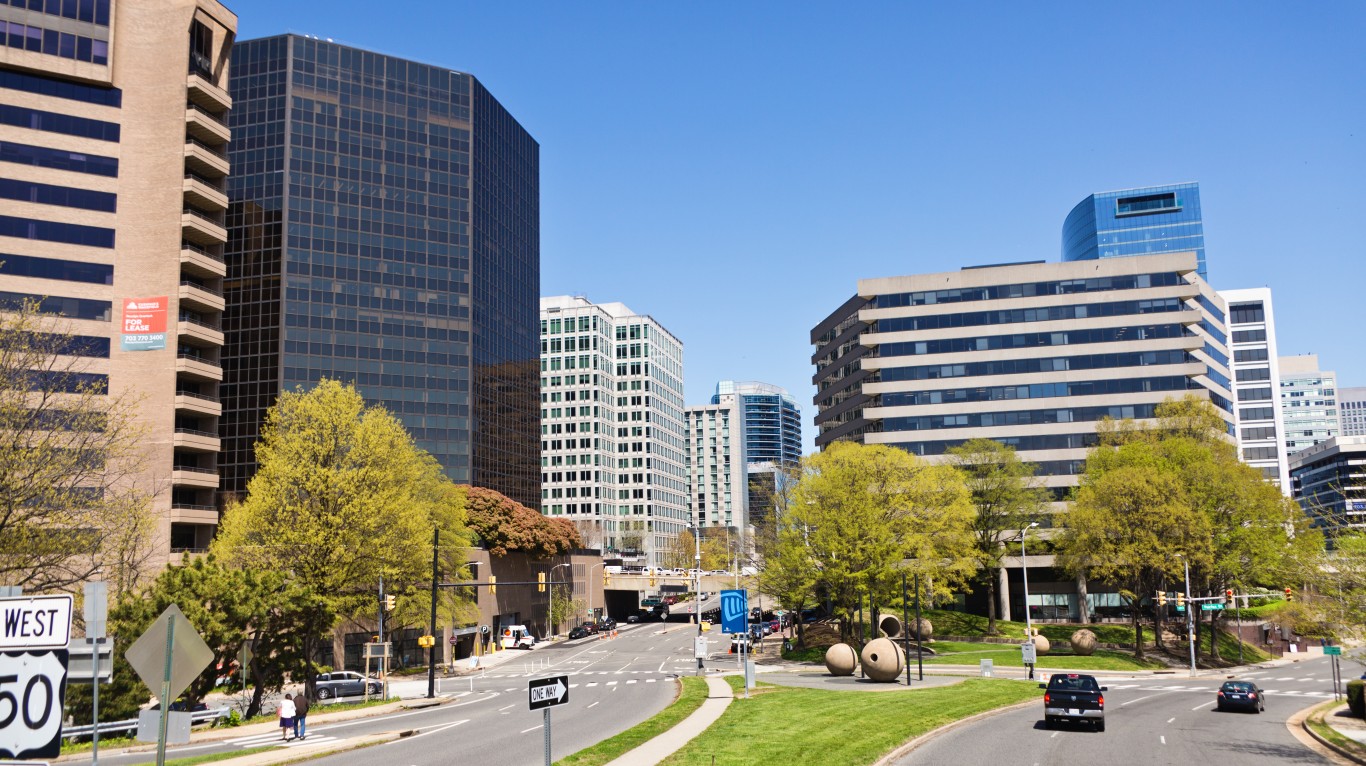
31. Alexandria West (Alexandria, VA)
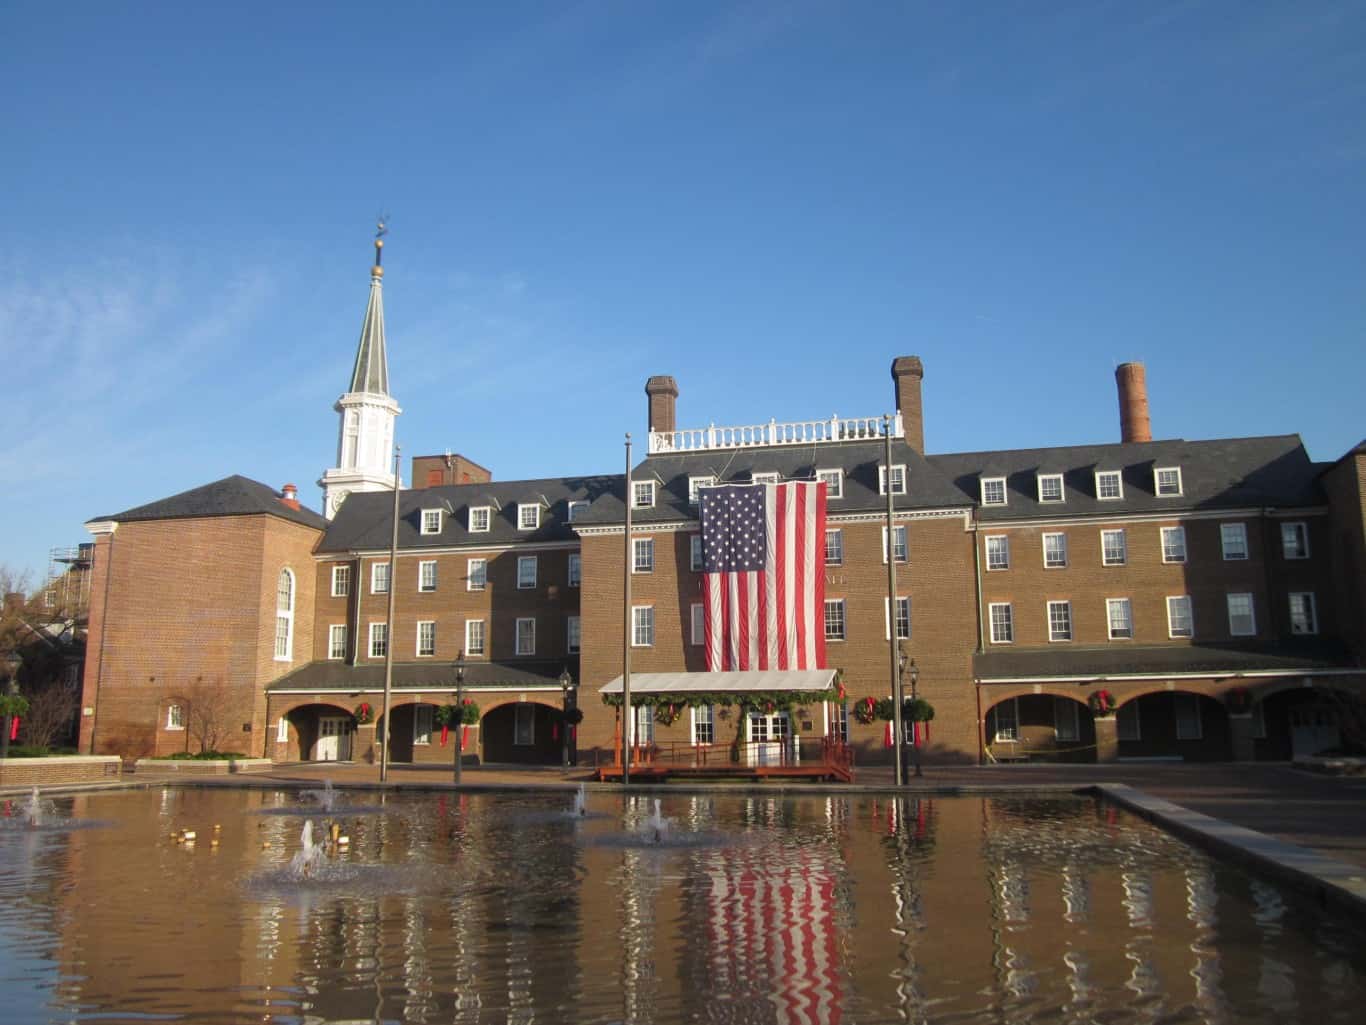
- Likelihood two random residents are different race or ethnicity: 74.0%
- Most prevalent race or ethnicity group: White (31.9%)
- Est. typical home value, Nov 2023: $359,463
- Est. population in 2022: 29,369
30. Lawndale (Philadelphia, PA)

- Likelihood two random residents are different race or ethnicity: 74.1%
- Most prevalent race or ethnicity group: Black or African American (38.4%)
- Est. typical home value, Nov 2023: $190,421
- Est. population in 2022: 23,051
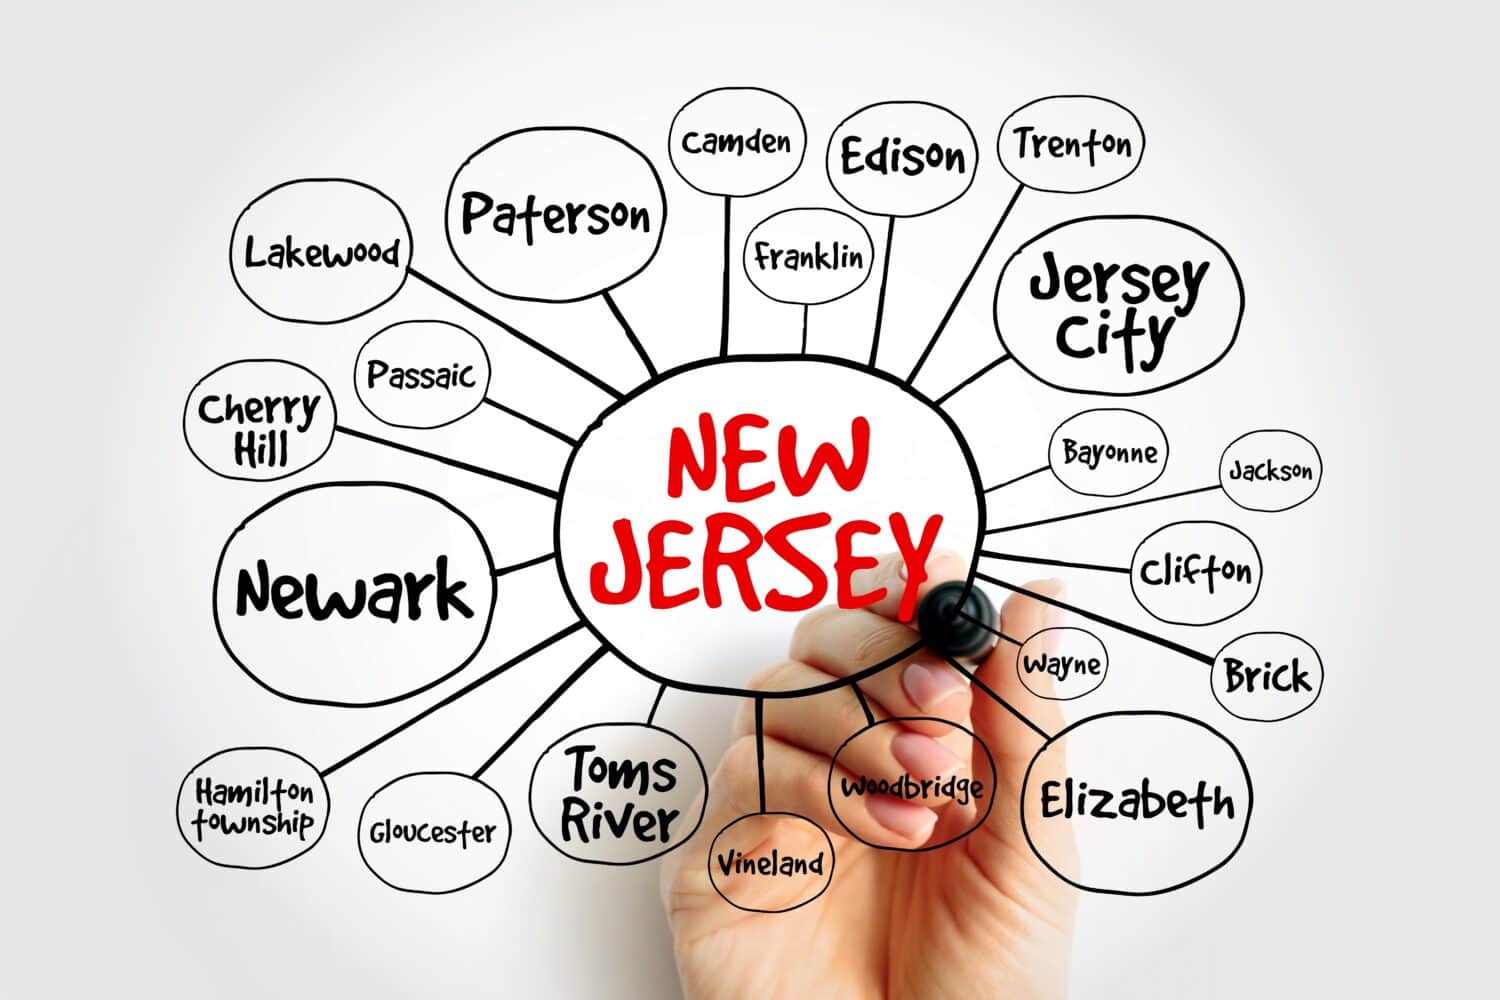
29. Journal Square (Jersey City, NJ)
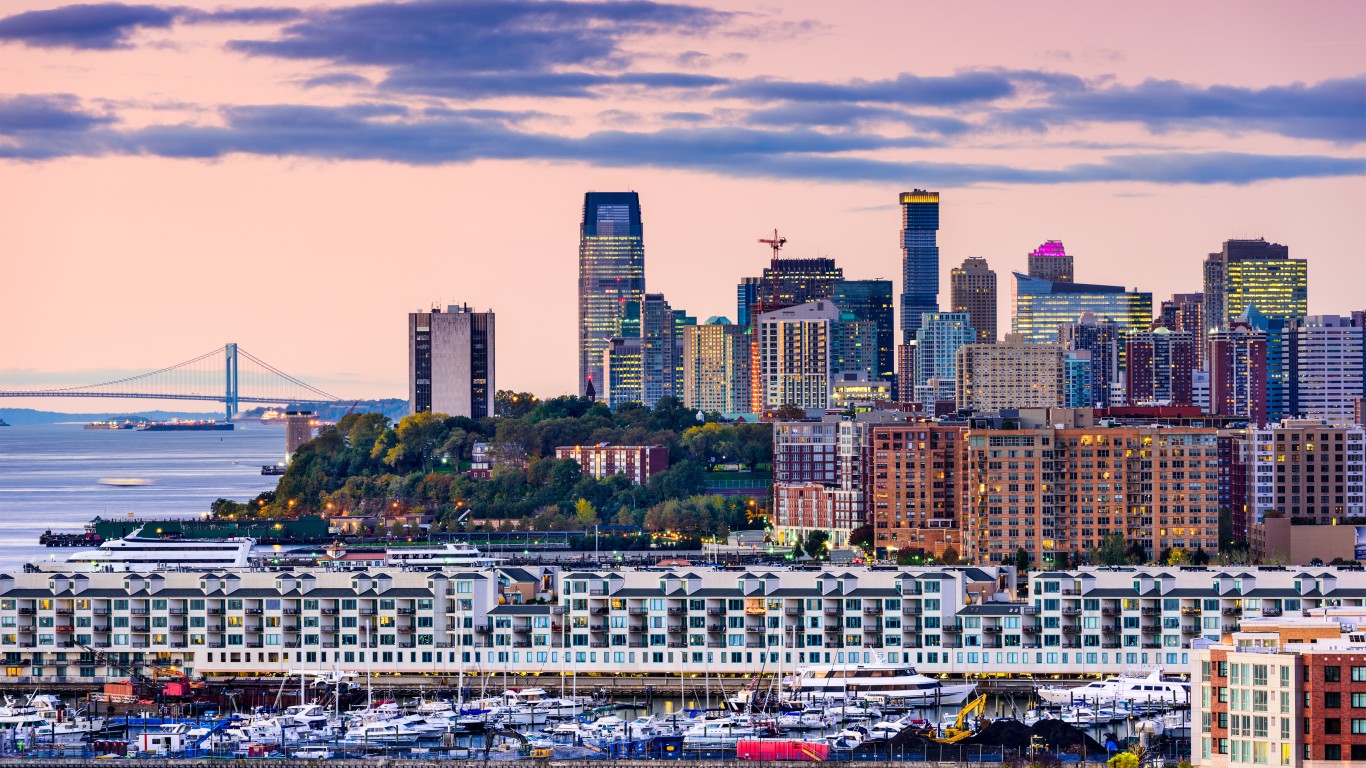
- Likelihood two random residents are different race or ethnicity: 74.1%
- Most prevalent race or ethnicity group: Asian (36.1%)
- Est. typical home value, Nov 2023: $464,115
- Est. population in 2022: 20,181
28. Baymeadows (Jacksonville, FL)
- Likelihood two random residents are different race or ethnicity: 74.2%
- Most prevalent race or ethnicity group: White (39.3%)
- Est. typical home value, Nov 2023: $235,024
- Est. population in 2022: 15,068
27. Riverside Park (Buffalo, NY)
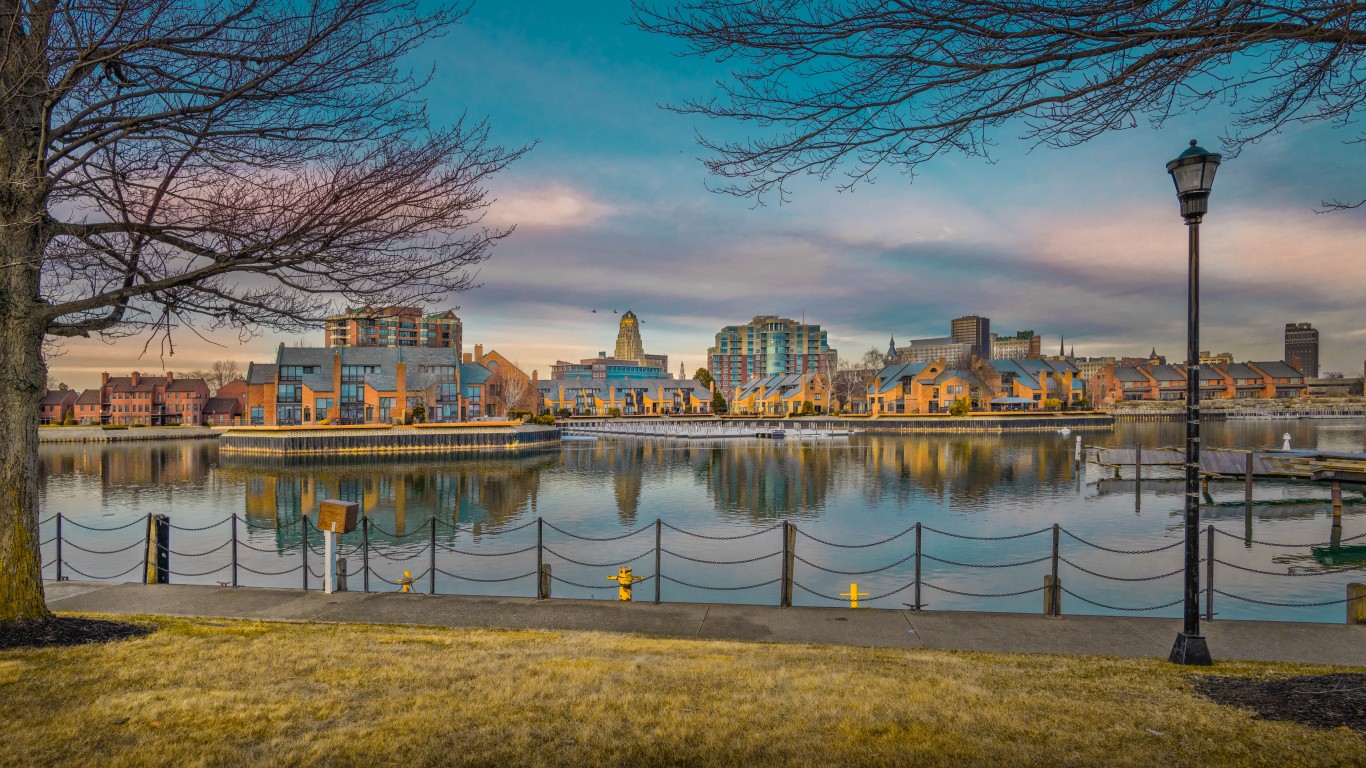
- Likelihood two random residents are different race or ethnicity: 74.4%
- Most prevalent race or ethnicity group: White (36.6%)
- Est. typical home value, Nov 2023: $143,966
- Est. population in 2022: 11,003
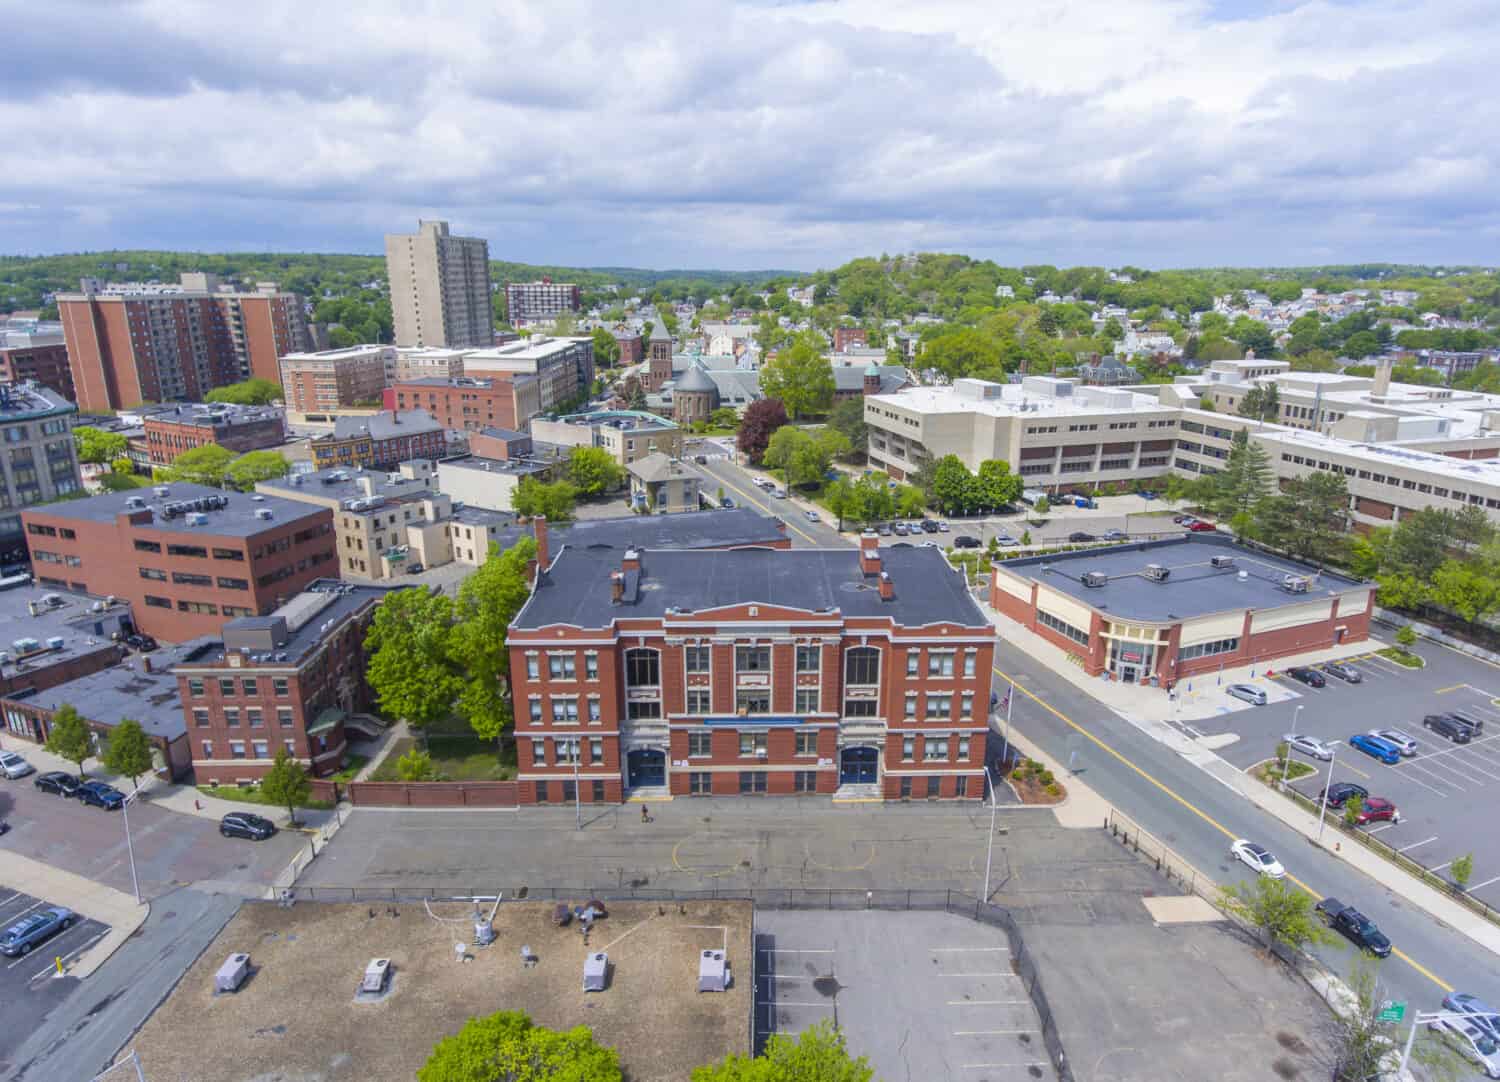
26. Back Central (Lowell, MA)
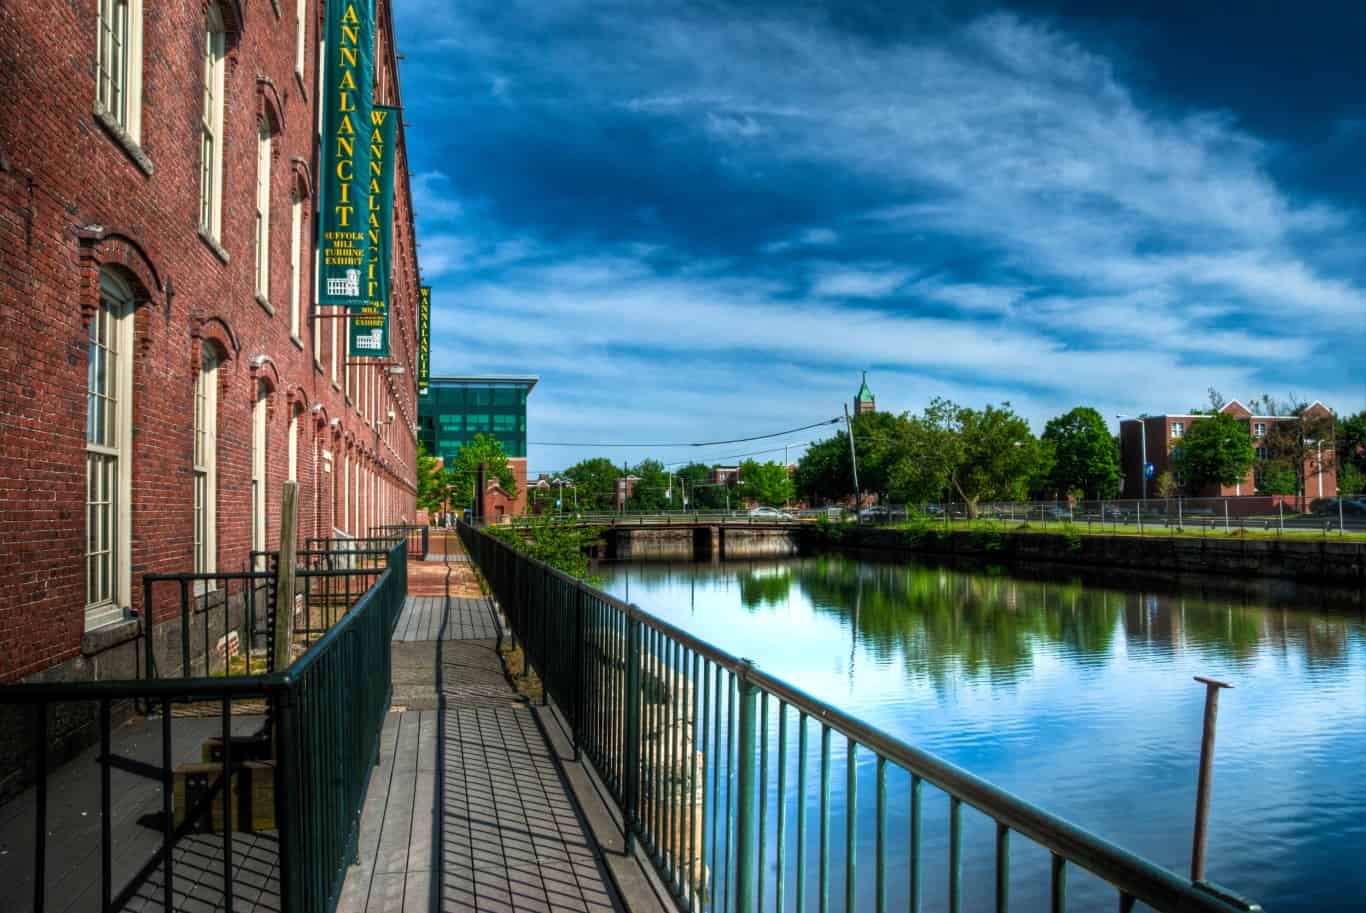
- Likelihood two random residents are different race or ethnicity: 74.4%
- Most prevalent race or ethnicity group: White (39.4%)
- Est. typical home value, Nov 2023: $352,063
- Est. population in 2022: 6,027
25. Cory Lake Isles (Tampa, FL)
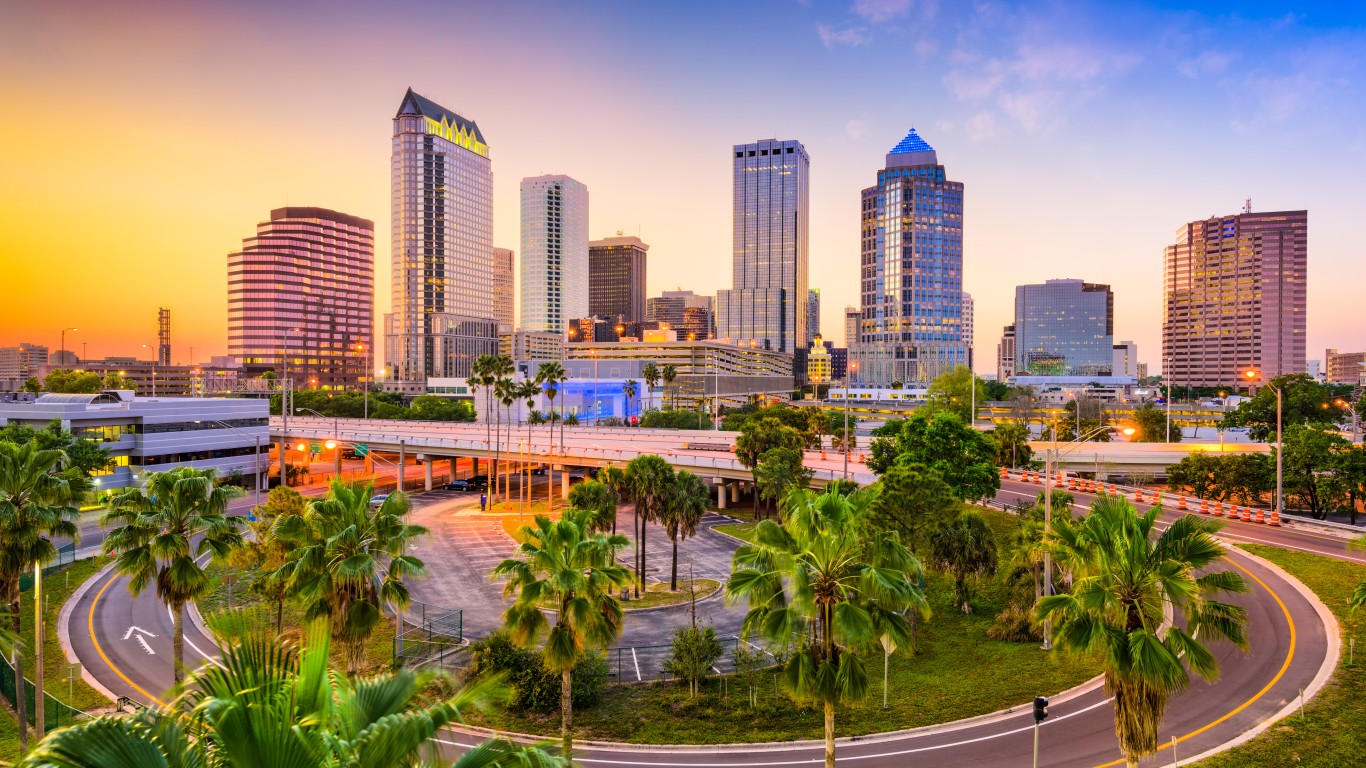
- Likelihood two random residents are different race or ethnicity: 74.7%
- Most prevalent race or ethnicity group: White (34.0%)
- Est. typical home value, Nov 2023: $731,185
- Est. population in 2022: 2,812
24. Metro West (Orlando, FL)
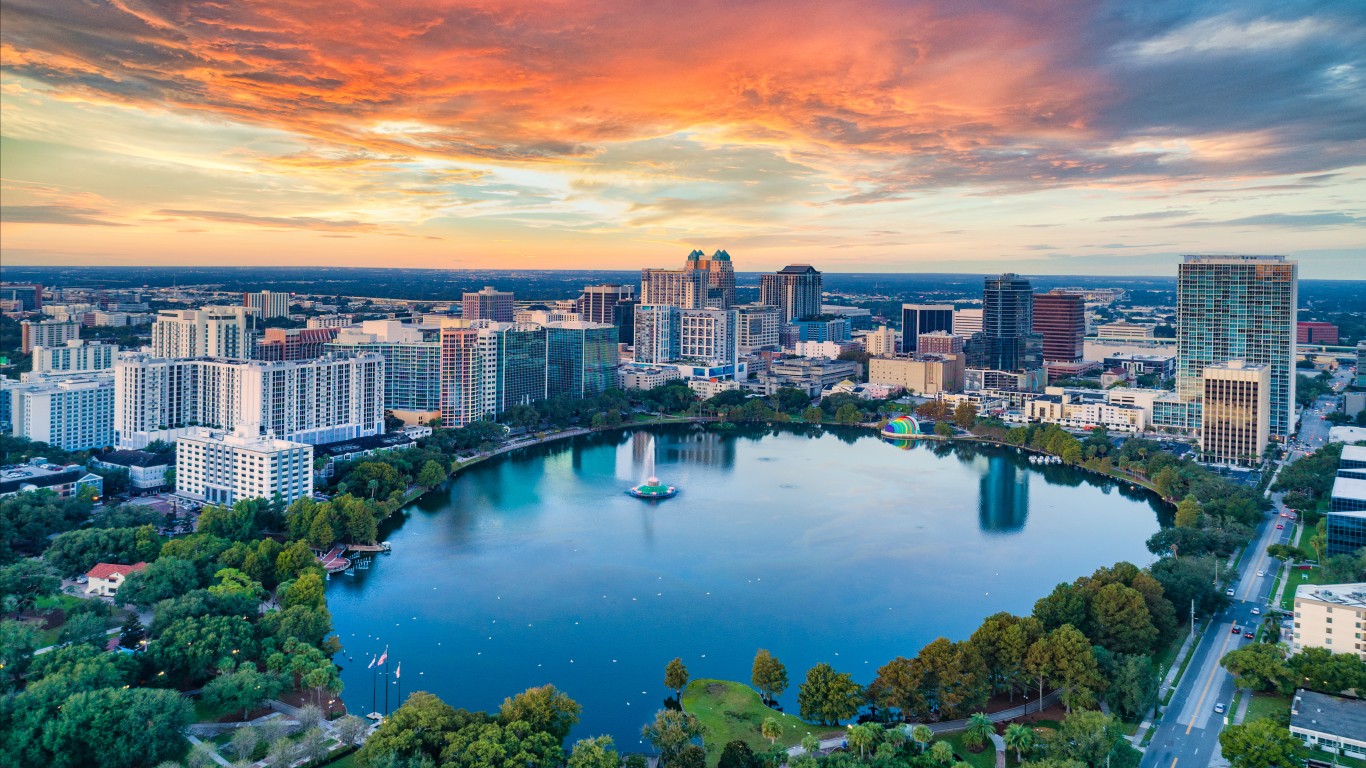
- Likelihood two random residents are different race or ethnicity: 74.7%
- Most prevalent race or ethnicity group: White (34.6%)
- Est. typical home value, Nov 2023: $250,548
- Est. population in 2022: 21,499
23. New Tampa (Tampa, FL)
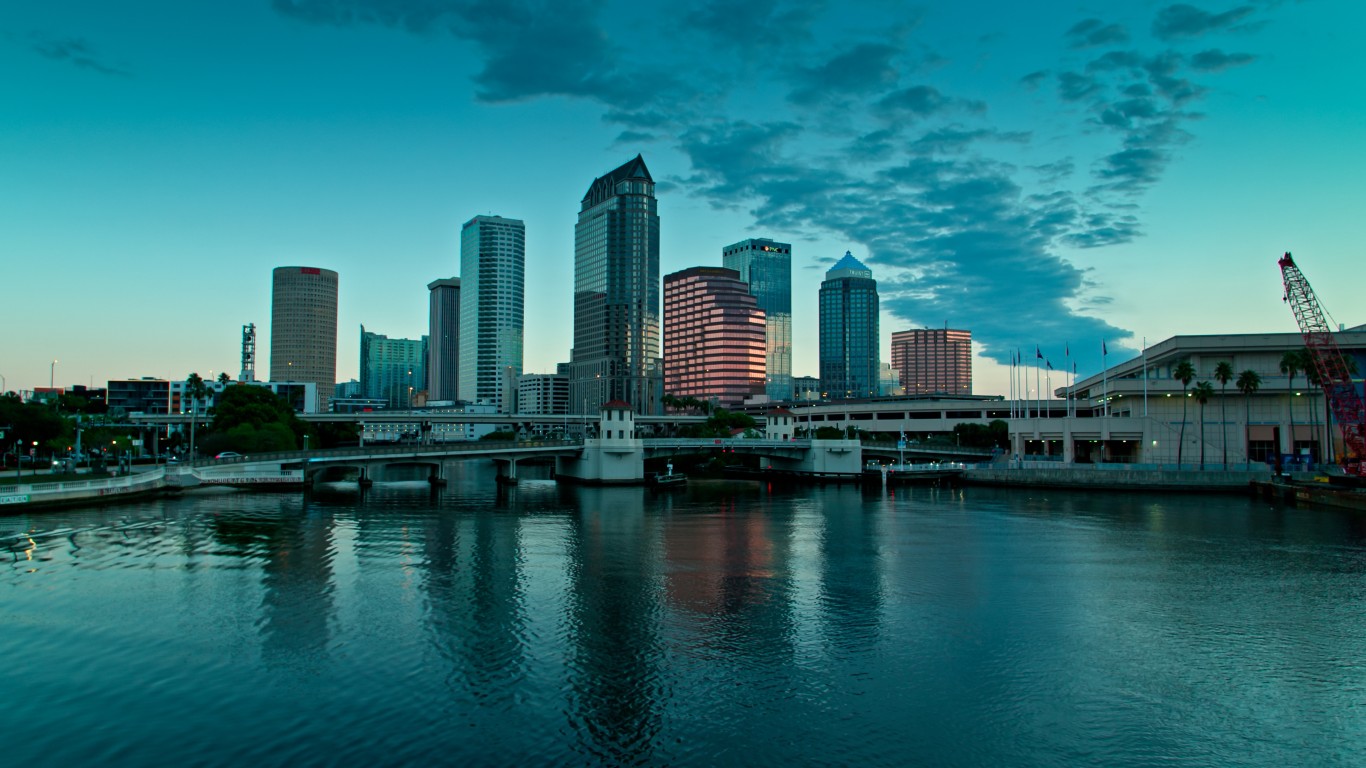
- Likelihood two random residents are different race or ethnicity: 74.8%
- Most prevalent race or ethnicity group: White (36.8%)
- Est. typical home value, Nov 2023: $485,677
- Est. population in 2022: 8,077
22. Avenel (Woodbridge Township, NJ)

- Likelihood two random residents are different race or ethnicity: 74.8%
- Most prevalent race or ethnicity group: White (34.1%)
- Est. typical home value, Nov 2023: N/A
- Est. population in 2022: 17,272
21. Mayfair (Philadelphia, PA)
- Likelihood two random residents are different race or ethnicity: 74.9%
- Most prevalent race or ethnicity group: White (36.1%)
- Est. typical home value, Nov 2023: $233,259
- Est. population in 2022: 37,549
20. Franklin Park (Franklin Township, NJ)
- Likelihood two random residents are different race or ethnicity: 75.1%
- Most prevalent race or ethnicity group: Asian (36.2%)
- Est. typical home value, Nov 2023: N/A
- Est. population in 2022: 5,994
19. High View Park (Arlington, VA)

- Likelihood two random residents are different race or ethnicity: 75.2%
- Most prevalent race or ethnicity group: White (40.2%)
- Est. typical home value, Nov 2023: $888,661
- Est. population in 2022: 1,251
18. Jamaica Estates (Queens, NY)
- Likelihood two random residents are different race or ethnicity: 75.4%
- Most prevalent race or ethnicity group: Asian (34.7%)
- Est. typical home value, Nov 2023: $1,033,199
- Est. population in 2022: 15,947
17. Maplewood (Malden, MA)
- Likelihood two random residents are different race or ethnicity: 75.6%
- Most prevalent race or ethnicity group: White (36.3%)
- Est. typical home value, Nov 2023: $600,223
- Est. population in 2022: 6,883
16. Richmond Hill (Queens, NY)
- Likelihood two random residents are different race or ethnicity: 75.7%
- Most prevalent race or ethnicity group: Hispanic or Latino (35.2%)
- Est. typical home value, Nov 2023: $705,915
- Est. population in 2022: 53,221
15. Hattontown (Reston, VA)
- Likelihood two random residents are different race or ethnicity: 75.7%
- Most prevalent race or ethnicity group: White (32.6%)
- Est. typical home value, Nov 2023: $602,757
- Est. population in 2022: 7,548
14. Woodlawn (Pawtucket, RI)
- Likelihood two random residents are different race or ethnicity: 75.9%
- Most prevalent race or ethnicity group: Hispanic or Latino (34.0%)
- Est. typical home value, Nov 2023: $325,147
- Est. population in 2022: 14,291
13. McGinley Square (Jersey City, NJ)
- Likelihood two random residents are different race or ethnicity: 76.0%
- Most prevalent race or ethnicity group: Hispanic or Latino (32.0%)
- Est. typical home value, Nov 2023: $402,803
- Est. population in 2022: 16,082
12. Fort Greene (Brooklyn, NY)
- Likelihood two random residents are different race or ethnicity: 76.0%
- Most prevalent race or ethnicity group: Black or African American (30.5%)
- Est. typical home value, Nov 2023: $1,165,392
- Est. population in 2022: 40,026
11. Douglas Park (Arlington, VA)
- Likelihood two random residents are different race or ethnicity: 76.0%
- Most prevalent race or ethnicity group: White (31.3%)
- Est. typical home value, Nov 2023: $657,695
- Est. population in 2022: 8,860
10. North Dorchester (Boston, MA)
- Likelihood two random residents are different race or ethnicity: 76.1%
- Most prevalent race or ethnicity group: White (35.7%)
- Est. typical home value, Nov 2023: $626,141
- Est. population in 2022: 23,271
9. Crestwood (Yonkers, NY)
- Likelihood two random residents are different race or ethnicity: 76.9%
- Most prevalent race or ethnicity group: Black or African American (29.8%)
- Est. typical home value, Nov 2023: $831,840
- Est. population in 2022: 4,014
8. Briarwood (Queens, NY)
- Likelihood two random residents are different race or ethnicity: 76.9%
- Most prevalent race or ethnicity group: Asian (28.1%)
- Est. typical home value, Nov 2023: $386,213
- Est. population in 2022: 29,795
7. Mont Pleasant (Schenectady, NY)
- Likelihood two random residents are different race or ethnicity: 77.3%
- Most prevalent race or ethnicity group: White (35.0%)
- Est. typical home value, Nov 2023: $169,060
- Est. population in 2022: 9,340
6. Faulkner (Malden, MA)
- Likelihood two random residents are different race or ethnicity: 77.5%
- Most prevalent race or ethnicity group: Asian (30.0%)
- Est. typical home value, Nov 2023: $531,098
- Est. population in 2022: 4,116
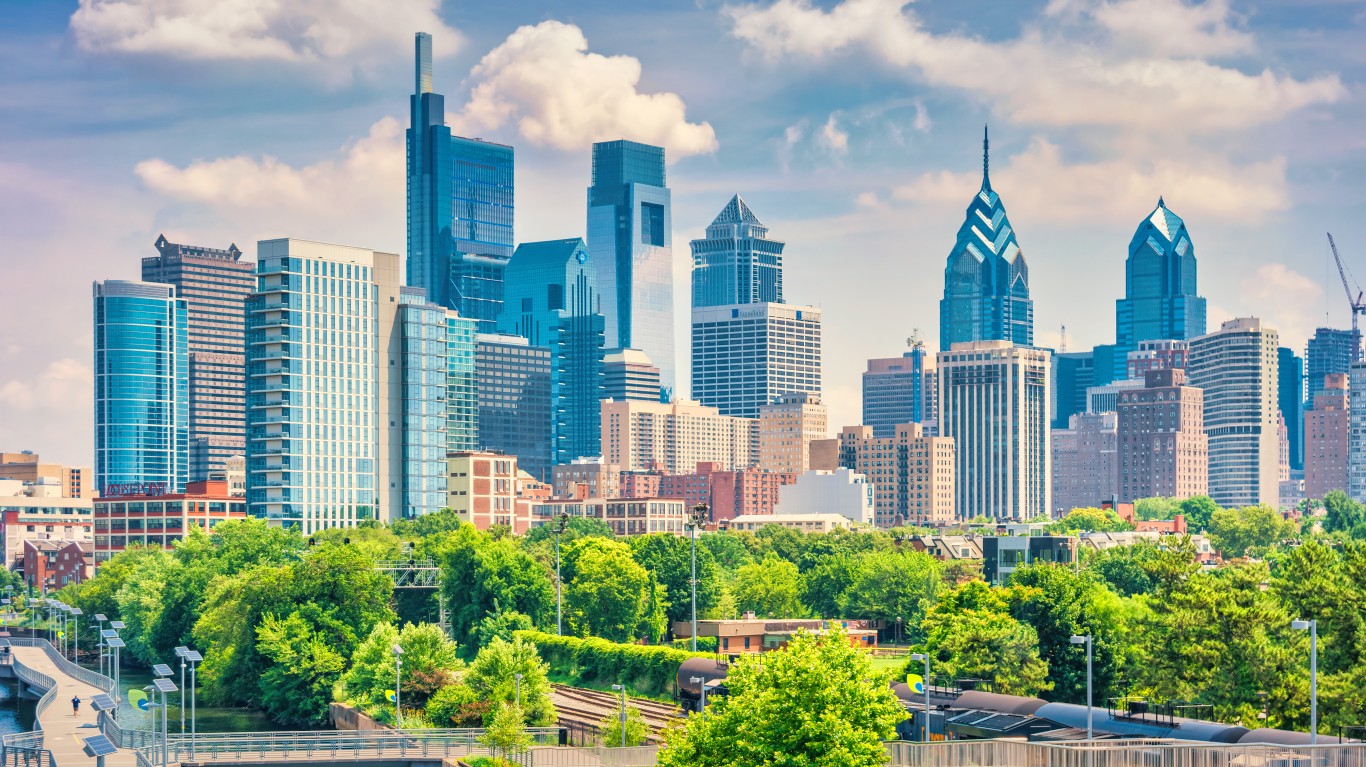
5. Oxford Circle (Philadelphia, PA)
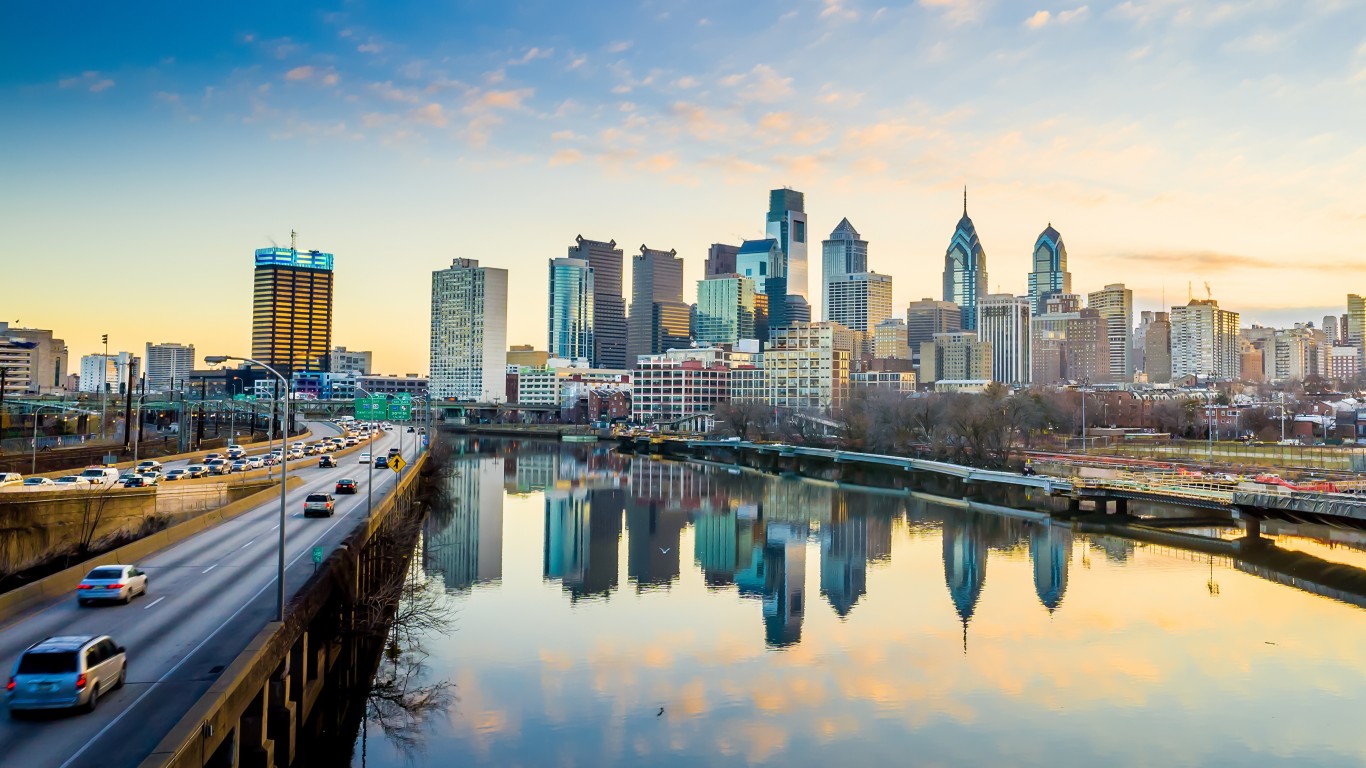
- Likelihood two random residents are different race or ethnicity: 77.5%
- Most prevalent race or ethnicity group: Hispanic or Latino (28.4%)
- Est. typical home value, Nov 2023: $218,408
- Est. population in 2022: 52,753
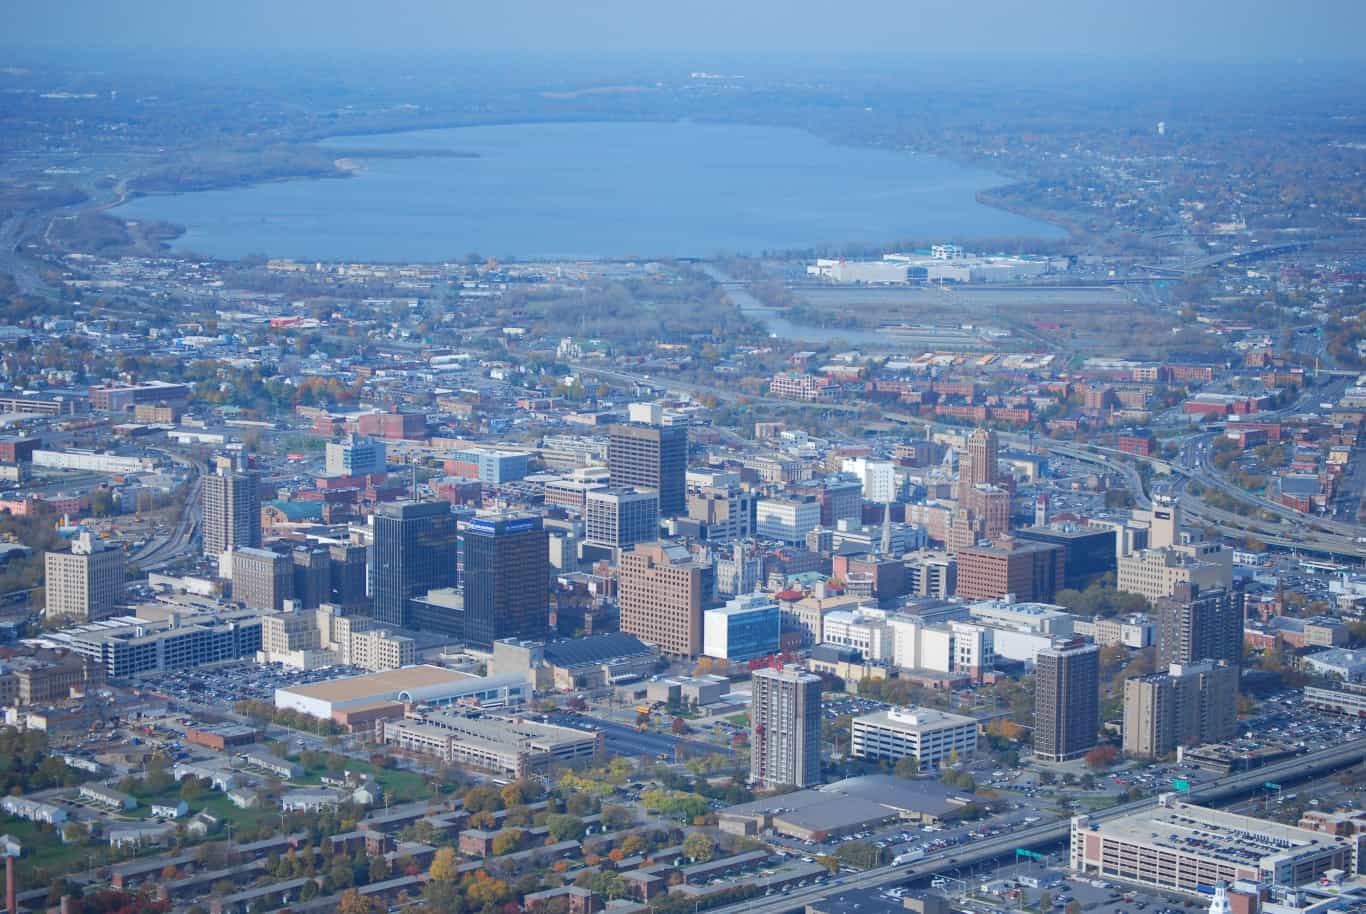
4. Brown Square (Rochester, NY)
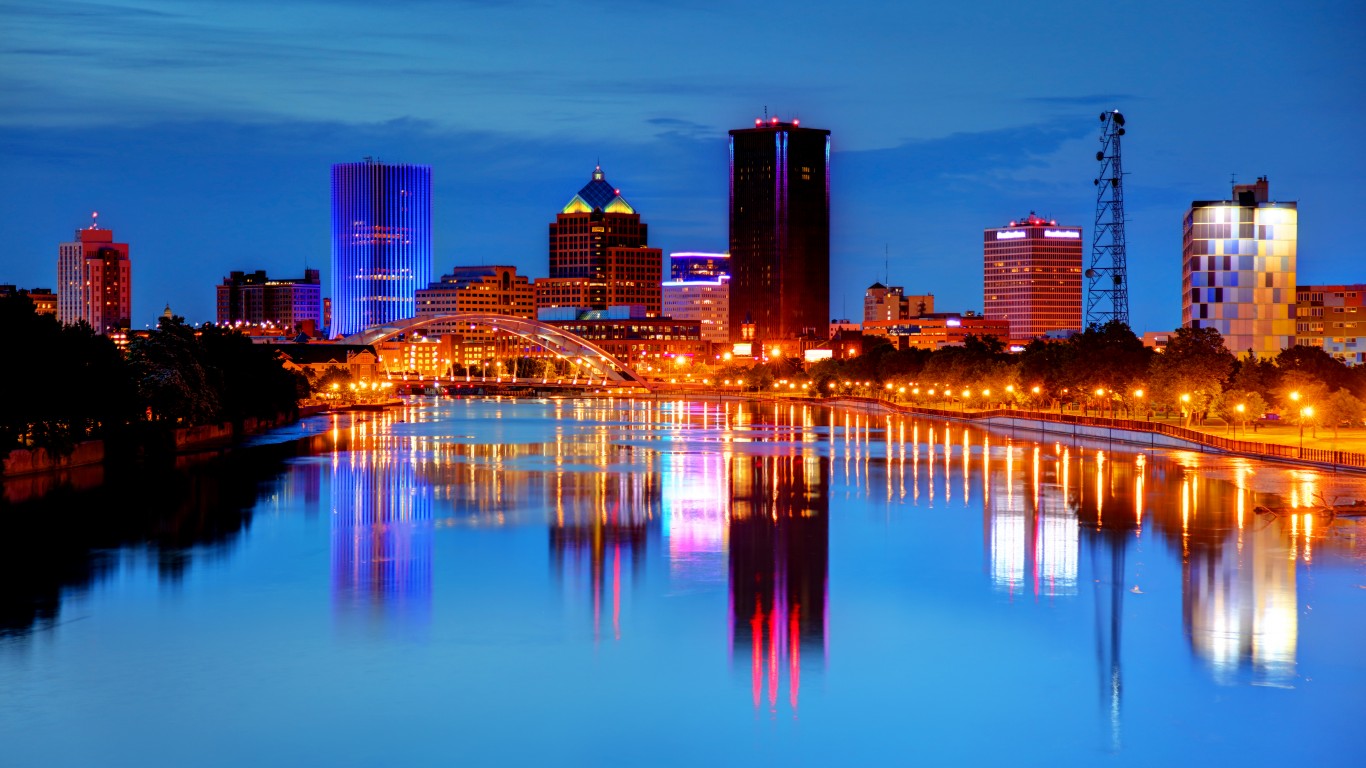
- Likelihood two random residents are different race or ethnicity: 77.9%
- Most prevalent race or ethnicity group: White (27.1%)
- Est. typical home value, Nov 2023: N/A
- Est. population in 2022: 1,559
3. Central State Street (Schenectady, NY)
- Likelihood two random residents are different race or ethnicity: 77.9%
- Most prevalent race or ethnicity group: Black or African American (31.3%)
- Est. typical home value, Nov 2023: $164,347
- Est. population in 2022: 3,399
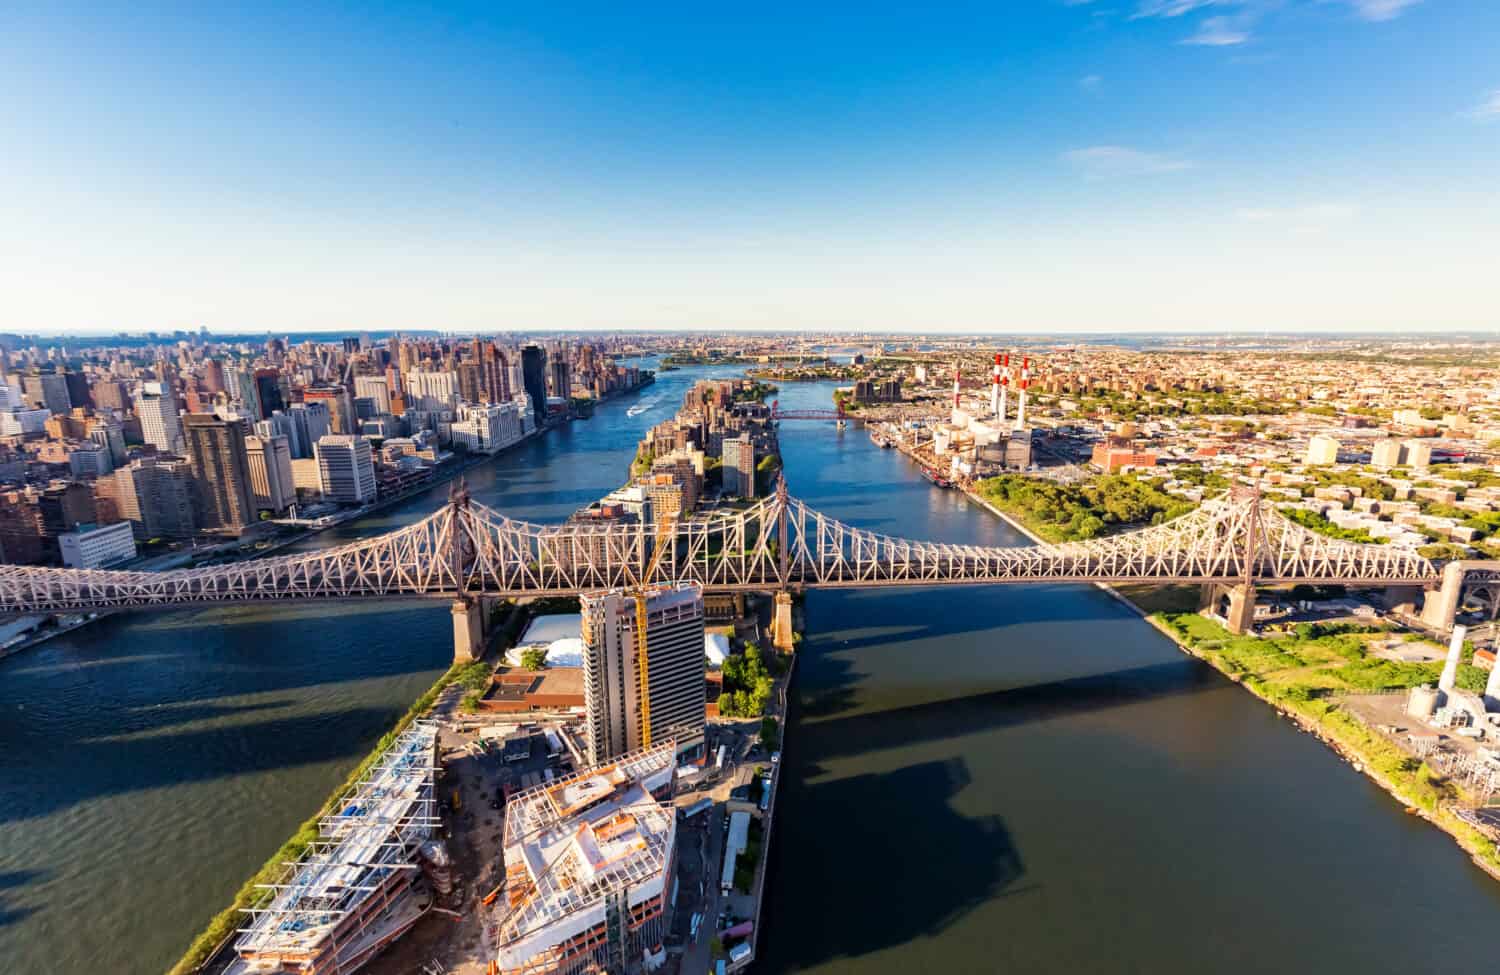
2. South Ozone Park (Queens, NY)
- Likelihood two random residents are different race or ethnicity: 79.3%
- Most prevalent race or ethnicity group: Asian (30.7%)
- Est. typical home value, Nov 2023: $671,736
- Est. population in 2022: 80,076
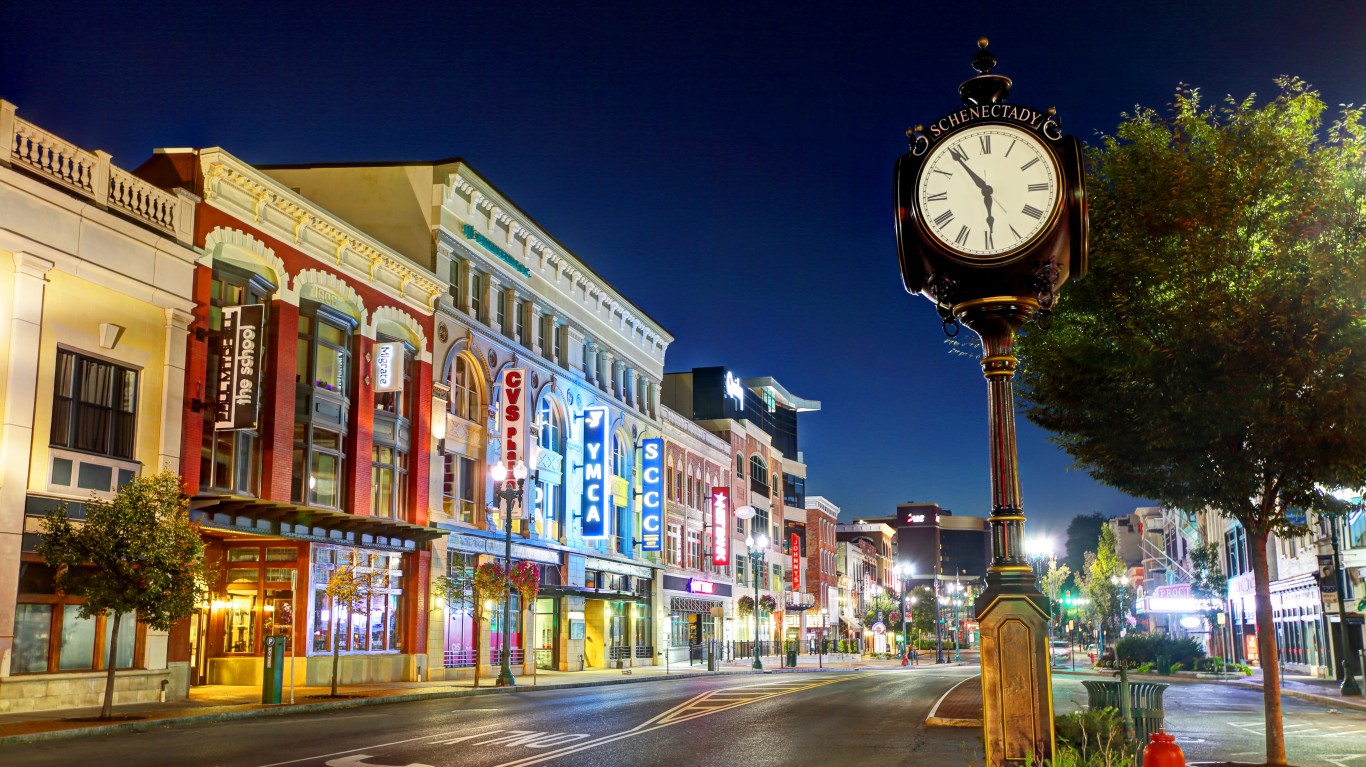
1. Vale and Hamilton Hill (Schenectady, NY)
- Likelihood two random residents are different race or ethnicity: 80.0%
- Most prevalent race or ethnicity group: Black or African American (28.8%)
- Est. typical home value, Nov 2023: $128,544
- Est. population in 2022: 6,397