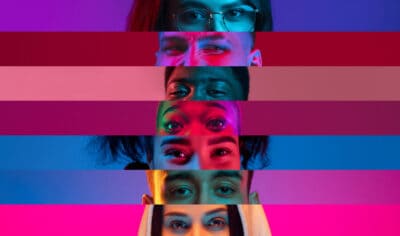
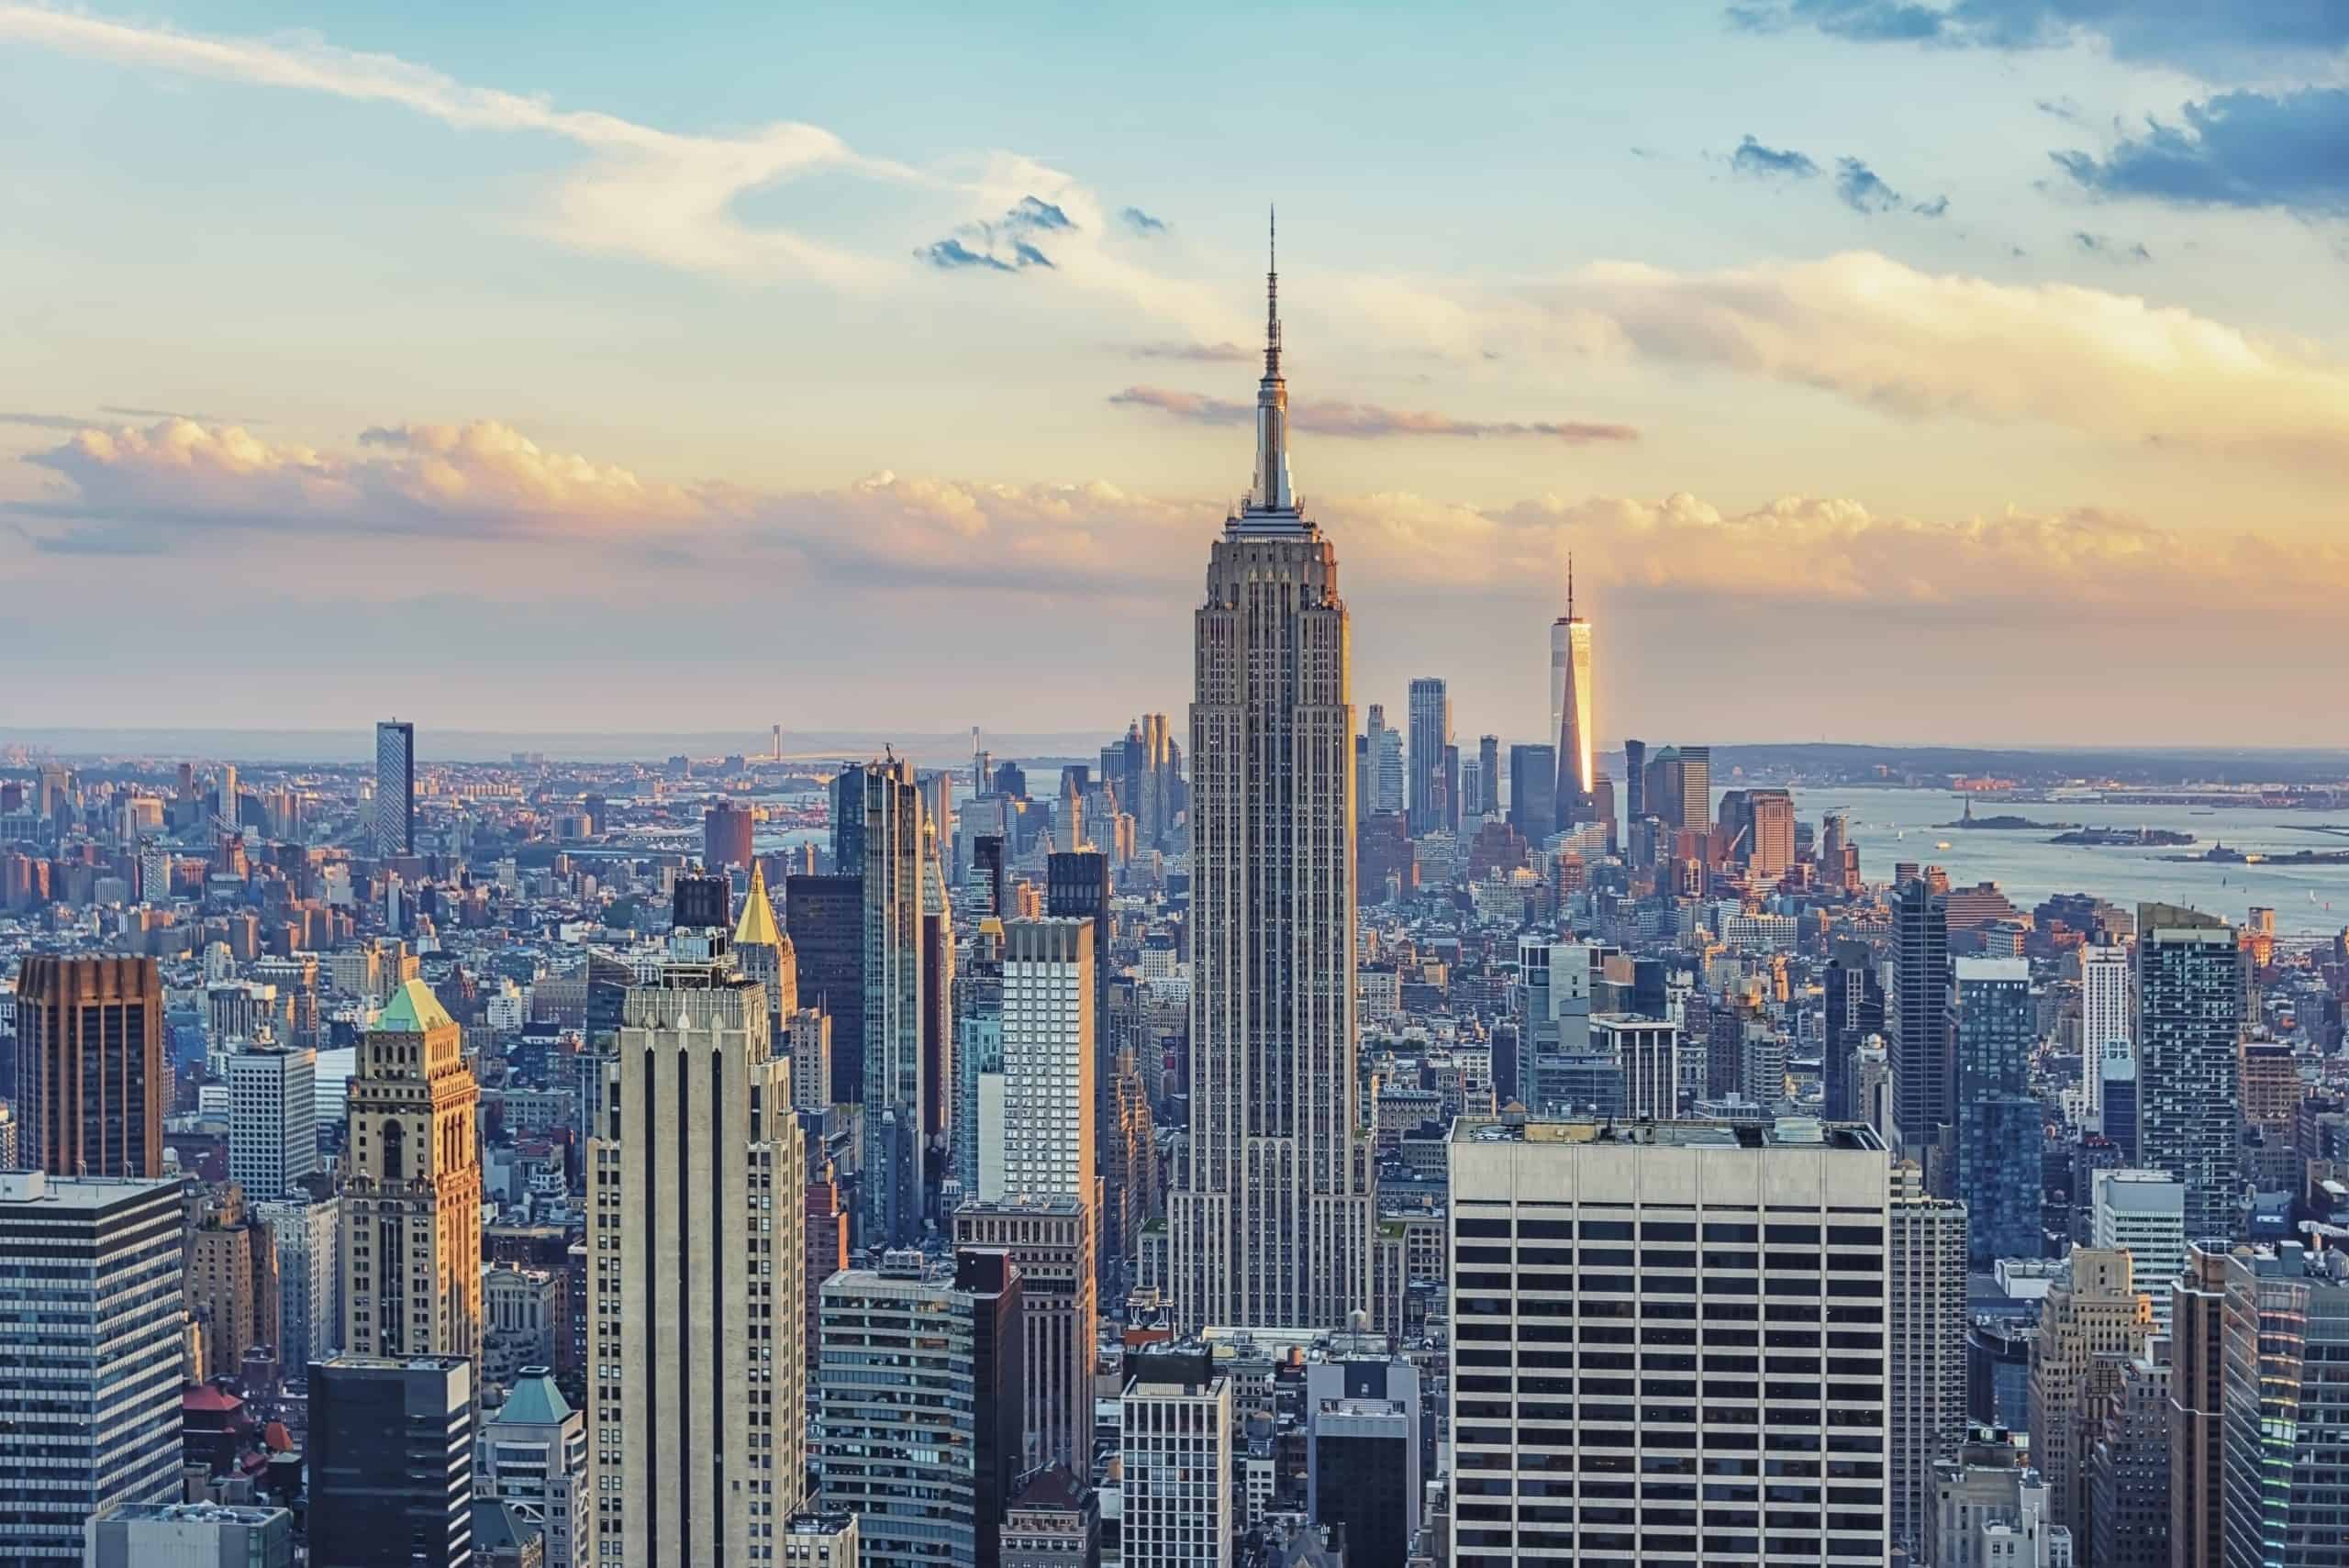
New York City is home to over 8 million people representing more than 800 languages and communities from nearly every nation. Its neighborhoods reflect generations of immigration. Famous and historic areas like Chinatown, Harlem, and Little Italy meet vibrant, more-modern hubs home to Caribbean, South Asian, Latin American, Middle Eastern, and Eastern European populations. This diversity is visible in the city’s food, music, festivals, art, and even day-to-day life. These overlapping cultures create a unique web of traditions and identities, making NYC a place where countless cultures coexist and continue to shape one another.
To determine the most diverse neighborhoods in New York City, 24/7 Tempo reviewed five-year data on race and ethnicity from the U.S. Census Bureau’s 2022 American Community Survey. Neighborhoods were ranked based on the probability that two residents picked at random would be of different races or ethnicities. The same method is used in the USA Today Diversity Index as well as the racial and ethnic diversity index of the Disseminating Diversity Working Group of the Census Bureau. Data on population by race and ethnicity were aggregated from the census tract level to the neighborhood level using 2022 census tract boundary definitions from the U.S. Census Bureau and 2017 neighborhood boundary definitions from Zillow.
This post was updated on December 4, 2025 to provide a brief overview of the extent of NYC’s diversity and why it is important to recognize and celebrate these cultures.
Why Is This Important?
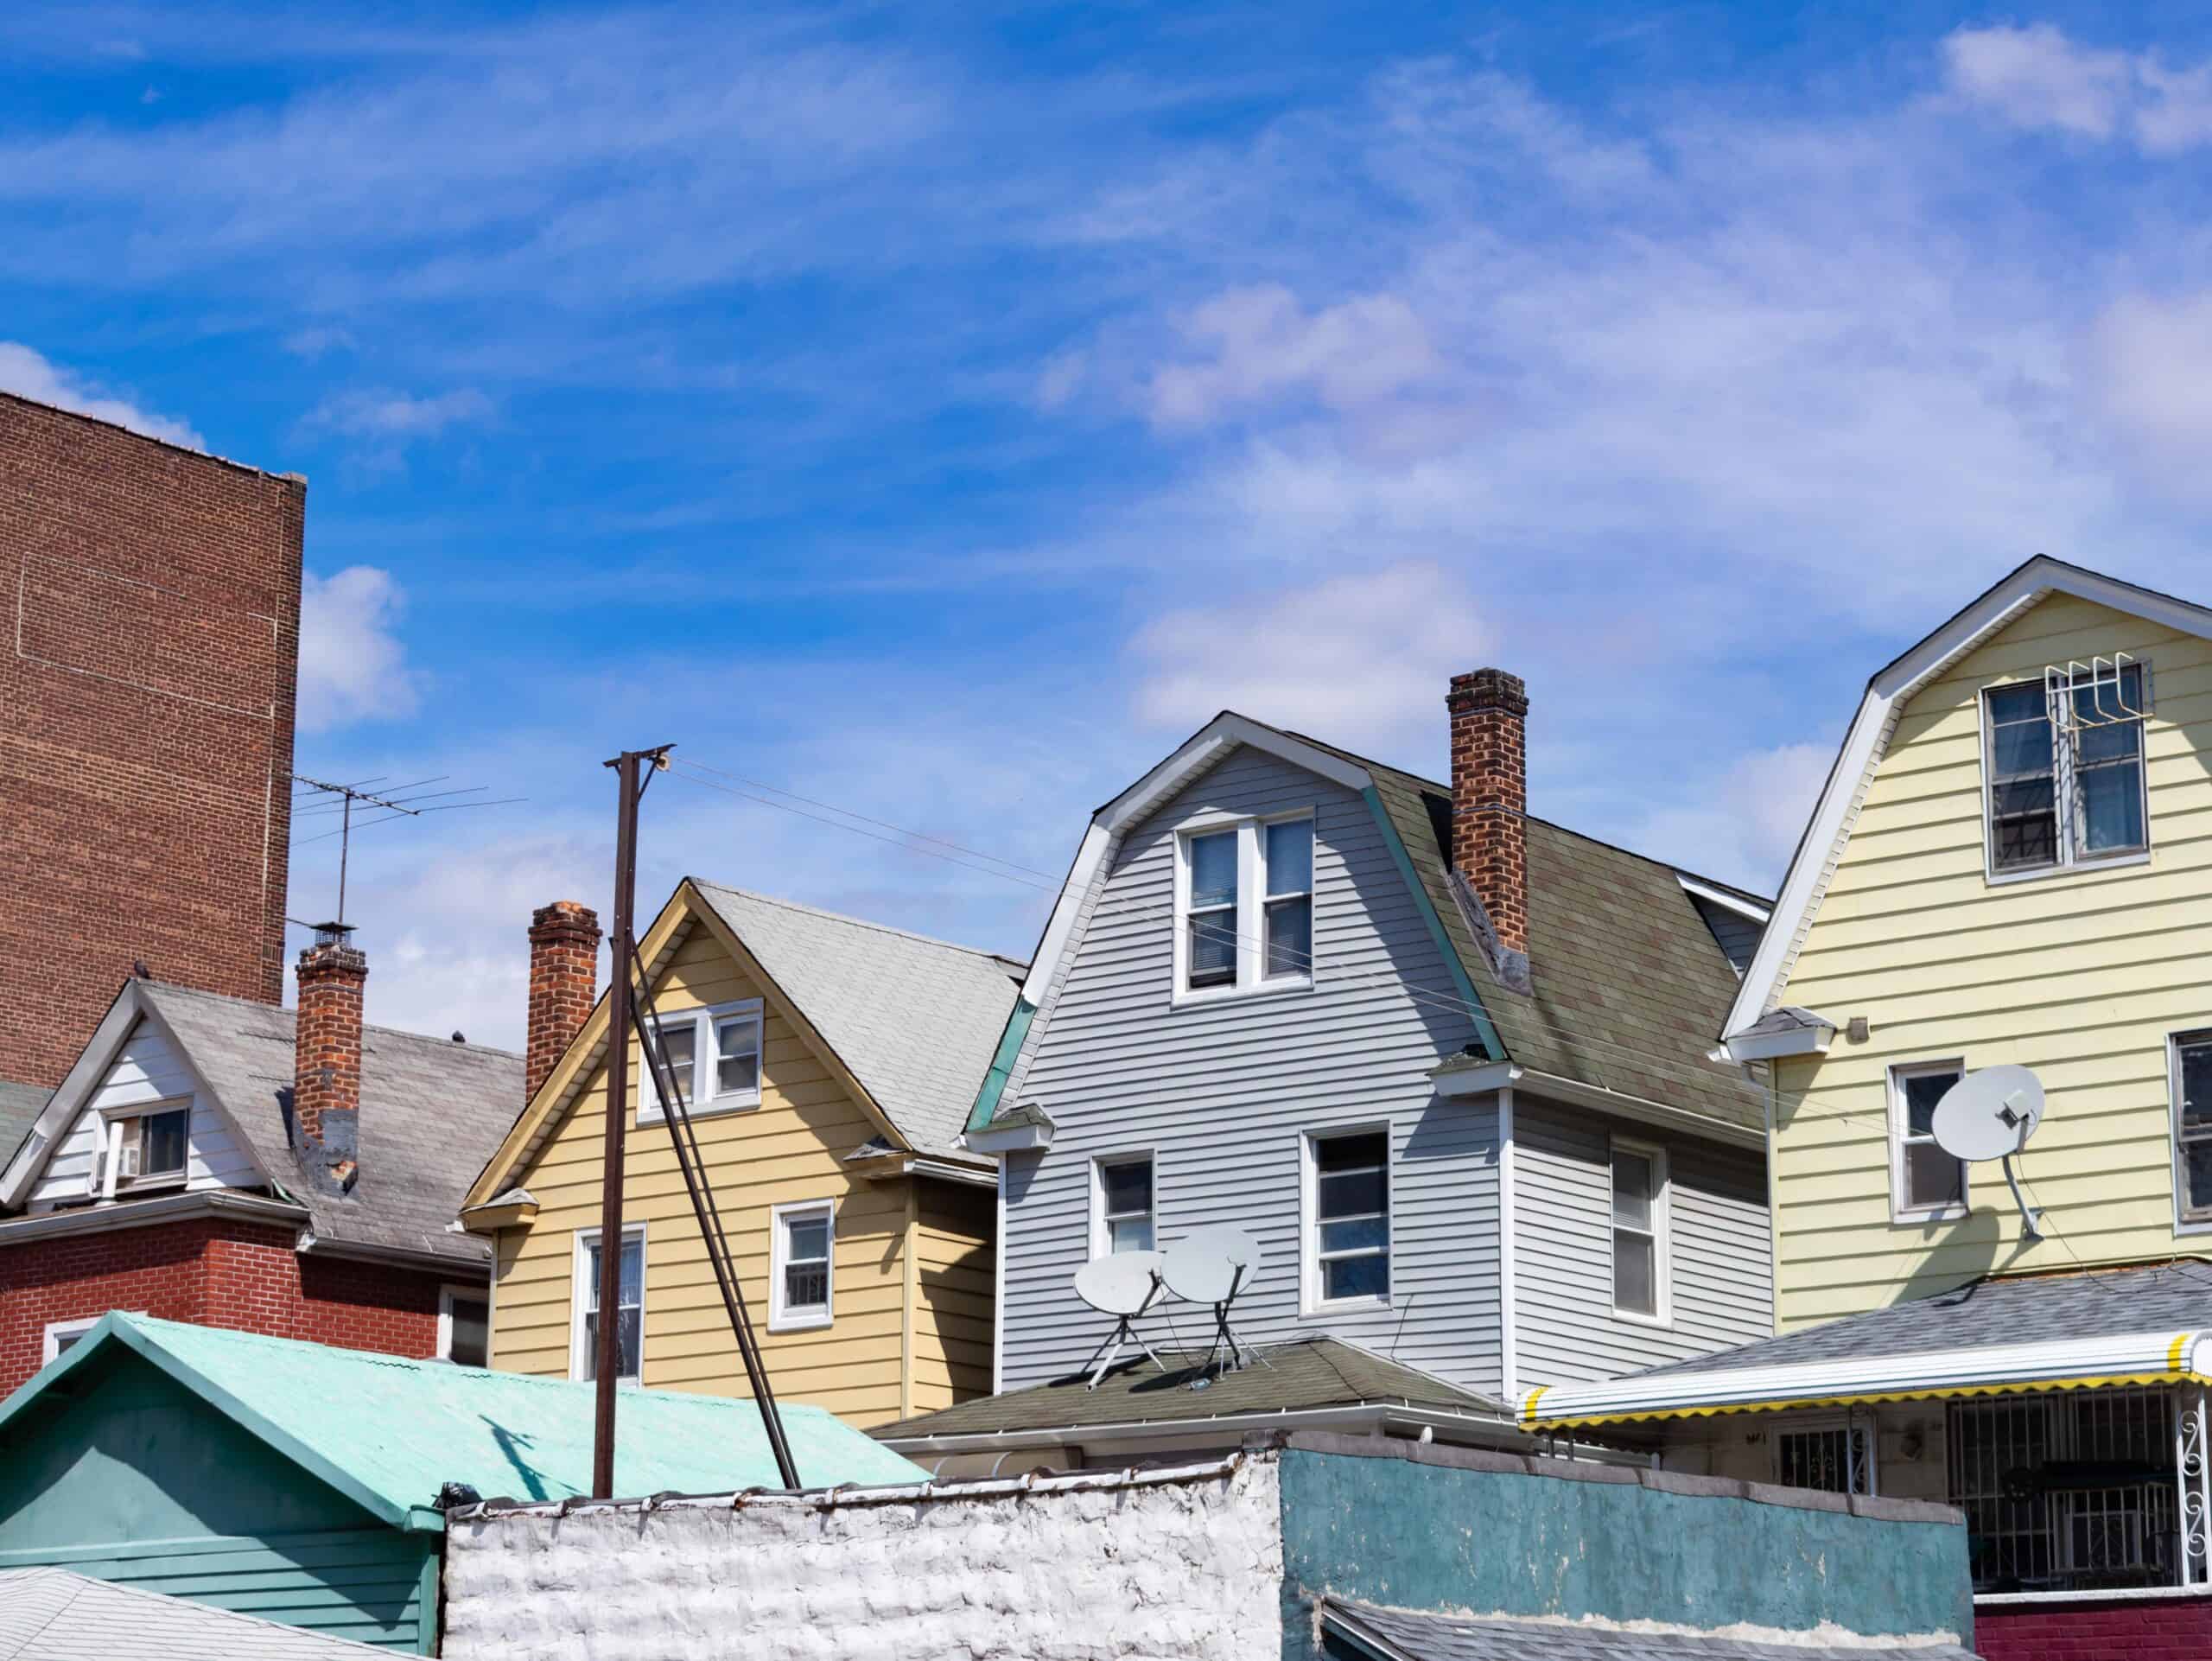
New York City is widely known as one of the most culturally diverse cities in the world, and this diversity is expressed every day in its neighborhoods. By highlighting 50 of these culturally rich communities, we’re offering readers a look at the people, traditions, languages, and histories that define America’s largest city and her unique character. Understanding where this cultural diversity exists helps both locals and visitors appreciate the city beyond its most frequented tourist areas. These neighborhoods are home to multigenerational immigrant communities, newer enclaves, and a great mix of cultural identities where food, music, and traditions intertwine. It is important to recognize and celebrate these cultural hubs that contribute to one of our greatest cities.
50. Woodside (Queens)
- The likelihood that two random residents are of different races or ethnicities: 67.1%
- The most prevalent race or ethnicity group: Asian (38.7%)
- Est. typical home value in Nov 2023: $437,772
- Est. population in 2022: 46,138
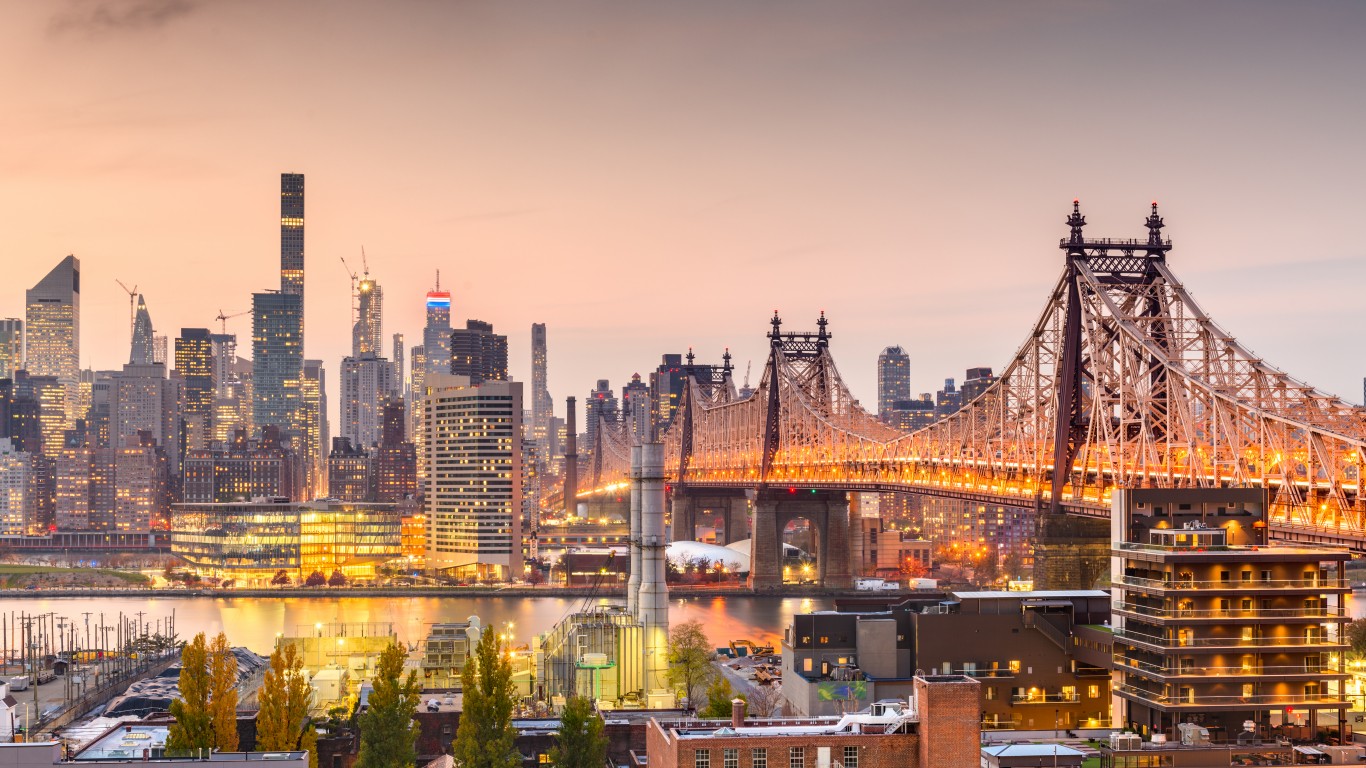
49. Hunters Point (Queens)
- The likelihood that two random residents are of different races or ethnicities: 67.2%
- The most prevalent race or ethnicity group: White (45.6%)
- Est. typical home value in Nov 2023: N/A
- Est. population in 2022: 25,531
48. College Point (Queens)
- The likelihood that two random residents are of different race or ethnicity: 67.2%
- The most prevalent race or ethnicity group: Hispanic or Latino (39.5%)
- Est. typical home value in Nov 2023: $782,125
- Est. population in 2022: 18,600
46. Bath Beach (Brooklyn)
- The likelihood that two random residents are of different races or ethnicities: 67.5%
- The most prevalent race or ethnicity group: White (41.8%)
- Est. typical home value in Nov 2023: $740,843
- Est. population in 2022: 47,624
45. Astoria (Queens)
- The likelihood that two random residents are of different race or ethnicity: 67.8%
- The most prevalent race or ethnicity group: White (47.2%)
- Est. typical home value in Nov 2023: $664,069
- Est. population in 2022: 158,380
44. Mariner’s Harbor (Staten Island)
- The likelihood that two random residents are of different races or ethnicities: 67.8%
- The most prevalent race or ethnicity group: Hispanic or Latino (41.7%)
- Est. typical home value in Nov 2023: $499,284
- Est. population in 2022: 13,565
43. Red Hook (Brooklyn)
- The likelihood that two random residents are of different races or ethnicity: 67.9%
- The most prevalent race or ethnicity group: Black or African American (42.0%)
- Est. typical home value in Nov 2023: $1,720,589
- Est. population in 2022: 9,295
42. Bedford Stuyvesant (Brooklyn)
- The likelihood that two random residents are of different races or ethnicities: 68.0%
- The most prevalent race or ethnicity group: Black or African American (45.7%)
- Est. typical home value in Nov 2023: $924,648
- Est. population in 2022: 180,911
41. Queens Village (Queens)

- The likelihood that two random residents are of different races or ethnicities: 68.0%
- The most prevalent race or ethnicity group: Black or African American (49.7%)
- Est. typical home value in Nov 2023: $681,609
- Est. population in 2022: 55,911
40. Downtown (Brooklyn)
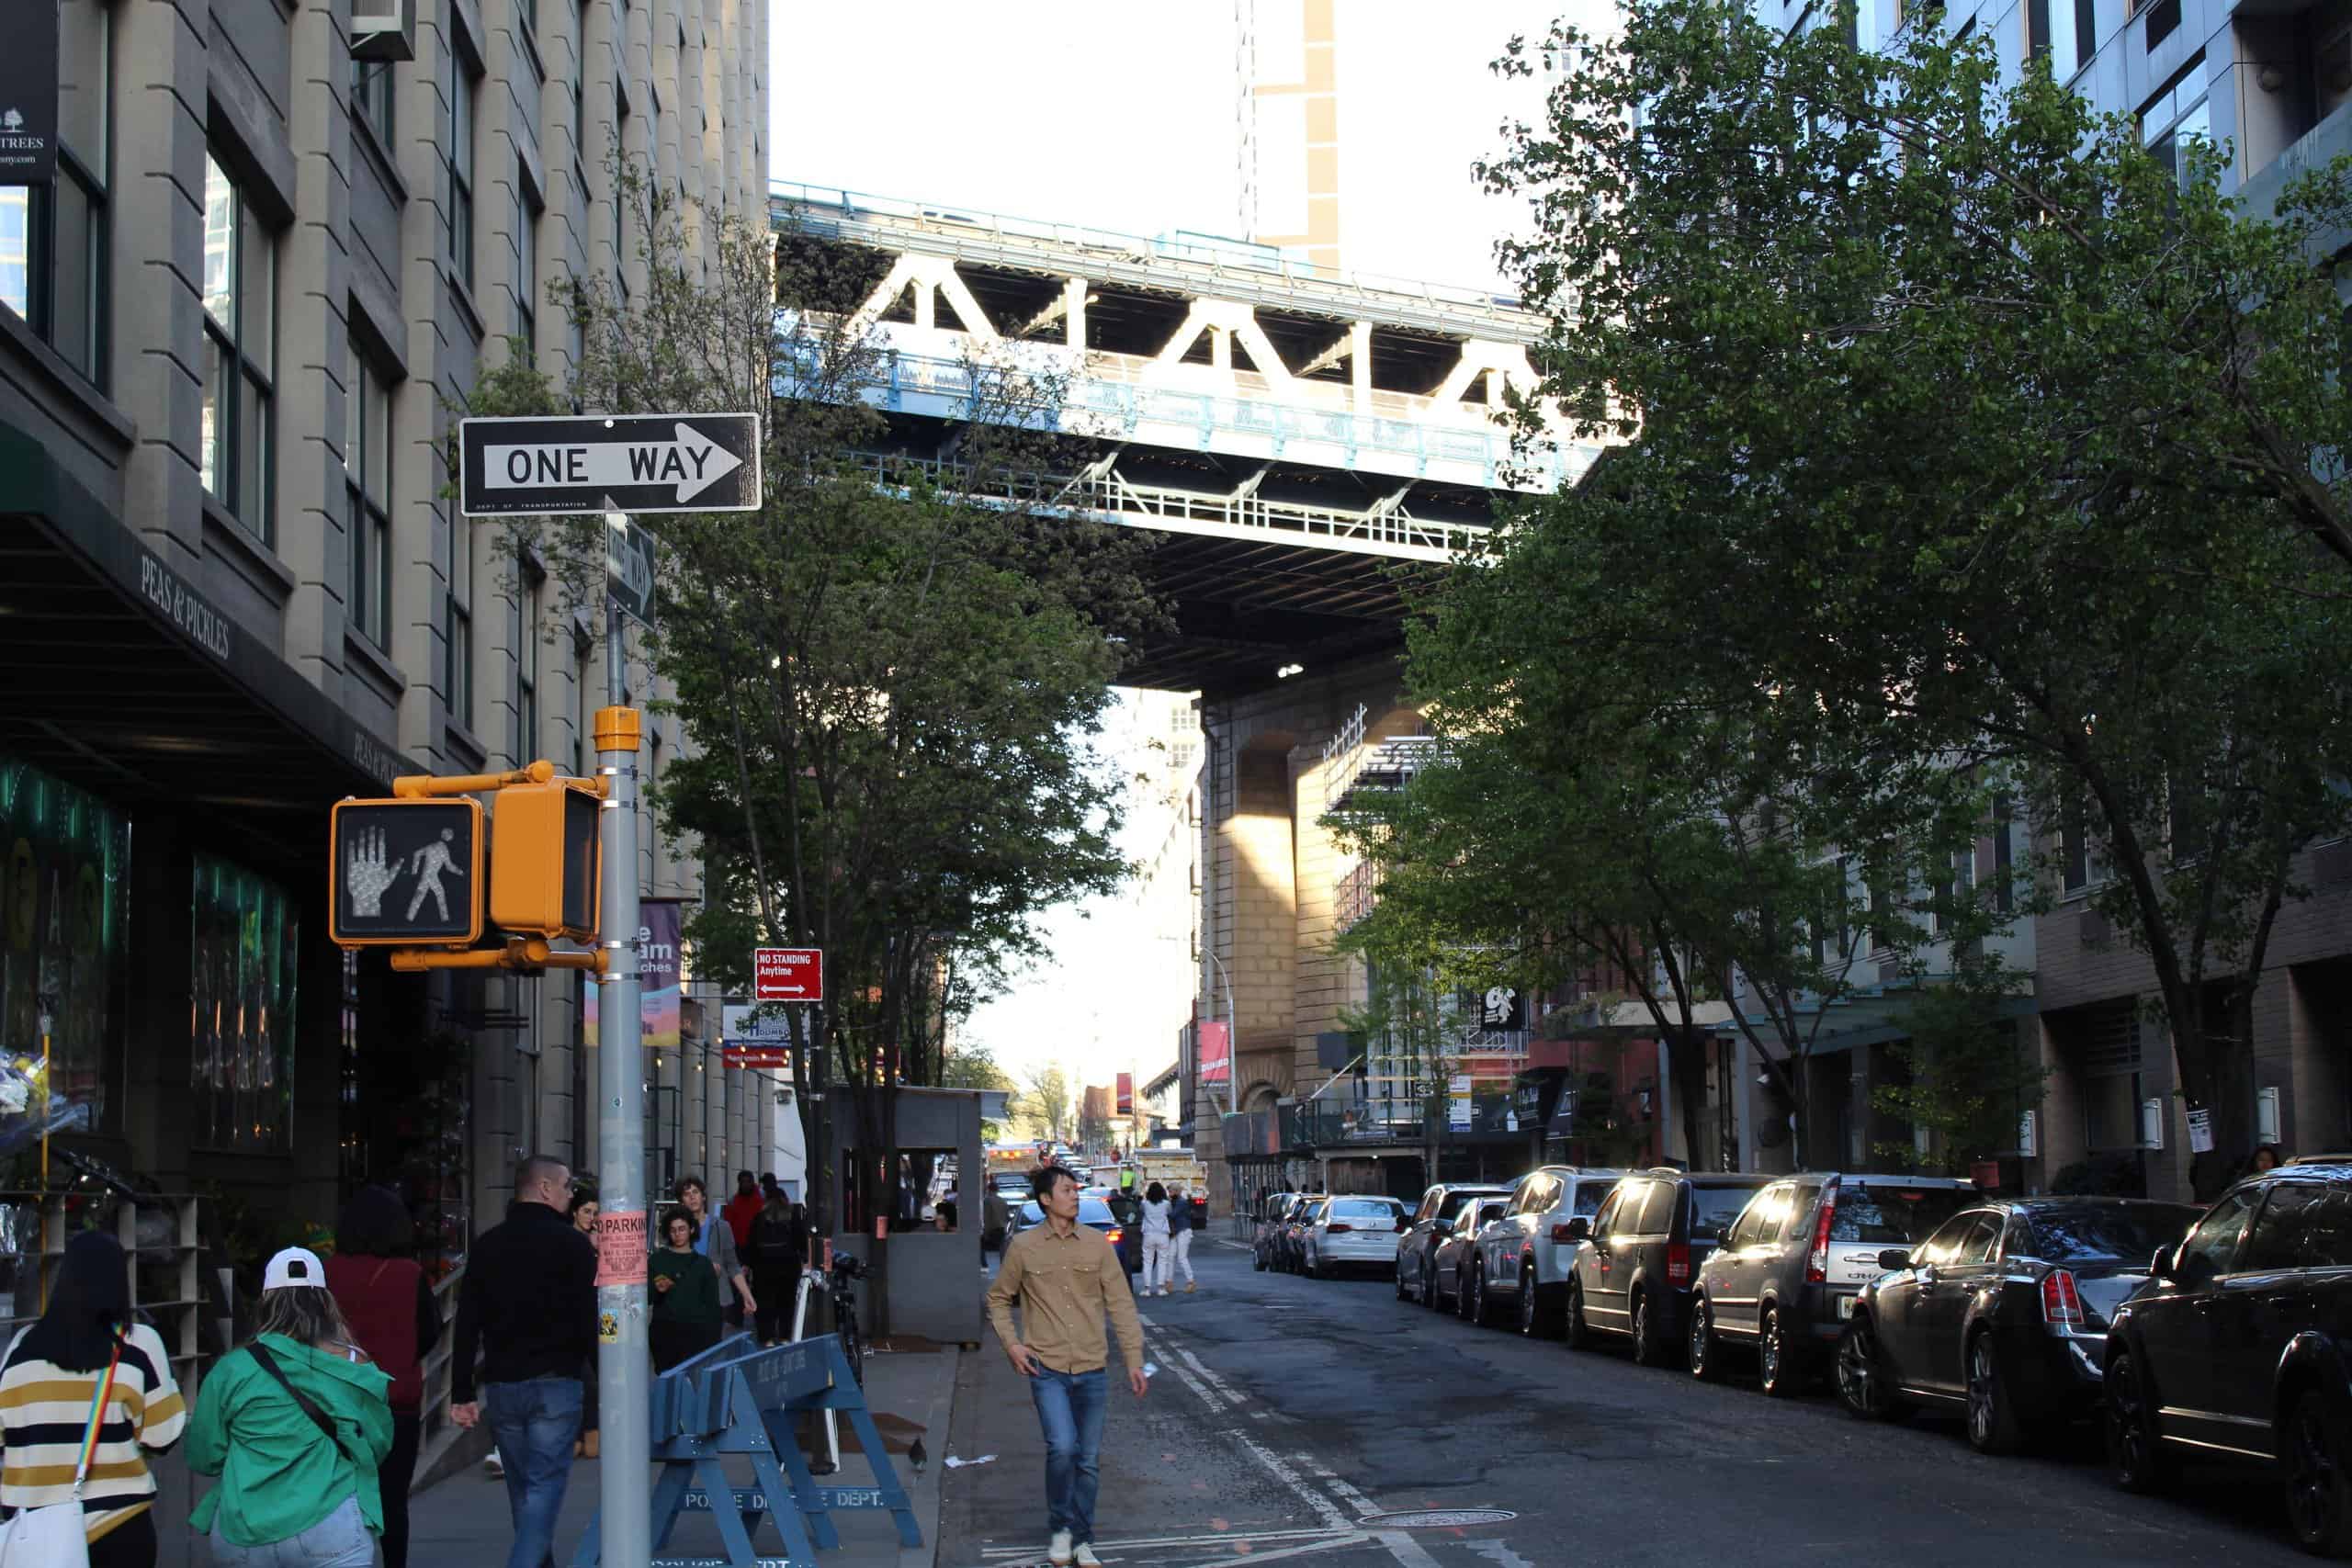
- The likelihood that two random residents are of different races or ethnicities: 68.5%
- The most prevalent race or ethnicity group: White (47.2%)
- Est. typical home value in Nov 2023: $942,463
- Est. population in 2022: 12,343
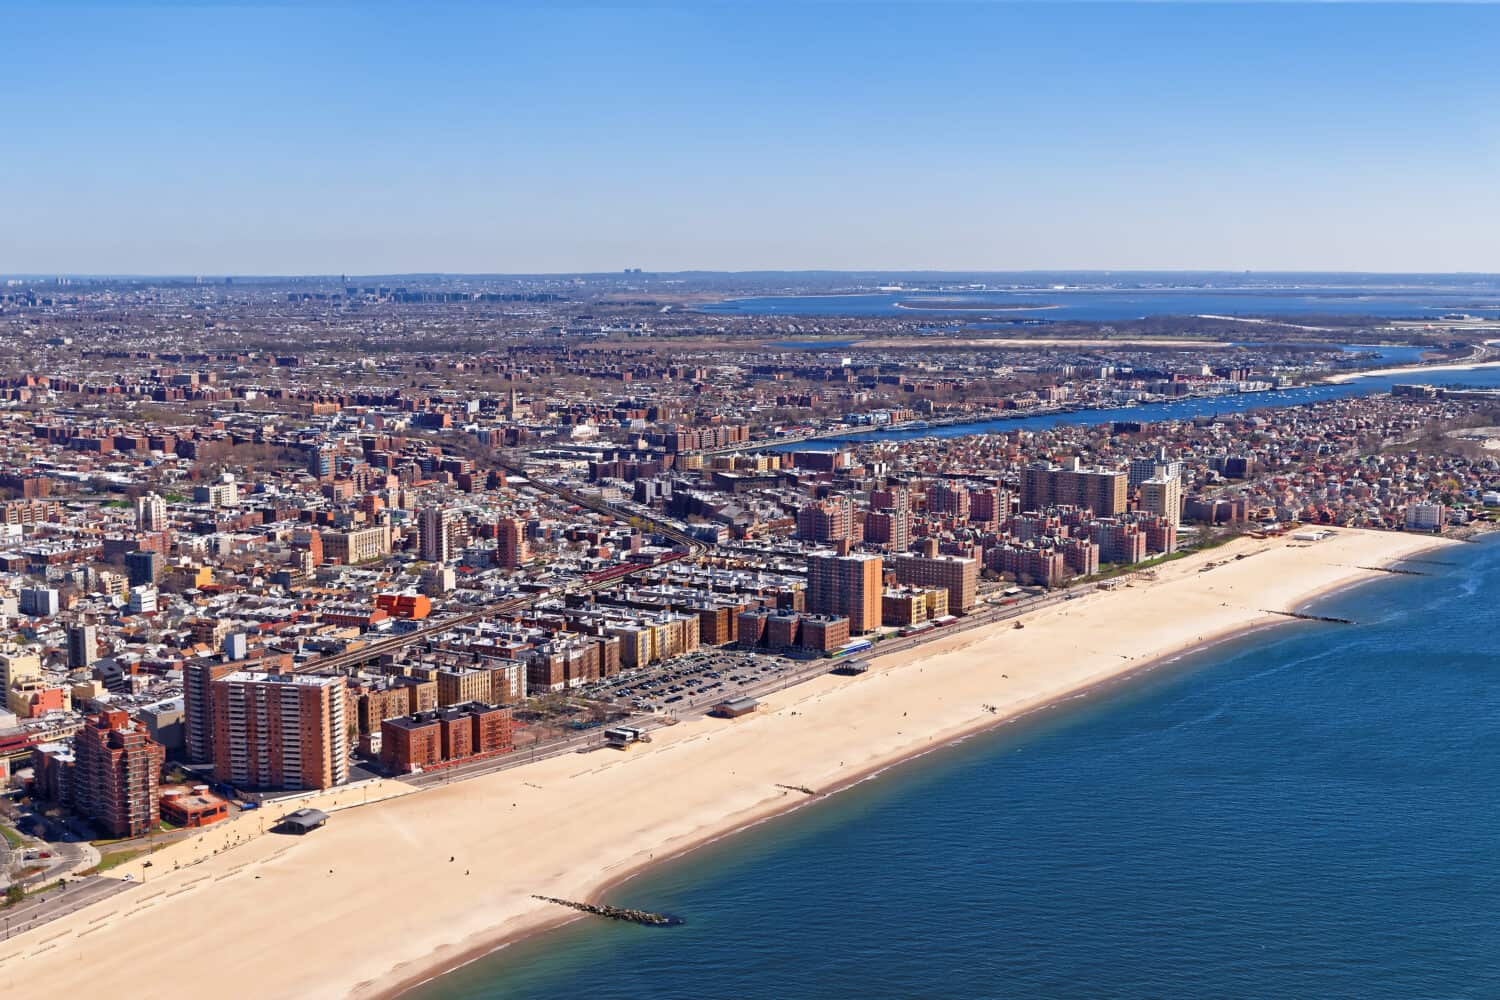
39. Coney Island (Brooklyn)
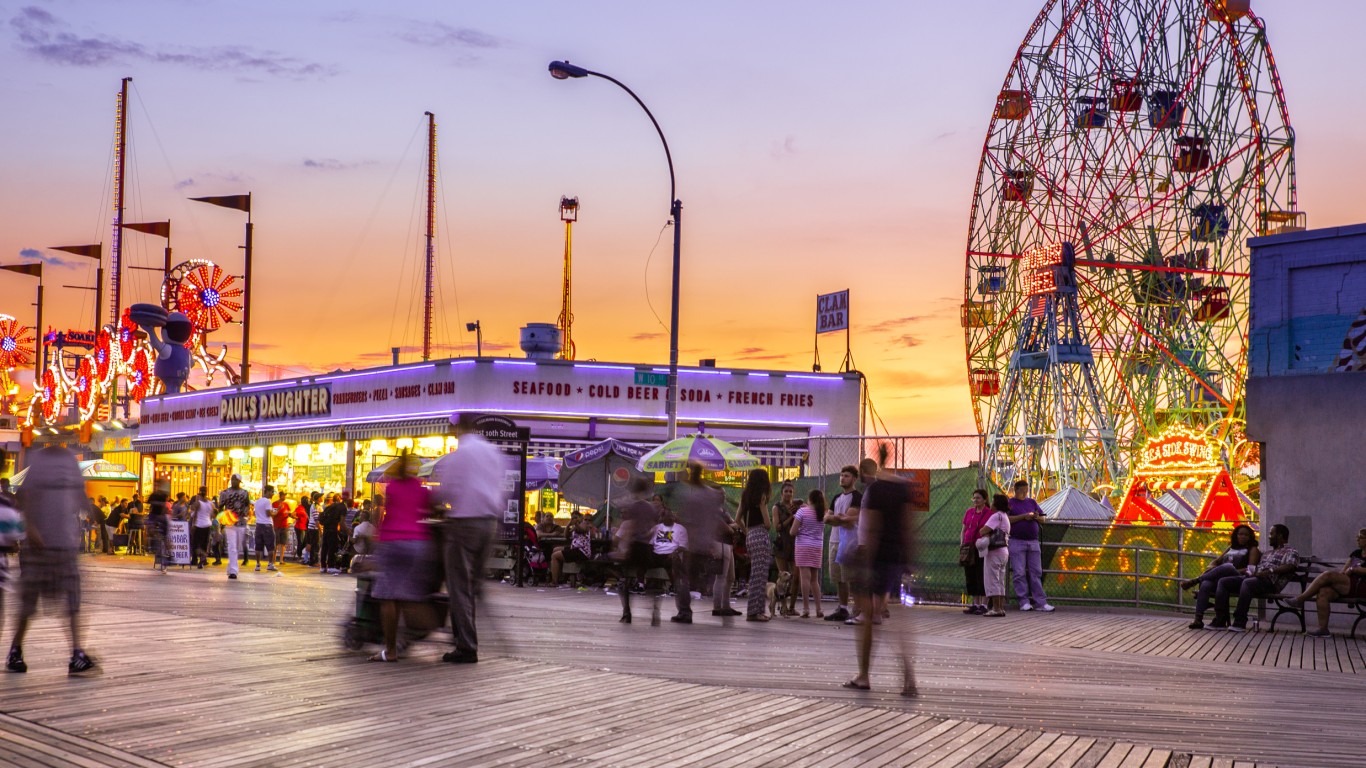
- The likelihood that two random residents are of different races or ethnicities: 68.6%
- The most prevalent race or ethnicity group: White (47.2%)
- Est. typical home value in Nov 2023: $501,281
- Est. population in 2022: 46,030
38. East Harlem (Manhattan)
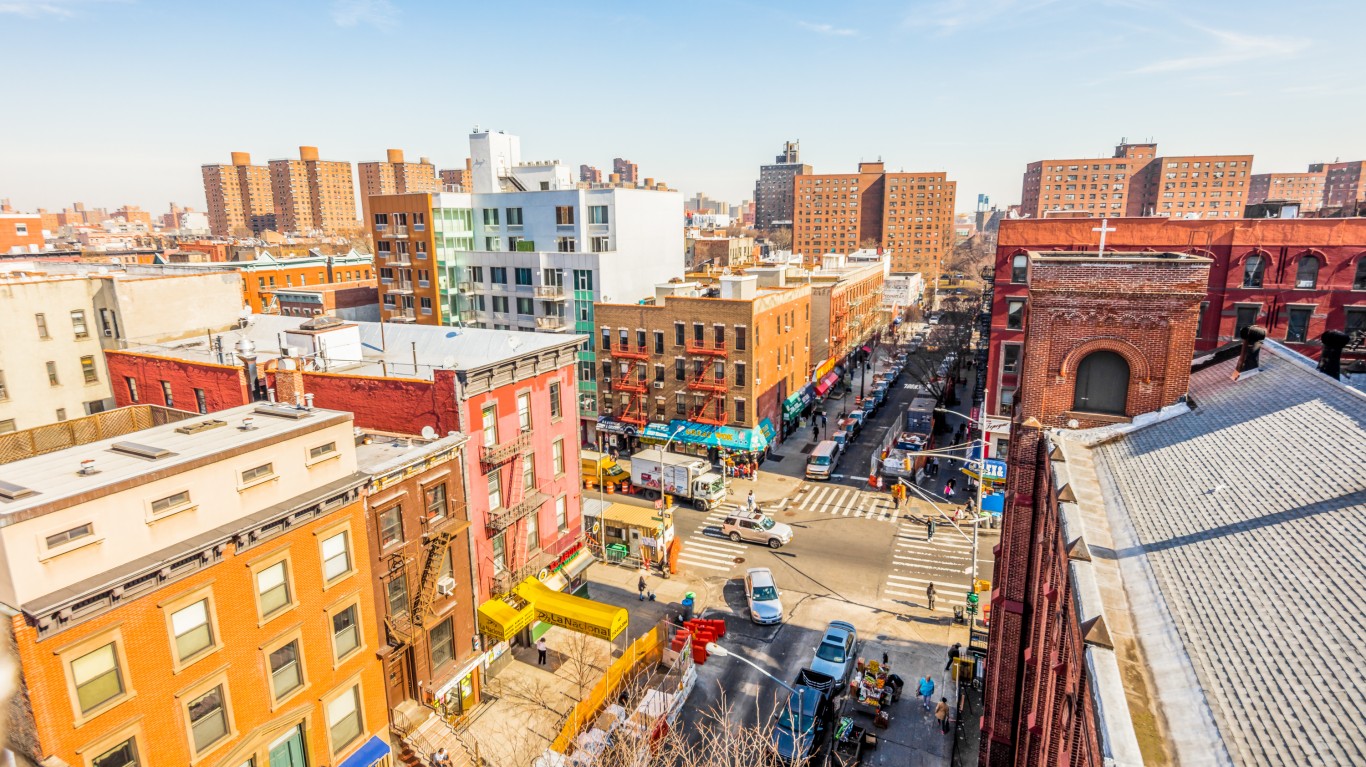
- The likelihood that two random residents are of different races or ethnicities: 68.7%
- The most prevalent race or ethnicity group: Hispanic or Latino (43.8%)
- Est. typical home value in Nov 2023: $626,584
- Est. population in 2022: 111,071
37. Elm Park (Staten Island)
- The likelihood that two random residents are of different races or ethnicities: 68.7%
- The most prevalent race or ethnicity group: Hispanic or Latino (47.7%)
- Est. typical home value in Nov 2023: $530,308
- Est. population in 2022: 2,173
36. Clinton Hill (Brooklyn)

- The likelihood that two random residents are of different race or ethnicity: 68.8%
- The most prevalent race or ethnicity group: White (47.4%)
- Est. typical home value in Nov 2023: $937,882
- Est. population in 2022: 24,403
35. Morris Park (Bronx)
- The likelihood that two random residents are of different races or ethnicity: 68.9%
- The most prevalent race or ethnicity group: Hispanic or Latino (45.3%)
- Est. typical home value in Nov 2023: $675,674
- Est. population in 2022: 34,673
34. Park Hill (Staten Island)
- The likelihood that two random residents are of different race or ethnicity: 69.3%
- The most prevalent race or ethnicity group: Black or African American (43.0%)
- Est. typical home value in Nov 2023: $499,419
- Est. population in 2022: 9,231
33. Kensington (Brooklyn)
- The likelihood that two random residents are of different races or ethnicities: 69.3%
- The most prevalent race or ethnicity group: White (46.7%)
- Est. typical home value in Nov 2023: $654,074
- Est. population in 2022: 47,352
32. Port Morris (Bronx)
- The likelihood that two random residents are of different races or ethnicities: 69.5%
- The most prevalent race or ethnicity group: Hispanic or Latino (42.3%)
- Est. typical home value in Nov 2023: N/A
- Est. population in 2022: 3,775
30. Port Richmond (Staten Island)
- The likelihood that two random residents are of different races or ethnicities: 69.8%
- The most prevalent race or ethnicity group: Hispanic or Latino (41.3%)
- Est. typical home value in Nov 2023: $554,158
- Est. population in 2022: 14,236
29. Clifton (Staten Island)
- The likelihood that two random residents are of different races or ethnicities: 69.9%
- The most prevalent race or ethnicity group: Black or African American (40.2%)
- Est. typical home value in Nov 2023: $533,473
- Est. population in 2022: 3,399
28. West Brighton (Staten Island)
- The likelihood that two random residents are of different races or ethnicities: 69.9%
- The most prevalent race or ethnicity group: White (37.3%)
- Est. typical home value in Nov 2023: $634,512
- Est. population in 2022: 18,195
26. Bellerose (Queens)
- The likelihood that two random residents are of different races or ethnicity: 70.1%
- The most prevalent race or ethnicity group: Asian (46.2%)
- Est. typical home value in Nov 2023: $734,385
- Est. population in 2022: 31,470
25. Rego Park (Queens)
- The likelihood that two random residents are of different races or ethnicity: 70.3%
- The most prevalent race or ethnicity group: White (39.0%)
- Est. typical home value in Nov 2023: $409,330
- Est. population in 2022: 44,200
24. Port Ivory (Staten Island)
- The likelihood that two random residents are of different races or ethnicity: 70.4%
- The most prevalent race or ethnicity group: Black or African American (37.2%)
- Est. typical home value in Nov 2023: N/A
- Est. population in 2022: 1,061
23. Sunnyside (Queens)
- The likelihood that two random residents are of different races or ethnicities: 70.5%
- The most prevalent race or ethnicity group: White (32.5%)
- Est. typical home value in Nov 2023: $474,518
- Est. population in 2022: 42,321
22. Ozone Park (Queens)
- The likelihood that two random residents are of different races or ethnicities: 70.5%
- The most prevalent race or ethnicity group: Hispanic or Latino (41.8%)
- Est. typical home value in Nov 2023: $681,815
- Est. population in 2022: 57,574
21. Roosevelt Island (Manhattan)
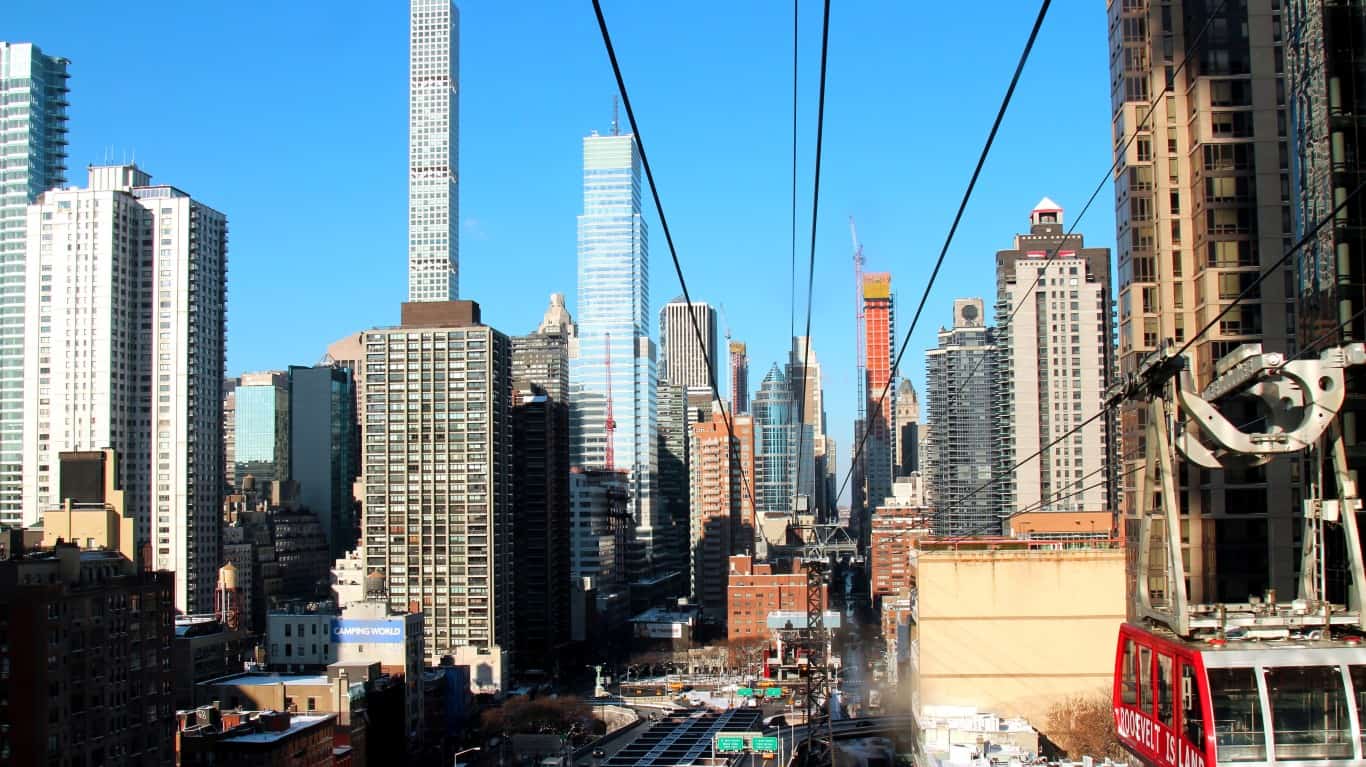
- The likelihood that two random residents are of different races or ethnicity: 70.6%
- The most prevalent race or ethnicity group: White (42.6%)
- Est. typical home value in Nov 2023: $874,677
- Est. population in 2022: 7,605
20. Dongan Hills (Staten Island)
- The likelihood that two random residents are of different races or ethnicity: 70.6%
- The most prevalent race or ethnicity group: White (43.0%)
- Est. typical home value in Nov 2023: $687,675
- Est. population in 2022: 3,476
19. Pomonok (Queens)
- The likelihood that two random residents are of different races or ethnicity: 70.9%
- The most prevalent race or ethnicity group: Hispanic or Latino (43.9%)
- Est. typical home value in Nov 2023: N/A
- Est. population in 2022: 10,023
18. Kew Gardens (Queens)
- The likelihood that two random residents are of different races or ethnicity: 70.9%
- The most prevalent race or ethnicity group: White (43.1%)
- Est. typical home value in Nov 2023: $363,658
- Est. population in 2022: 22,104
17. Morningside Heights (Manhattan)
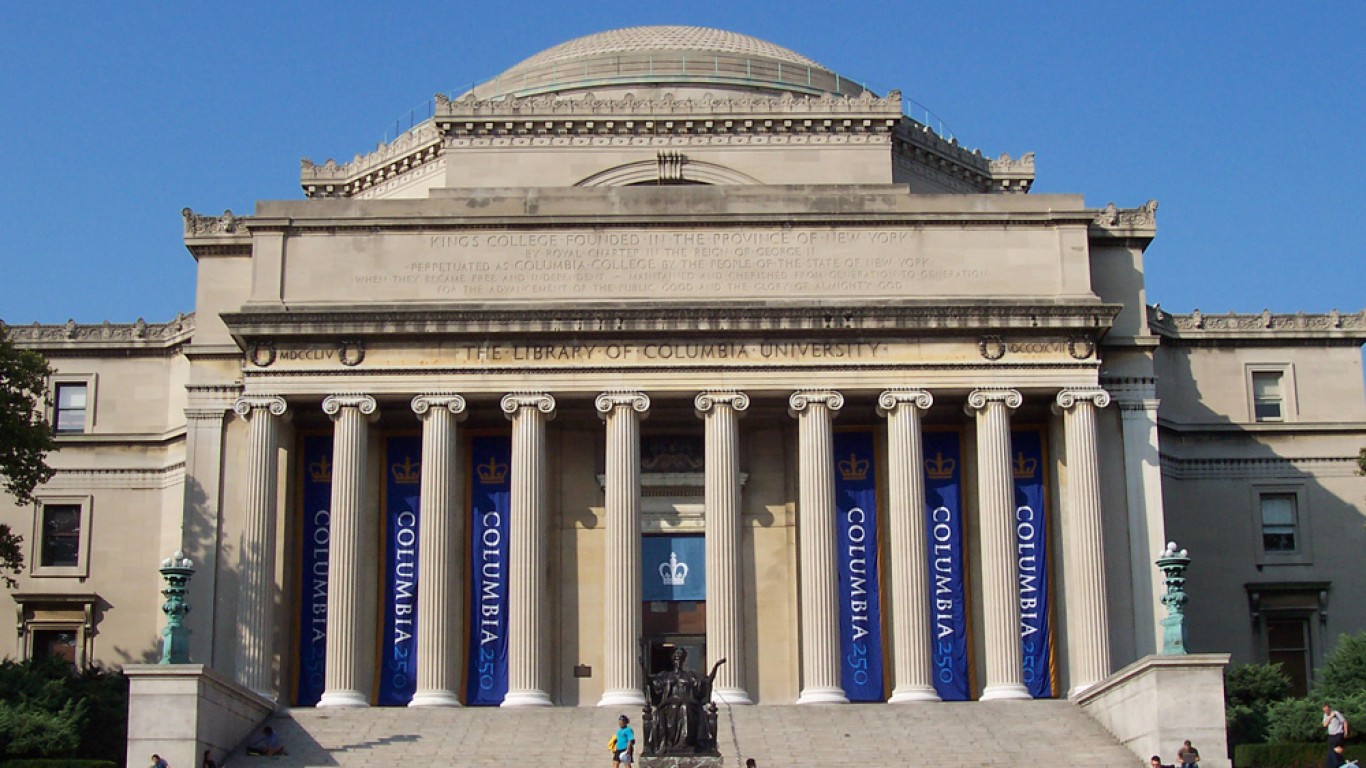
- The likelihood that two random residents are of different races or ethnicity: 71.0%
- The most prevalent race or ethnicity group: White (44.6%)
- Est. typical home value in Nov 2023: $731,296
- Est. population in 2022: 26,228
16. Pelham Gardens (Bronx)
- The likelihood that two random residents are of different races or ethnicity: 71.4%
- The most prevalent race or ethnicity group: Hispanic or Latino (37.8%)
- Est. typical home value in Nov 2023: $672,219
- Est. population in 2022: 24,723
15. Rockaway Beach (Queens)
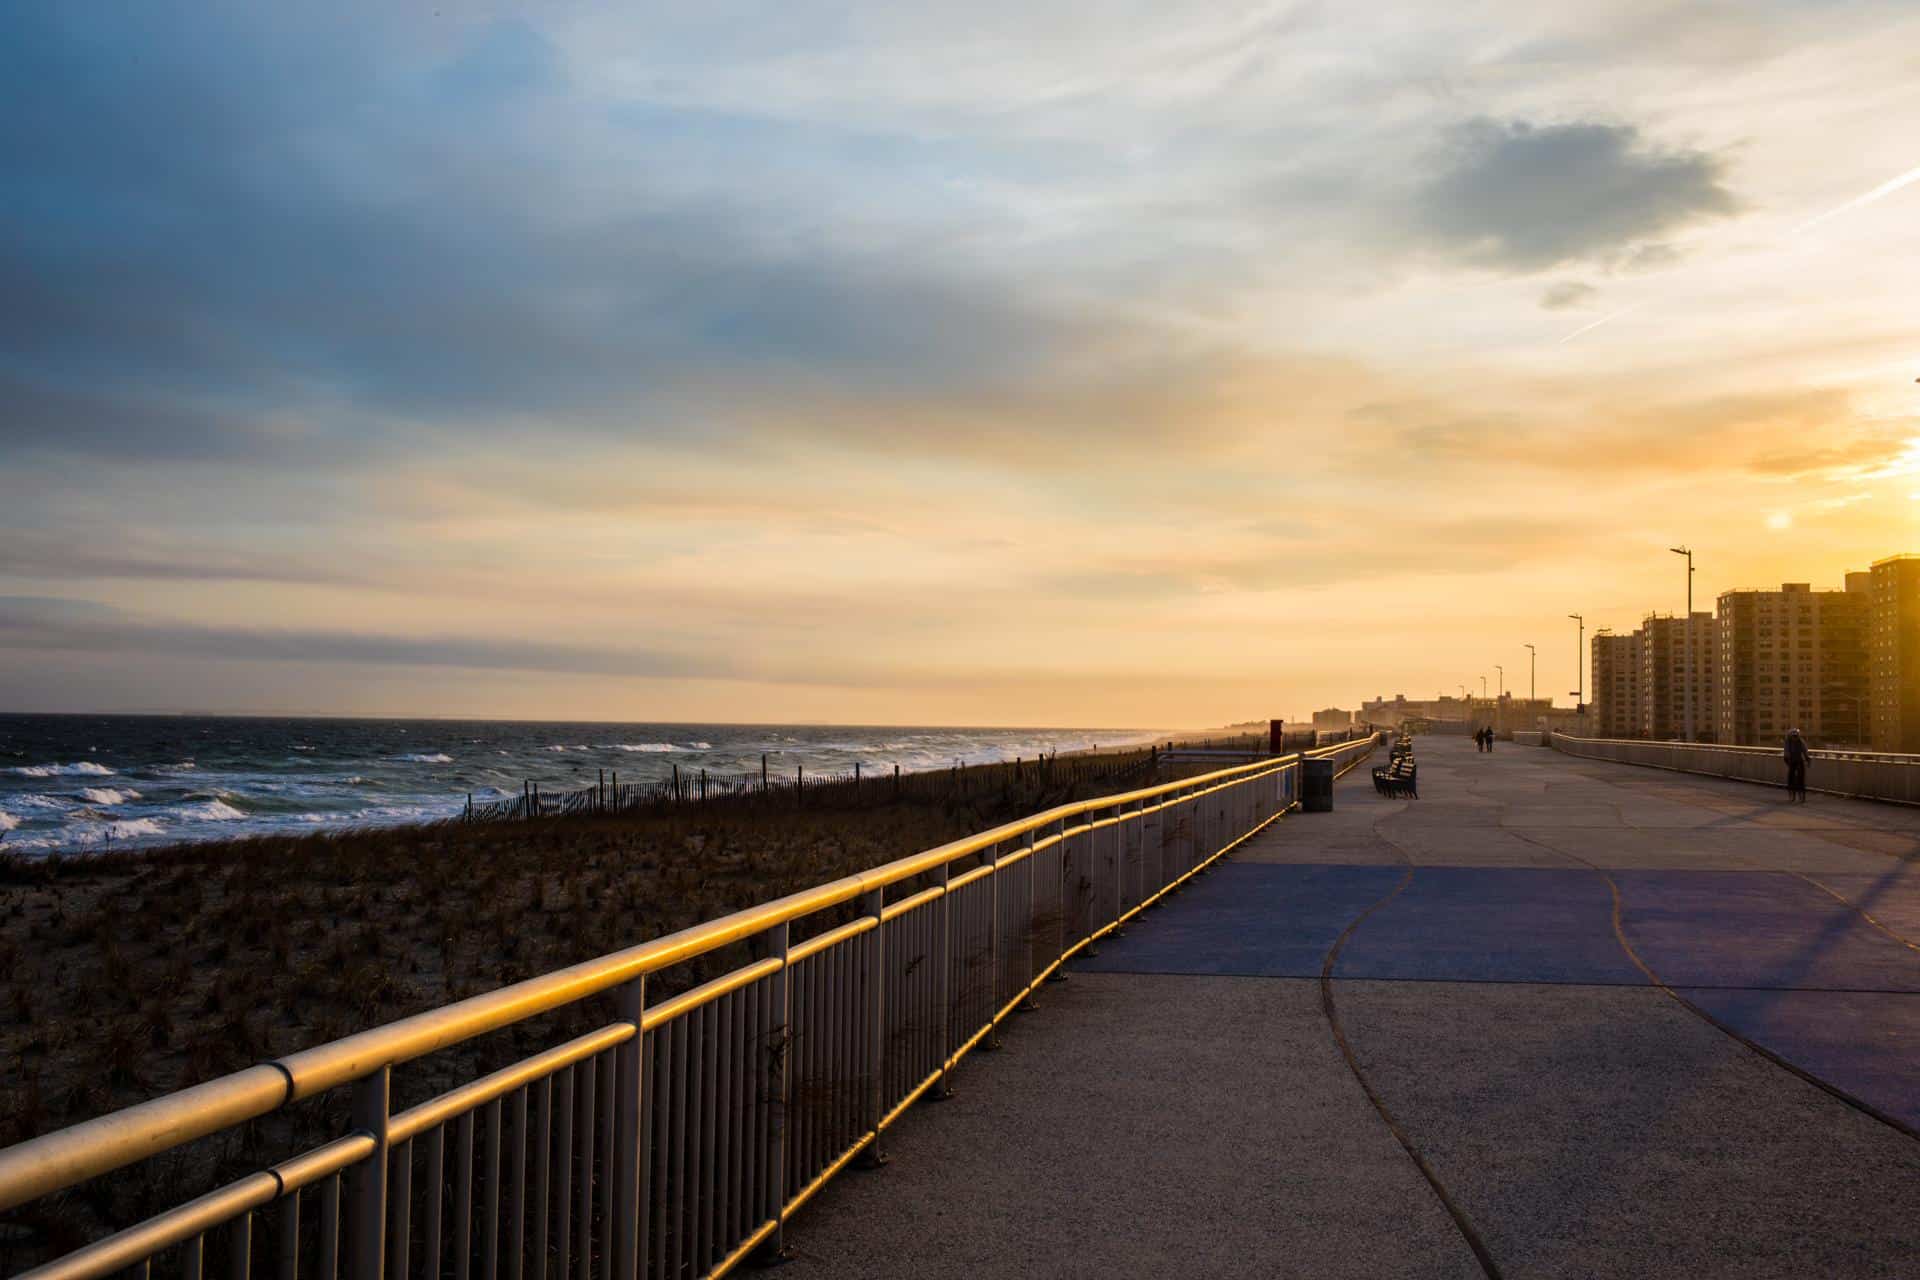
- The likelihood that two random residents are of different races or ethnicities: 71.5%
- The most prevalent race or ethnicity group: Black or African American (34.9%)
- Est. typical home value in Nov 2023: N/A
- Est. population in 2022: 5,255
14. Kew Gardens Hills (Queens)

- The likelihood that two random residents are of different races or ethnicity: 71.7%
- The most prevalent race or ethnicity group: White (41.8%)
- Est. typical home value in Nov 2023: $462,538
- Est. population in 2022: 43,873
13. Jamaica (Queens)
- The likelihood that two random residents are of different races or ethnicity: 71.7%
- The most prevalent race or ethnicity group: Black or African American (43.0%)
- Est. typical home value in Nov 2023: $620,919
- Est. population in 2022: 130,844
12. Hillcrest (Queens)
- The likelihood that two random residents are of different races or ethnicity: 71.9%
- The most prevalent race or ethnicity group: Asian (39.6%)
- Est. typical home value in Nov 2023: N/A
- Est. population in 2022: 14,726
10. Lower East Side (Manhattan)
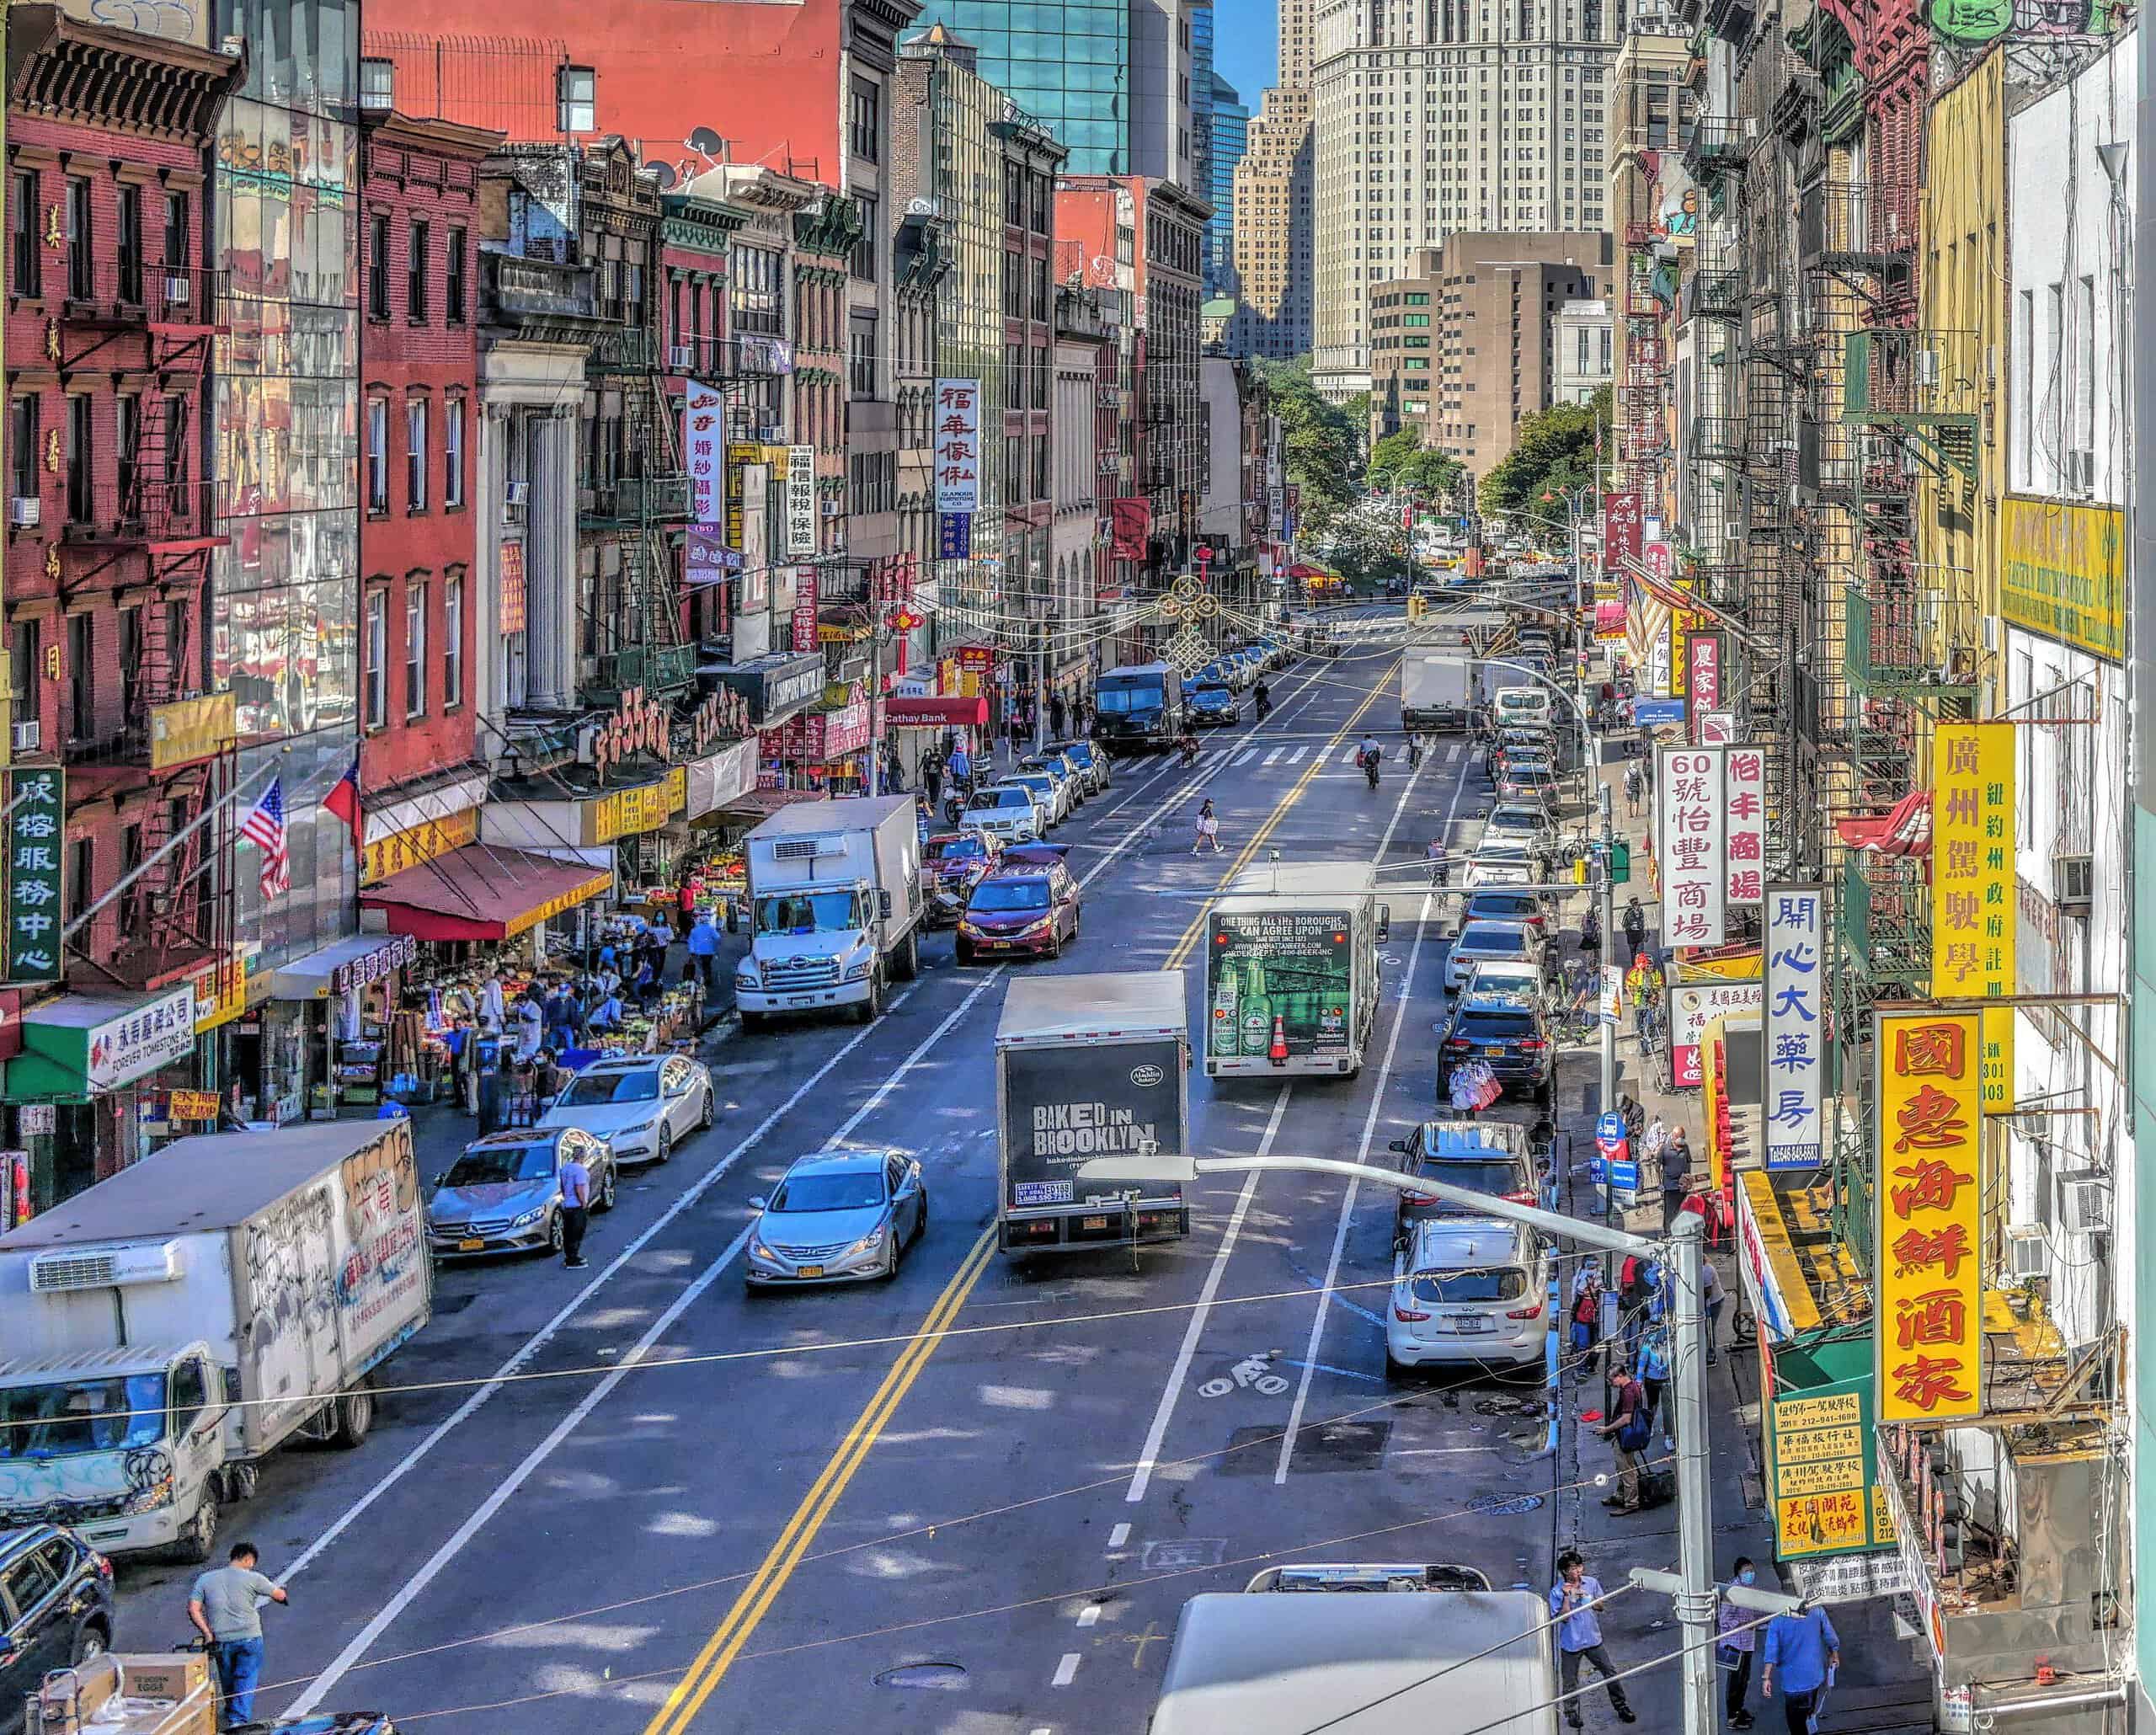
- The likelihood that two random residents are of different races or ethnicities: 73.5%
- The most prevalent race or ethnicity group: Asian (34.4%)
- Est. typical home value in Nov 2023: $945,725
- Est. population in 2022: 58,967
9. Holliswood (Queens)
- The likelihood that two random residents are of different races or ethnicities: 73.5%
- The most prevalent race or ethnicity group: White (34.6%)
- Est. typical home value in Nov 2023: N/A
- Est. population in 2022: 4,746
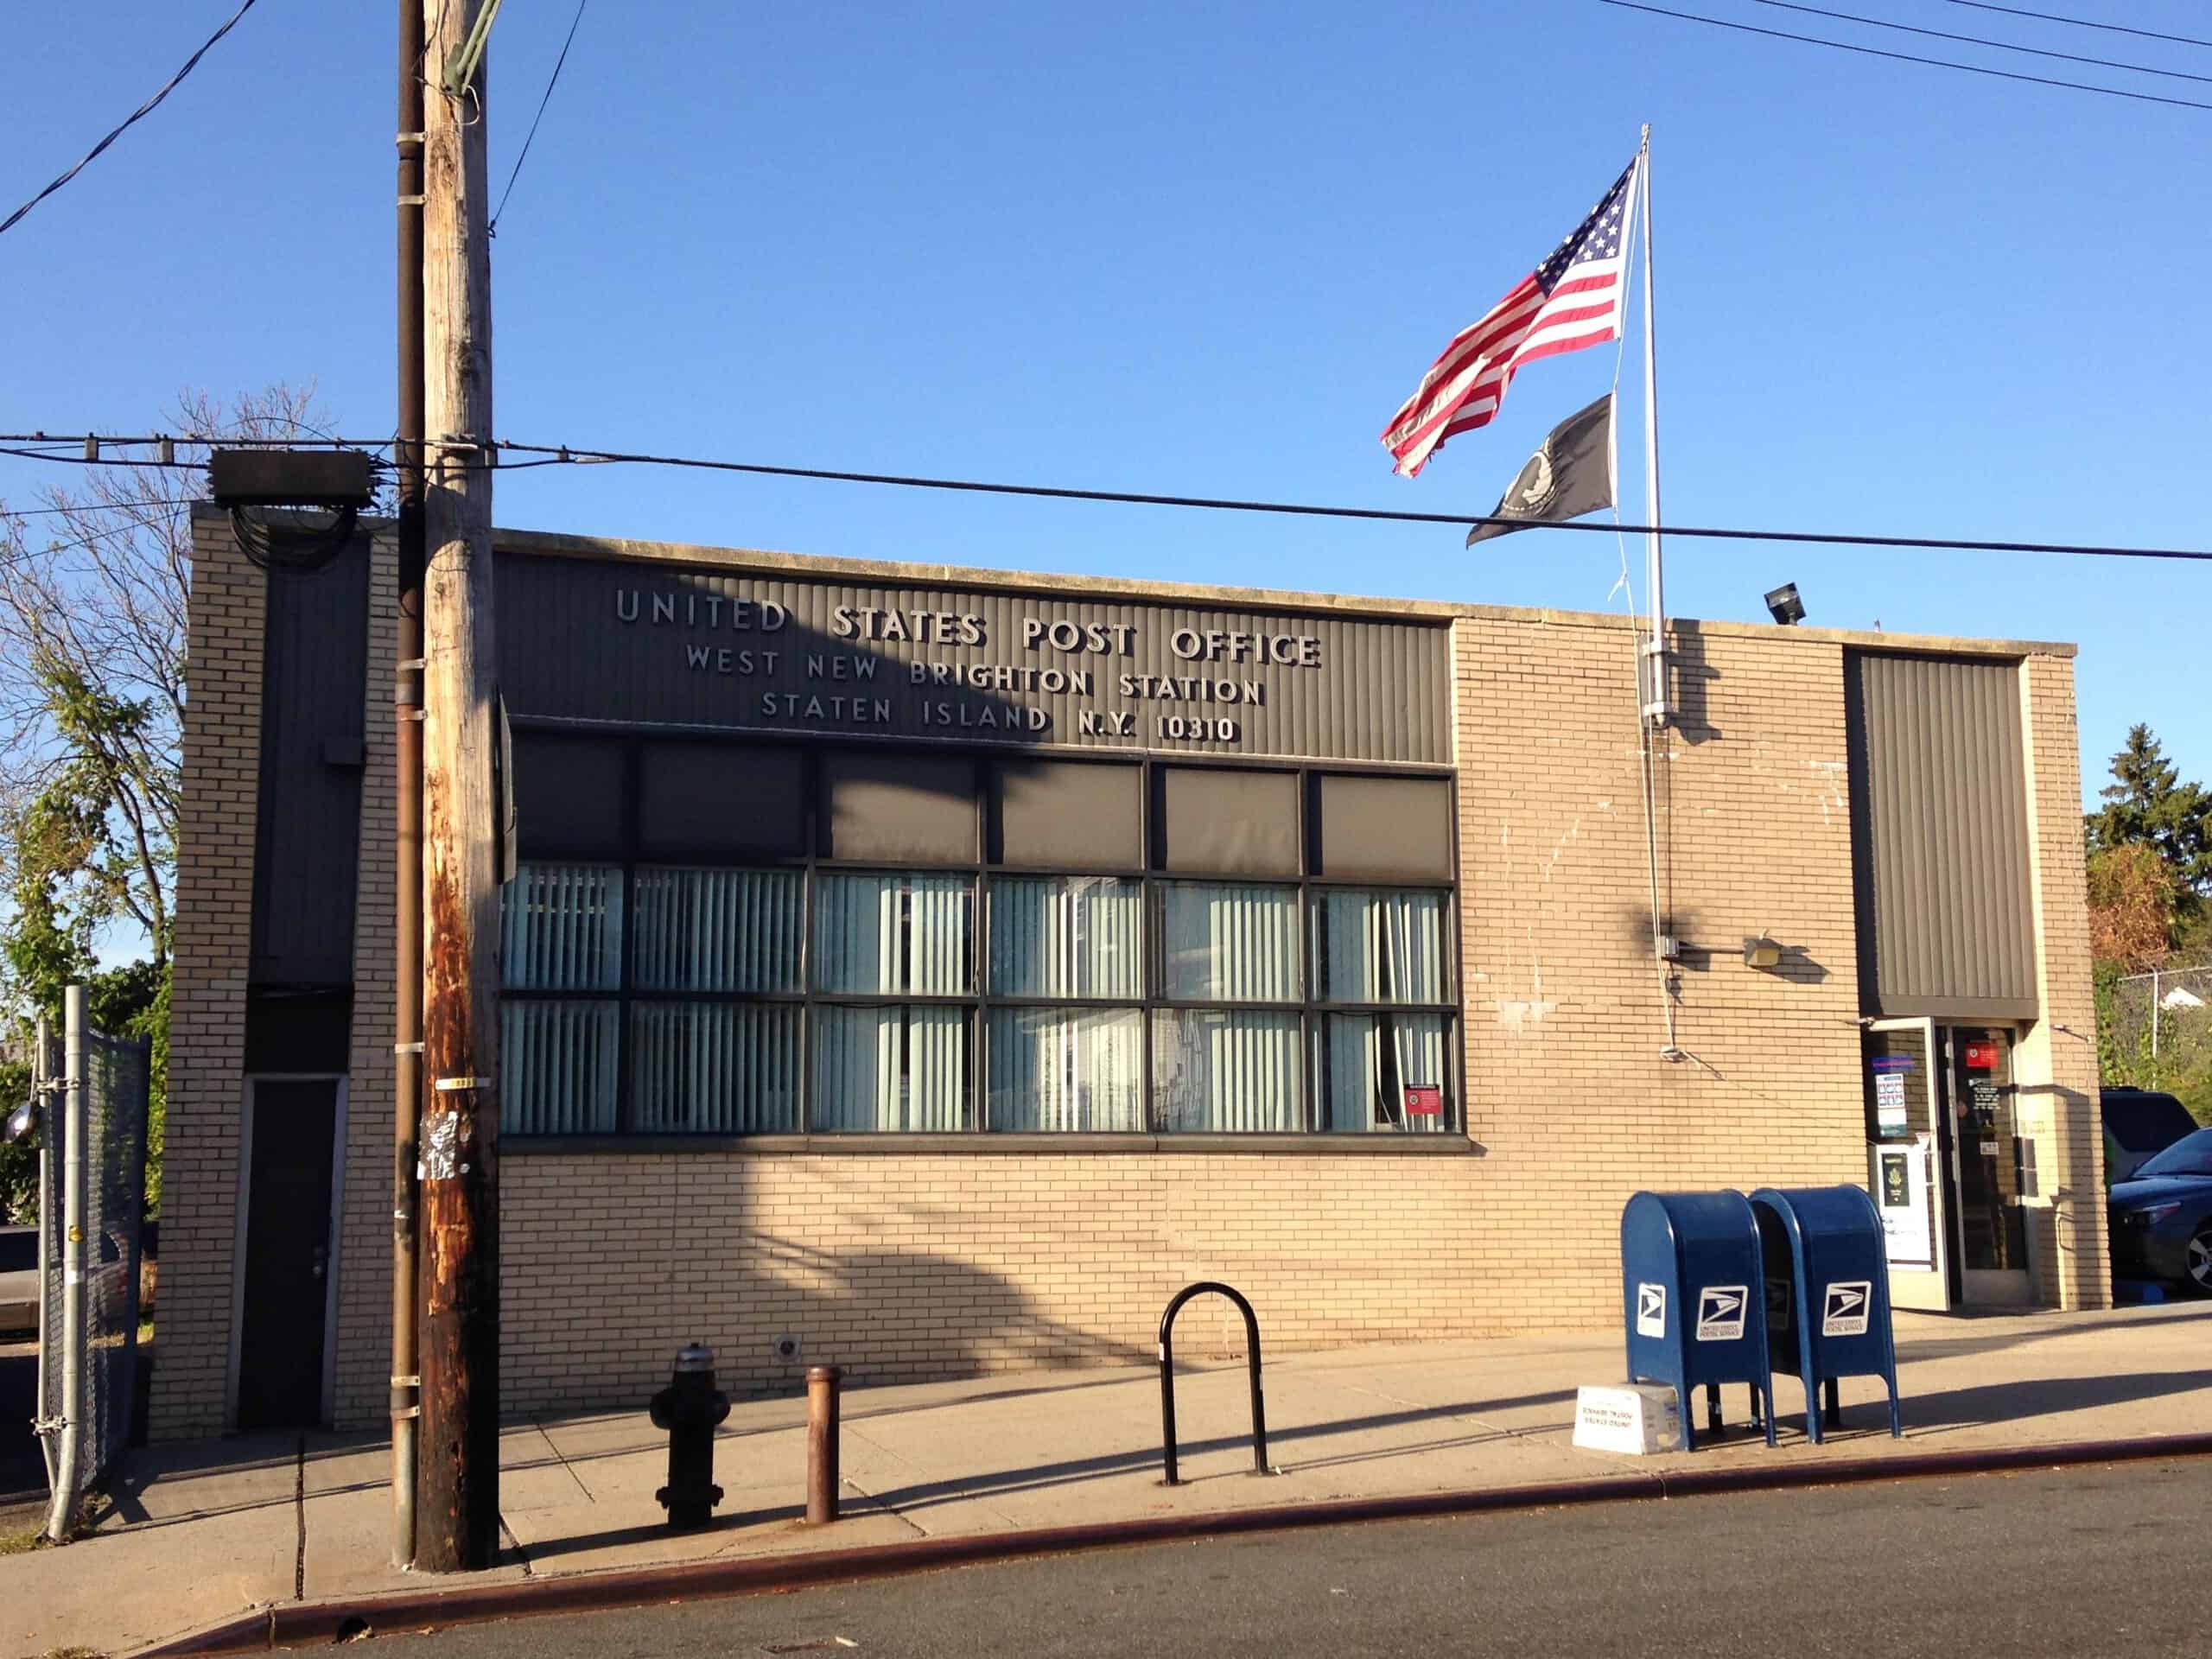
8. New Brighton (Staten Island)
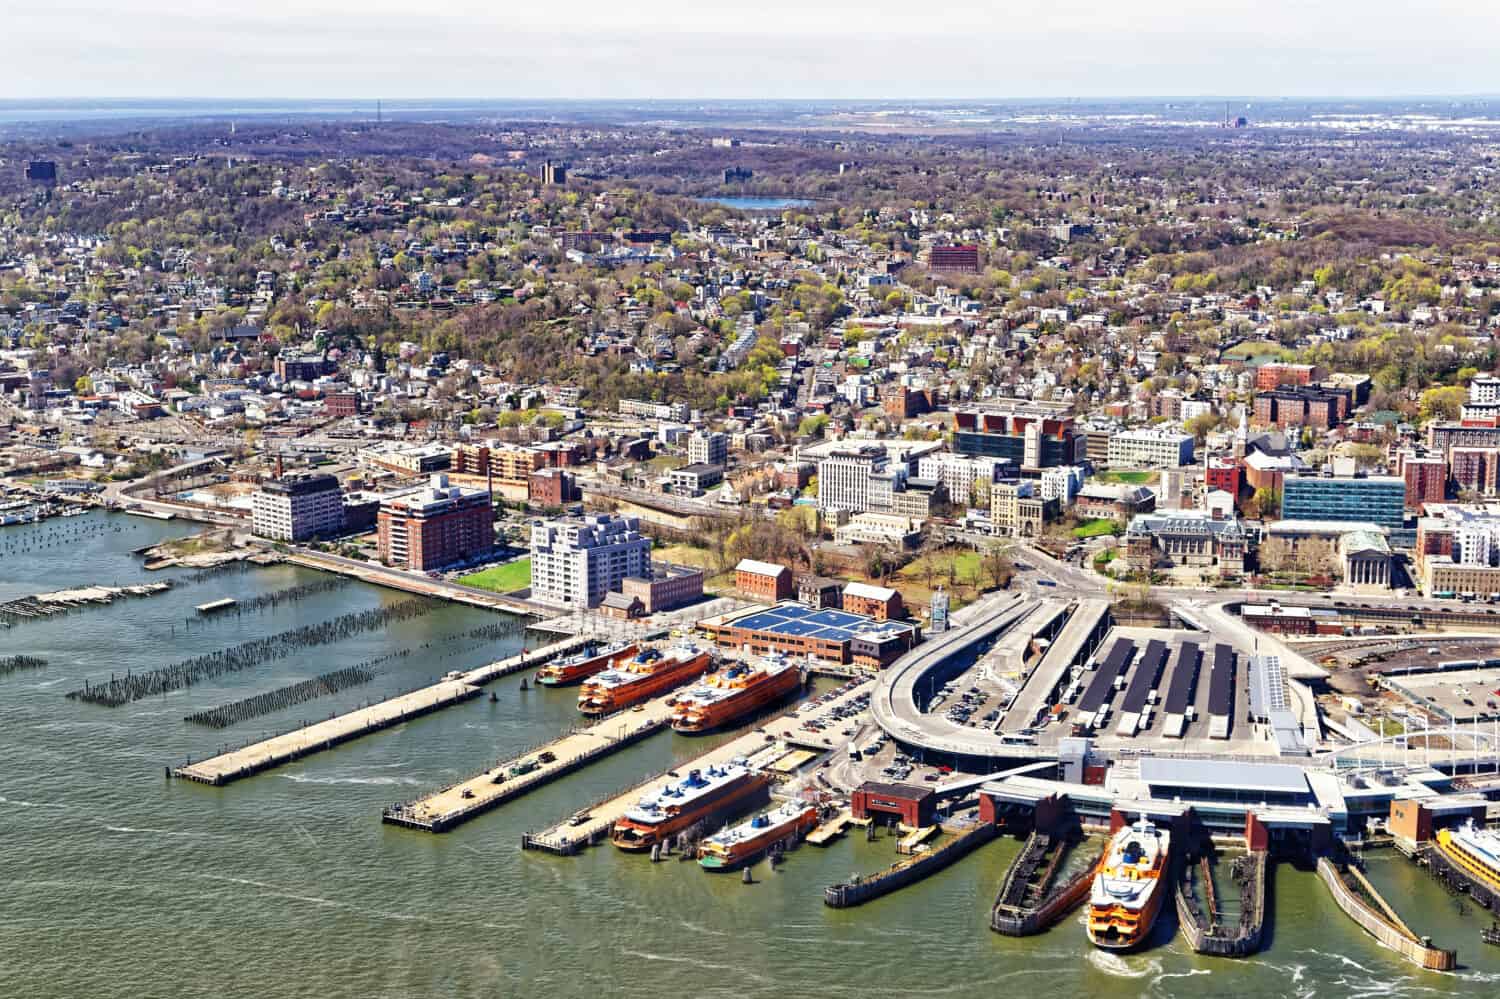
- The likelihood that two random residents are of different races or ethnicity: 73.7%
- The most prevalent race or ethnicity group: Hispanic or Latino (30.9%)
- Est. typical home value in Nov 2023: $573,883
- Est. population in 2022: 6,654
7. Tompkinsville (Staten Island)

- The likelihood that two random residents are of different races or ethnicity: 73.8%
- The most prevalent race or ethnicity group: White (40.3%)
- Est. typical home value in Nov 2023: $570,707
- Est. population in 2022: 1,656
6. Graniteville (Staten Island)
- The likelihood that two random residents are of different races or ethnicity: 73.9%
- The most prevalent race or ethnicity group: White (36.6%)
- Est. typical home value in Nov 2023: $621,094
- Est. population in 2022: 12,167
5. Jamaica Estates (Queens)
- The likelihood that two random residents are of different races or ethnicities: 75.4%
- The most prevalent race or ethnicity group: Asian (34.7%)
- Est. typical home value in Nov 2023: $1,033,199
- Est. population in 2022: 15,947
4. Richmond Hill (Queens)
- The likelihood that two random residents are of different races or ethnicities: 75.7%
- The most prevalent race or ethnicity group: Hispanic or Latino (35.2%)
- Est. typical home value in Nov 2023: $705,915
- Est. population in 2022: 53,221
2. Briarwood (Queens)
- The likelihood that two random residents are of different races or ethnicities: 76.9%
- The most prevalent race or ethnicity group: Asian (28.1%)
- Est. typical home value in Nov 2023: $386,213
- Est. population in 2022: 29,795
1. South Ozone Park (Queens)
- The likelihood that two random residents are of different races or ethnicities: 79.3%
- The most prevalent race or ethnicity group: Asian (30.7%)
- Est. typical home value in Nov 2023: $671,736
- Est. population in 2022: 80,076