
[cnxvideo id=”655353″ placement=”prodege”]The U.S. economy was in better condition in 2018 than it has been in decades. The job market posted its 96th consecutive month of job growth in September, the longest job creation streak in U.S. history, and the unemployment rate fell to 3.7% — its lowest point in nearly 50 years.
As of October, the U.S. economy has added 1.9 million jobs this year. If the current rate of job growth continues through December, the year-over-year job growth in 2018 will be among the fastest of the last two decades.
Approximately 80% of U.S. metropolitan areas have posted positive job growth figures for the year. In several cities — largely midsize manufacturing and mining hubs in the Northeast and Midwest — job growth from January 2018 to October 2018 was more than triple the 1.4% national growth. Conversely, in 25 metro areas — many located in Louisiana, North Dakota, Ohio, and West Virginia — employment has fallen by more than 1.1% in 2018.
Nationwide, the sectors with the fastest job growth in 2018 were construction, mining and logging, leisure and hospitality, and professional and business services. Sectors with the slowest job growth included retail trade, financial activities, and information.
Population growth and a robust economy are two of the main factors that contribute to employment growth, but not necessarily to lower unemployment. Cities that added residents — often due to available job growth — generally saw the size of their labor force rise as well. The size of the civilian labor force grew in approximately 90% of cities with job growth in 2018.
To identify the cities adding (and losing) the most jobs in 2018, 24/7 Wall st. reviewed monthly metro area employment figures from the Bureau of Labor Statistics. We calculated the percentage change from January 2018 through October 2018, the latest month for which employment data at the metro area level is available. All figures are seasonally adjusted. January and October unemployment rates came from the BLS. We identified the industry contributing the most to job growth using employment breakdowns by sector (NAICS level 2), also from the BLS.

25. Syracuse, NY
> 2018 employment change: 9,076 (+3.1%)
> Jan. 2018 employment: 289,411
> Oct. 2018 employment: 298,487
> Unemployment, Oct. 2018: 4.0%
> Strongest sector: Mining, logging and construction (+31.1% employment chg.)

24. Manchester, NH
> 2018 employment change: 3,620 (+3.2%)
> Jan. 2018 employment: 112,792
> Oct. 2018 employment: 116,412
> Unemployment, Oct. 2018: 2.3%
> Strongest sector: Education and health services (+8.5% employment chg.)
[recirclink id=488456]

23. Kokomo, IN
> 2018 employment change: 1,203 (+3.2%)
> Jan. 2018 employment: 37,206
> Oct. 2018 employment: 38,409
> Unemployment, Oct. 2018: 3.6%
> Strongest sector: Transportation, warehousing, and utilities (+12.5% employment chg.)

22. Elkhart-Goshen, IN
> 2018 employment change: 3,639 (+3.3%)
> Jan. 2018 employment: 111,692
> Oct. 2018 employment: 115,331
> Unemployment, Oct. 2018: 2.8%
> Strongest sector: Mining, logging and construction (+21.9% employment chg.)

21. Phoenix-Mesa-Scottsdale, AZ
> 2018 employment change: 73,199 (+3.3%)
> Jan. 2018 employment: 2.2 million
> Oct. 2018 employment: 2.3 million
> Unemployment, Oct. 2018: 4.0%
> Strongest sector: Construction (+14.8% employment chg.)

20. Pittsfield, MA
> 2018 employment change: 1,371 (+3.3%)
> Jan. 2018 employment: 41,471
> Oct. 2018 employment: 42,842
> Unemployment, Oct. 2018: 4.0%
> Strongest sector: Mining, logging and construction (+31.6% employment chg.)
[in-text-ad]

19. Charlottesville, VA
> 2018 employment change: 3,851 (+3.3%)
> Jan. 2018 employment: 116,348
> Oct. 2018 employment: 120,199
> Unemployment, Oct. 2018: 2.5%
> Strongest sector: Leisure and hospitality (+15.9% employment chg.)
[recirclink id=488594]

18. Kingston, NY
> 2018 employment change: 2,903 (+3.4%)
> Jan. 2018 employment: 84,457
> Oct. 2018 employment: 87,360
> Unemployment, Oct. 2018: 3.6%
> Strongest sector: Leisure and hospitality (+26.8% employment chg.)

17. Columbus, IN
> 2018 employment change: 1,537 (+3.5%)
> Jan. 2018 employment: 43,509
> Oct. 2018 employment: 45,046
> Unemployment, Oct. 2018: 2.9%
> Strongest sector: Mining, logging and construction (+18.8% employment chg.)
[in-text-ad-2]

16. Florence-Muscle Shoals, AL
> 2018 employment change: 2,224 (+3.6%)
> Jan. 2018 employment: 61,061
> Oct. 2018 employment: 63,285
> Unemployment, Oct. 2018: 4.4%
> Strongest sector: Mining, logging and construction (+16.1% employment chg.)

15. Fort Wayne, IN
> 2018 employment change: 7,479 (+3.7%)
> Jan. 2018 employment: 204,876
> Oct. 2018 employment: 212,355
> Unemployment, Oct. 2018: 3.3%
> Strongest sector: Mining, logging and construction (+22.7% employment chg.)
[in-text-ad]

14. Springfield, MA-CT
> 2018 employment change: 13,169 (+3.7%)
> Jan. 2018 employment: 354,153
> Oct. 2018 employment: 367,322
> Unemployment, Oct. 2018: 4.1%
> Strongest sector: Leisure and hospitality (+20.7% employment chg.)
[recirclink id=488561]

13. Las Vegas-Henderson-Paradise, NV
> 2018 employment change: 39,204 (+3.8%)
> Jan. 2018 employment: 1.0 million
> Oct. 2018 employment: 1.1 million
> Unemployment, Oct. 2018: 4.5%
> Strongest sector: Mining and logging (+25.0% employment chg.)

12. Reno, NV
> 2018 employment change: 9,033 (+3.8%)
> Jan. 2018 employment: 236,176
> Oct. 2018 employment: 245,209
> Unemployment, Oct. 2018: 3.5%
> Strongest sector: Construction (+20.1% employment chg.)
[in-text-ad-2]

11. Des Moines-West Des Moines, IA
> 2018 employment change: 13,507 (+4.0%)
> Jan. 2018 employment: 336,874
> Oct. 2018 employment: 350,381
> Unemployment, Oct. 2018: 2.3%
> Strongest sector: Mining, logging and construction (+32.8% employment chg.)

10. Sebring, FL
> 2018 employment change: 1,360 (+4.1%)
> Jan. 2018 employment: 33,304
> Oct. 2018 employment: 34,664
> Unemployment, Oct. 2018: 3.8%
> Strongest sector: N/A
[in-text-ad]

9. Colorado Springs, CO
> 2018 employment change: 14,083 (+4.2%)
> Jan. 2018 employment: 331,932
> Oct. 2018 employment: 346,015
> Unemployment, Oct. 2018: 3.9%
> Strongest sector: Professional and business services (+14.3% employment chg.)
[recirclink id=488514]

8. Leominster-Gardner, MA
> 2018 employment change: 3,203 (+4.3%)
> Jan. 2018 employment: 75,340
> Oct. 2018 employment: 78,543
> Unemployment, Oct. 2018: 3.8%
> Strongest sector: Mining, logging and construction (+31.6% employment chg.)

7. Worcester, MA-CT
> 2018 employment change: 14,905 (+4.4%)
> Jan. 2018 employment: 340,938
> Oct. 2018 employment: 355,843
> Unemployment, Oct. 2018: 3.6%
> Strongest sector: Mining, logging and construction (+18.1% employment chg.)
[in-text-ad-2]

6. Huntsville, AL
> 2018 employment change: 9,884 (+4.7%)
> Jan. 2018 employment: 208,740
> Oct. 2018 employment: 218,624
> Unemployment, Oct. 2018: 3.5%
> Strongest sector: Mining, logging and construction (+11.8% employment chg.)

5. Boston-Cambridge-Nashua, MA-NH
> 2018 employment change: 129,367 (+4.9%)
> Jan. 2018 employment: 2.6 million
> Oct. 2018 employment: 2.8 million
> Unemployment, Oct. 2018: 3.0%
> Strongest sector: Mining, logging and construction (+16.2% employment chg.)
[in-text-ad]

4. New Bedford, MA
> 2018 employment change: 3,959 (+4.9%)
> Jan. 2018 employment: 80,157
> Oct. 2018 employment: 84,116
> Unemployment, Oct. 2018: 5.0%
> Strongest sector: Mining, logging and construction (+37.5% employment chg.)
[recirclink id=488498]

3. Lafayette-West Lafayette, IN
> 2018 employment change: 5,645 (+5.4%)
> Jan. 2018 employment: 104,921
> Oct. 2018 employment: 110,566
> Unemployment, Oct. 2018: 3.3%
> Strongest sector: Mining, logging and construction (+19.4% employment chg.)

2. Midland, TX
> 2018 employment change: 5,282 (+5.7%)
> Jan. 2018 employment: 93,228
> Oct. 2018 employment: 98,510
> Unemployment, Oct. 2018: 2.2%
> Strongest sector: Mining, logging and construction (+18.8% employment chg.)
[in-text-ad-2]
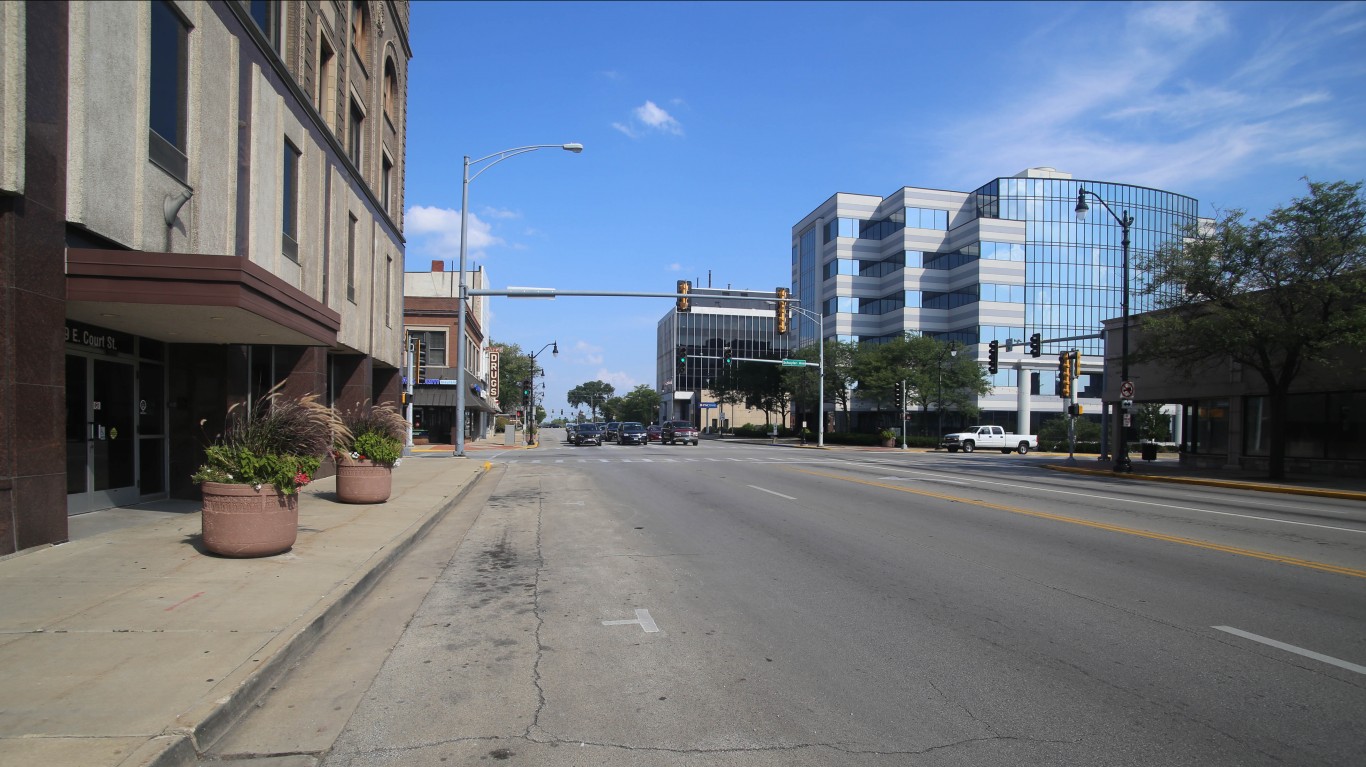
1. Kankakee, IL
> 2018 employment change: 3,081 (+5.7%)
> Jan. 2018 employment: 53,650
> Oct. 2018 employment: 56,731
> Unemployment, Oct. 2018: 5.0%
> Strongest sector: Mining, logging and construction (+45.5% employment chg.)