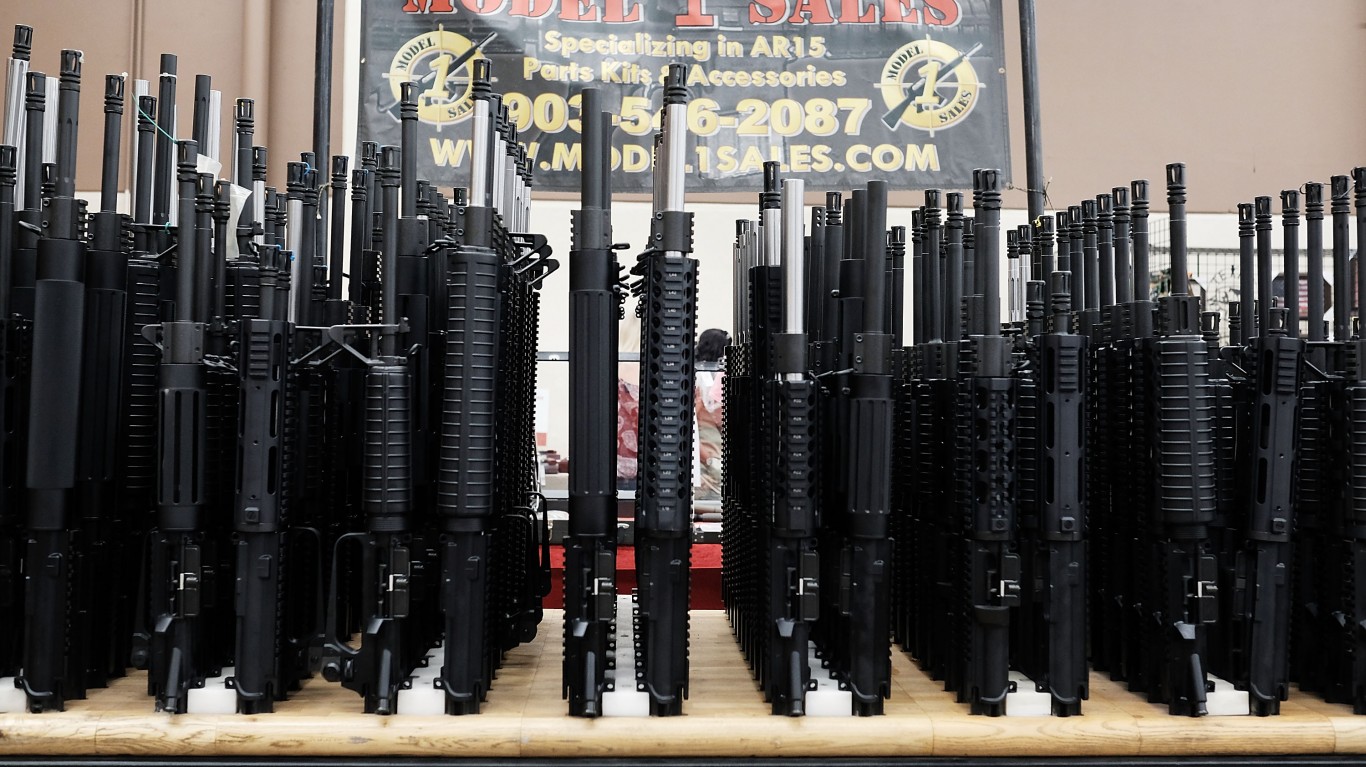
The United States, Russia, France, Germany, and China were the world’s largest exporters of military supplies in the years 2014-2018 — accounting for 75% of all arms exports, according to the latest report on major arms export volumes published by the Stockholm International Peace Research Institute (SIPRI) on March 11.
All but one of these five massive arms-producing nations are also among the countries with the fastest growing arms imports. Three other countries reviewed by SIPRI more than doubled their arms exports as a share of global exports.
The spikes are due to a combination of factors, but primarily high demand from nations in volatile regions such as the Middle East.
To identify the countries increasing their arms exports the most, 24/7 Wall St. reviewed the 15 countries with the largest increases in major arms exports between the five-year periods of 2009-13 and 2014-18 from the report on major arms export volumes published by the Stockholm International Peace Research Institute (SIPRI) on March 11. Each country’s main client, all major arms import and export data, as well as annual military expenditures in 2017, also came from SIPRI. Each country’s GDP per capita in 2016 came from the World Bank.
Click here to see the countries increasing their weapons exports the fastest.
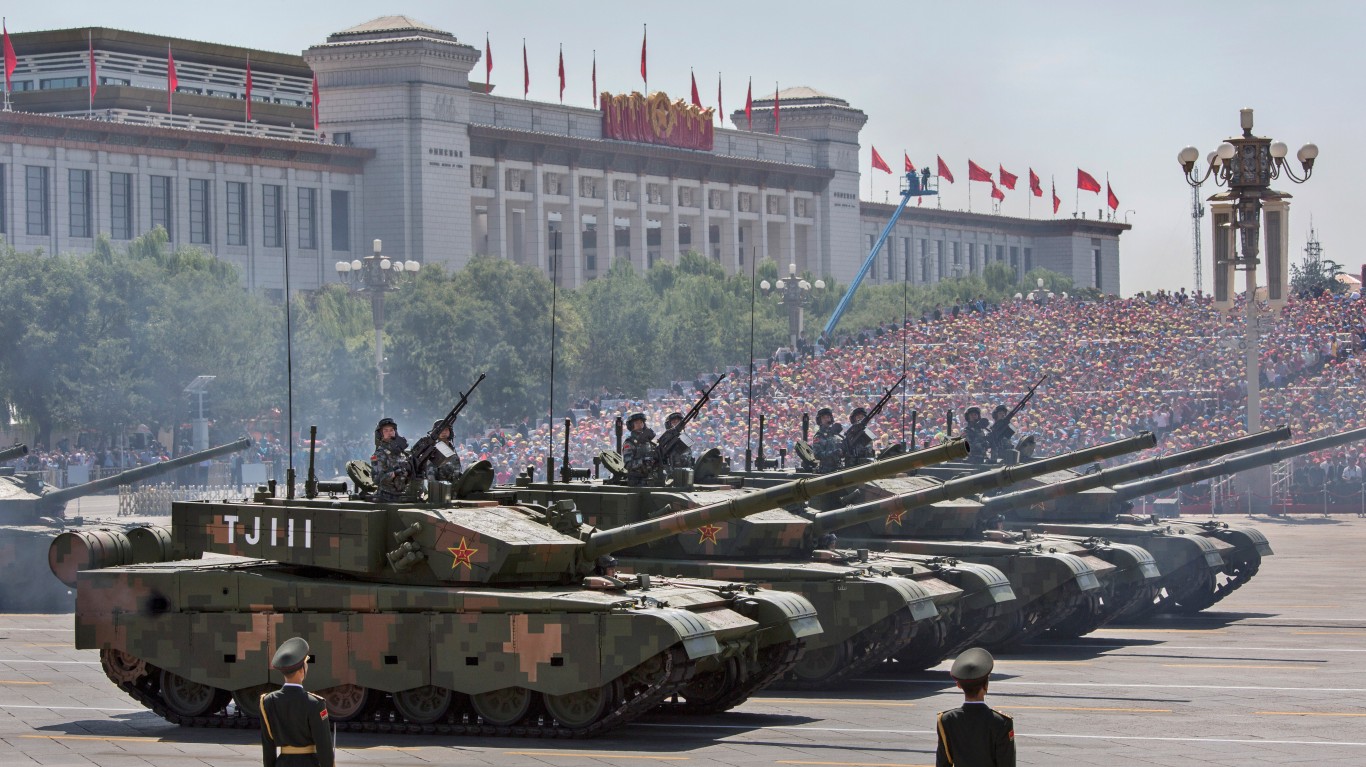
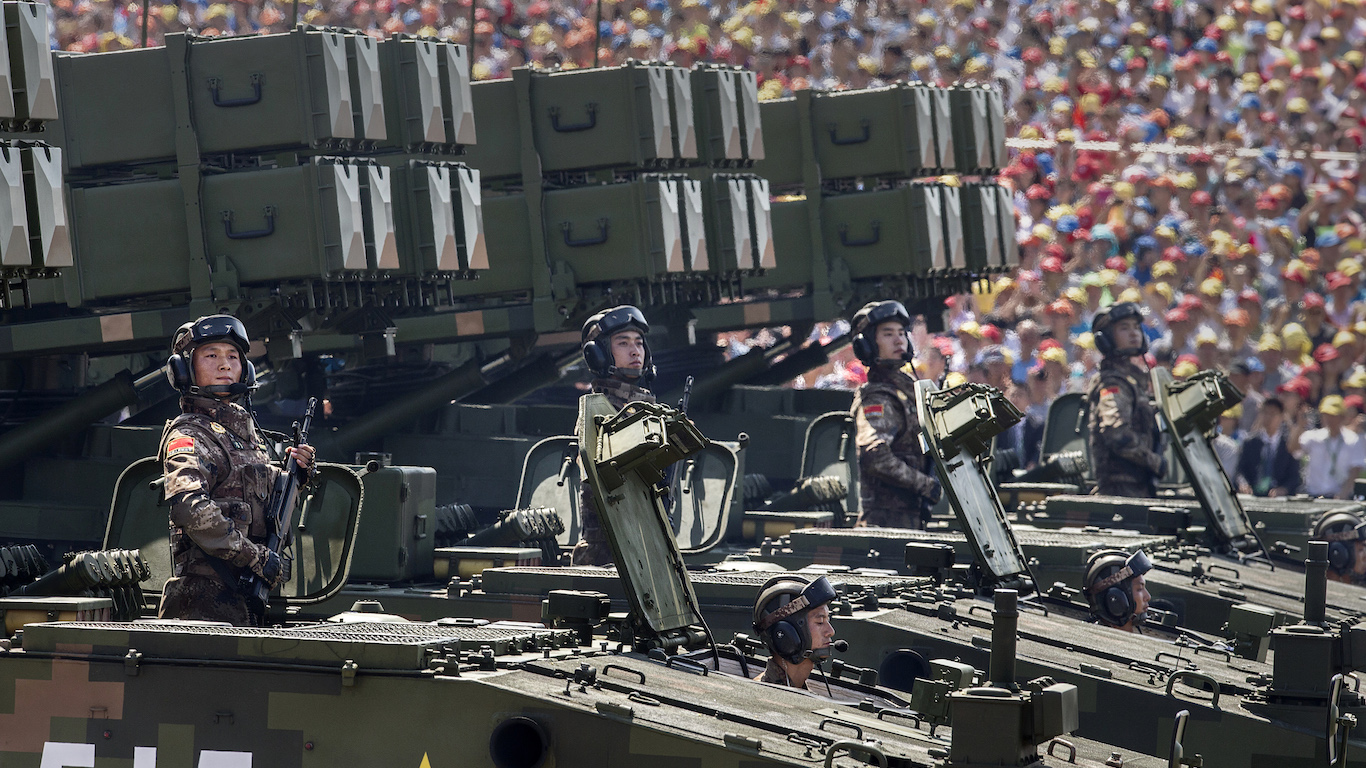
15. China
> Change from 2009-13 to 2014-18: +2.7%
> Share of global arms exports (2014-18): 5.2%
> Share of global arms exports (2009-13): 5.5%
> Main client, share of supplier’s total exports: Pakistan, 37%
> GDP per capita: $15,309
[in-text-ad]
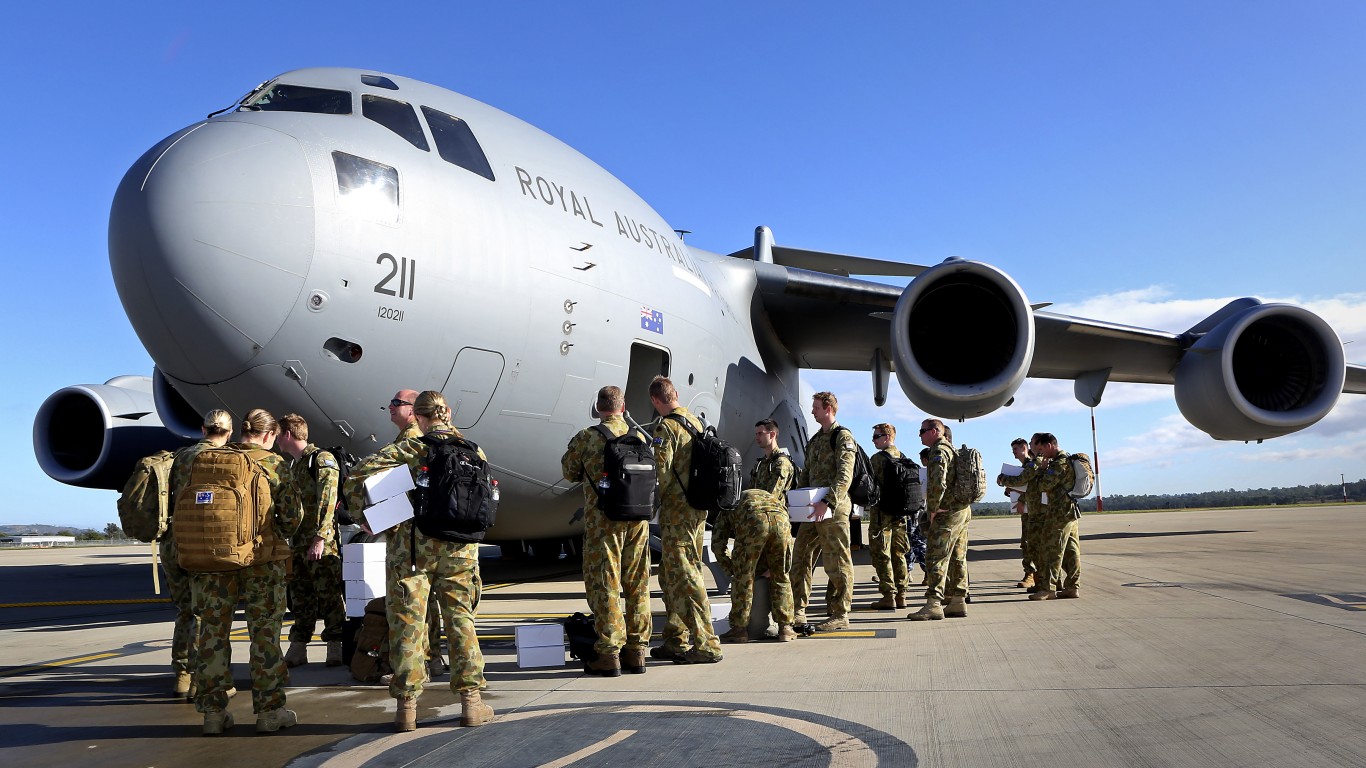
14. Australia
> Change from 2009-13 to 2014-18: +3.9%
> Share of global arms exports (2014-18): 0.3%
> Share of global arms exports (2009-13): 0.3%
> Main client, share of supplier’s total exports: USA, 53%
> GDP per capita: $44,649
[recirclink id=488456]

13. United Kingdom
> Change from 2009-13 to 2014-18: +5.9%
> Share of global arms exports (2014-18): 4.2%
> Share of global arms exports (2009-13): 4.3%
> Main client, share of supplier’s total exports: Saudi Arabia, 44%
> GDP per capita: $39,753
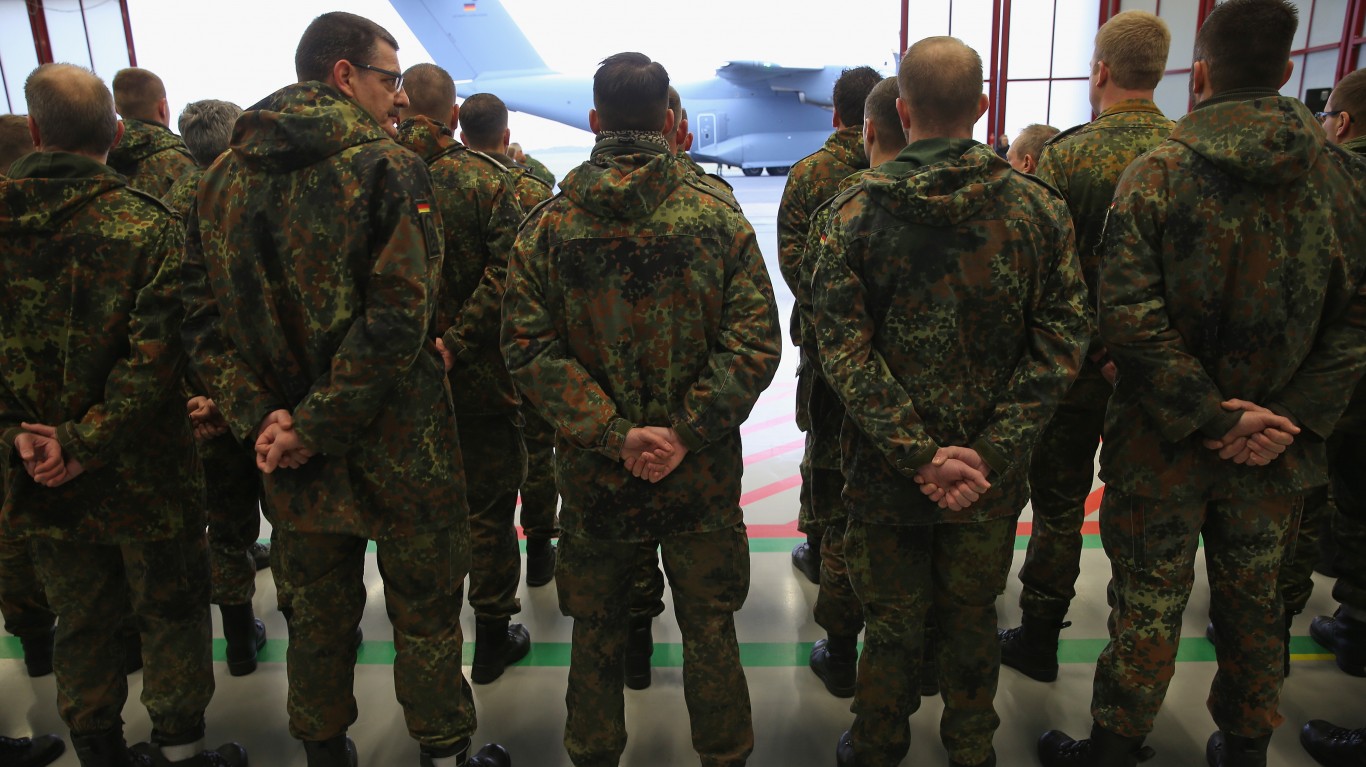
12. Germany
> Change from 2009-13 to 2014-18: +13%
> Share of global arms exports (2014-18): 6.4%
> Share of global arms exports (2009-13): 6.1%
> Main client, share of supplier’s total exports: South Korea, 19%
> GDP per capita: $45,229
[in-text-ad-2]
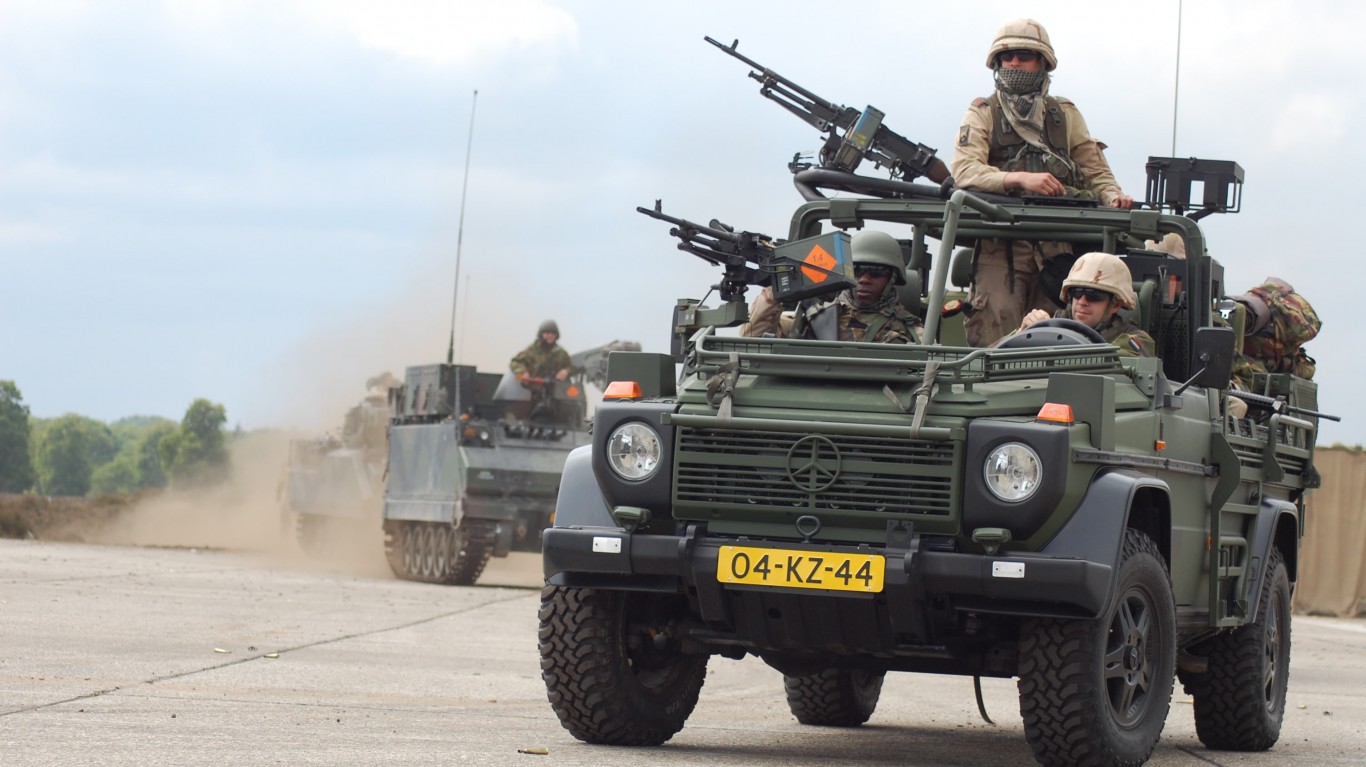
11. Netherlands
> Change from 2009-13 to 2014-18: +16%
> Share of global arms exports (2014-18): 2.1%
> Share of global arms exports (2009-13): 1.9%
> Main client, share of supplier’s total exports: Jordan, 15%
> GDP per capita: $48,473
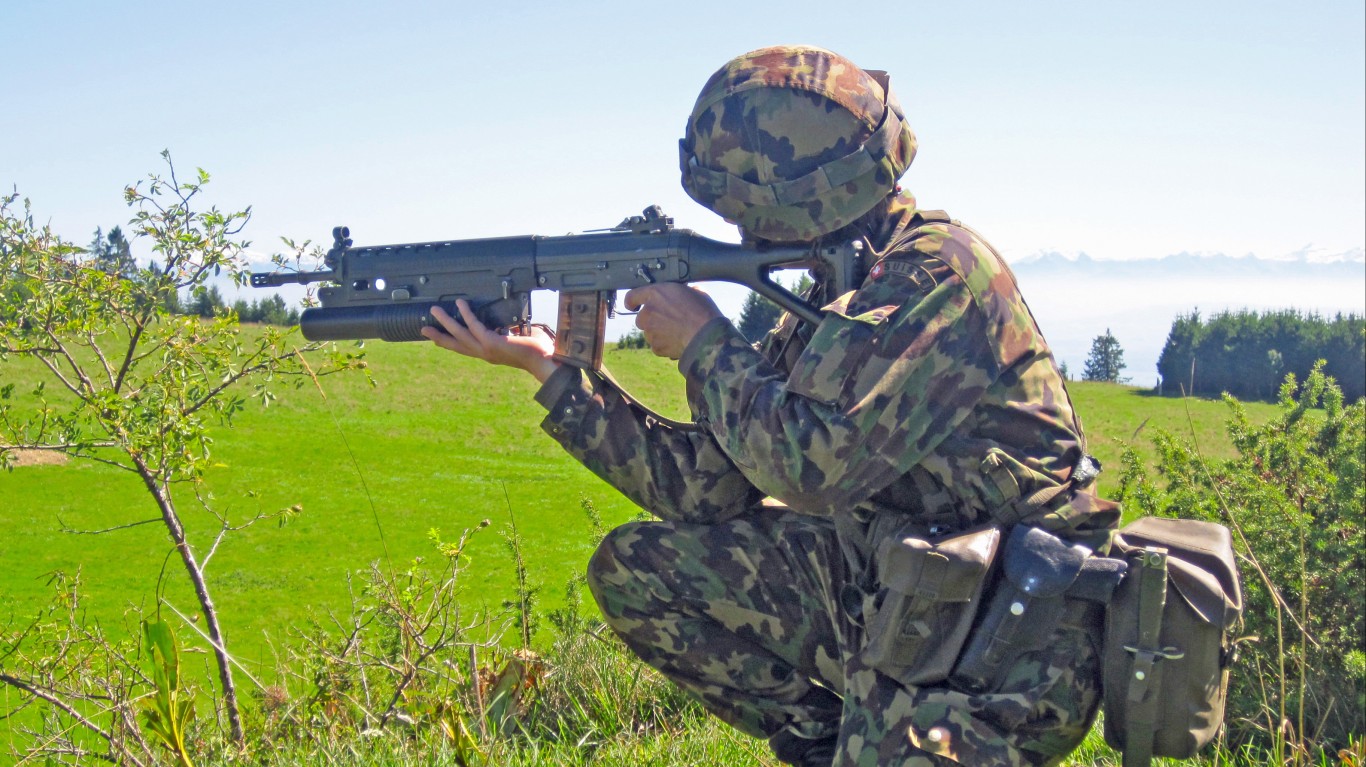
10. Switzerland
> Change from 2009-13 to 2014-18: +20%
> Share of global arms exports (2014-18): 1.0%
> Share of global arms exports (2009-13): 0.9%
> Main client, share of supplier’s total exports: Saudi Arabia, 19%
> GDP per capita: $57,410
[in-text-ad]
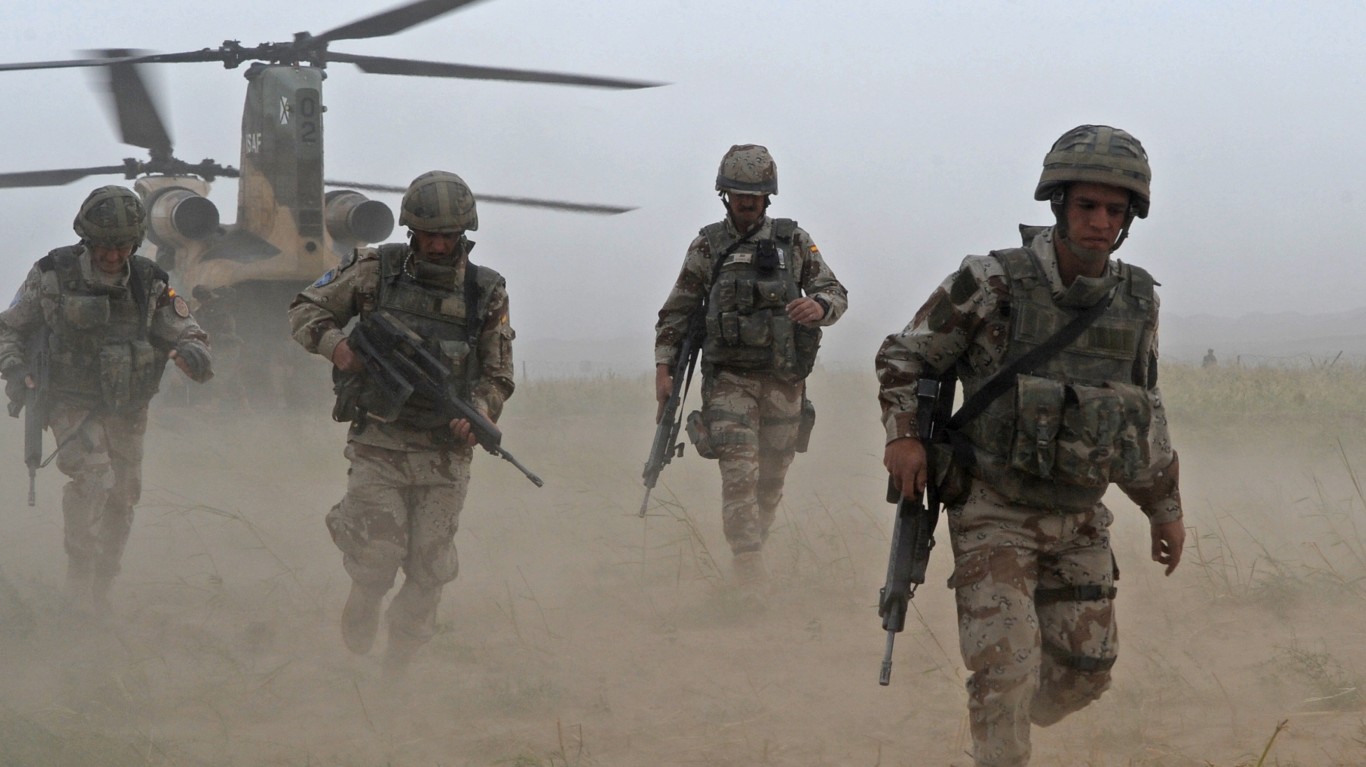
9. Spain
> Change from 2009-13 to 2014-18: +20%
> Share of global arms exports (2014-18): 3.2%
> Share of global arms exports (2009-13): 2.9%
> Main client, share of supplier’s total exports: Australia, 42%
> GDP per capita: $34,272
[recirclink id=488594]
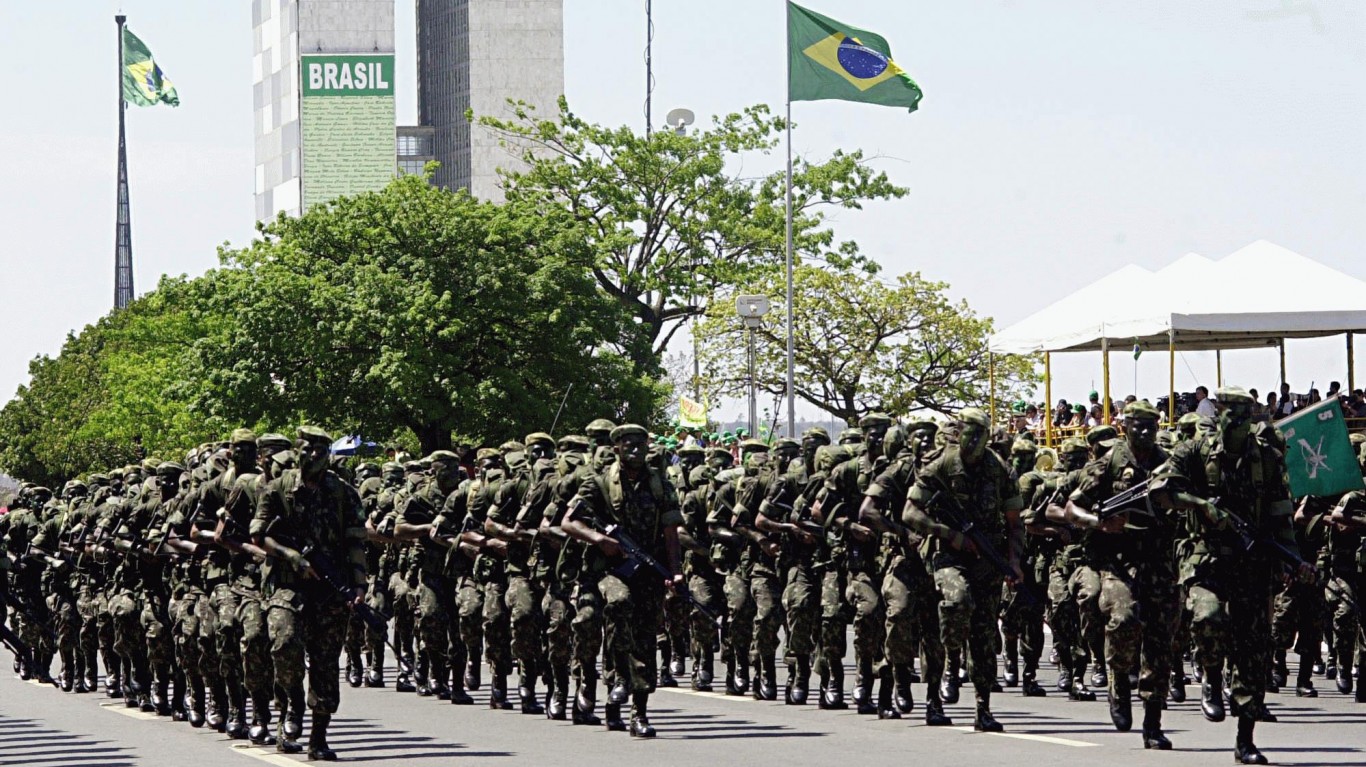
8. Brazil
> Change from 2009-13 to 2014-18: +21%
> Share of global arms exports (2014-18): 0.2%
> Share of global arms exports (2009-13): 0.2%
> Main client, share of supplier’s total exports: Afghanistan, 32%
> GDP per capita: $14,103
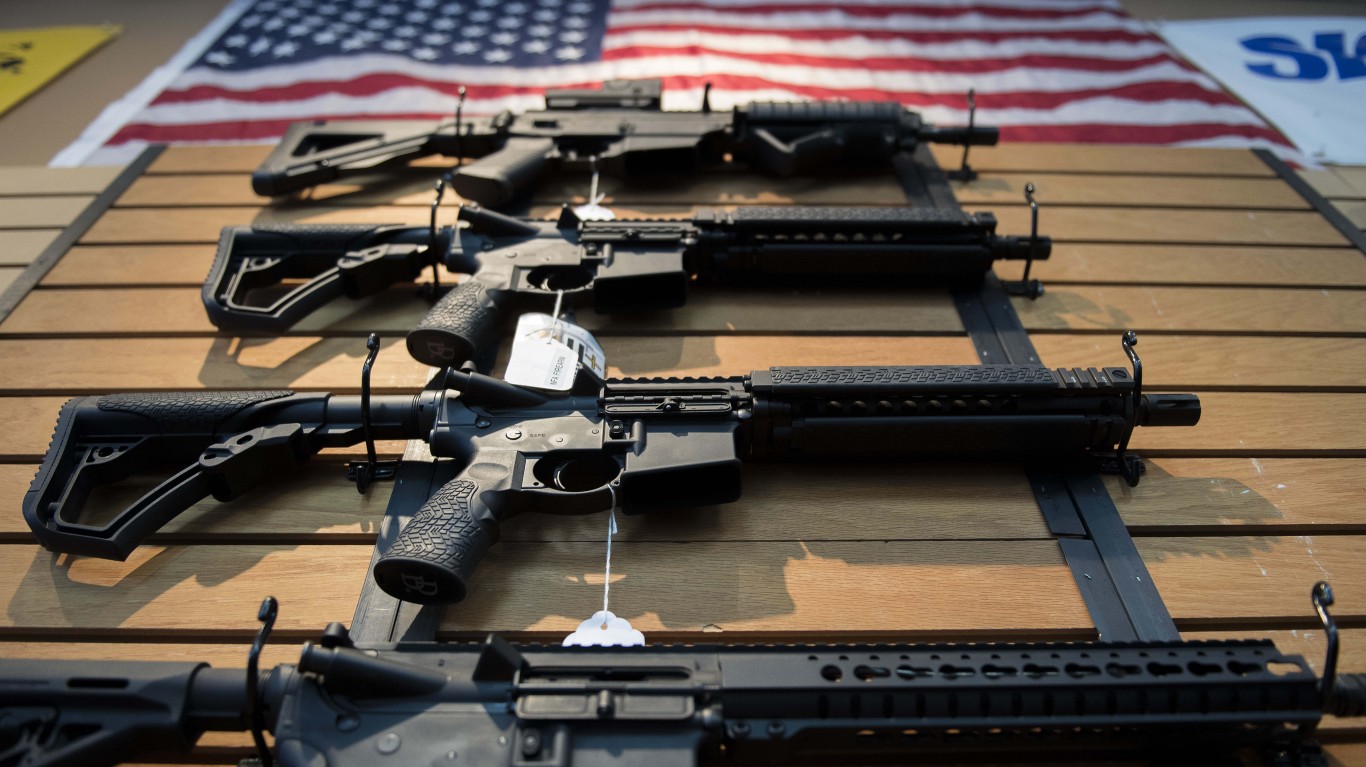
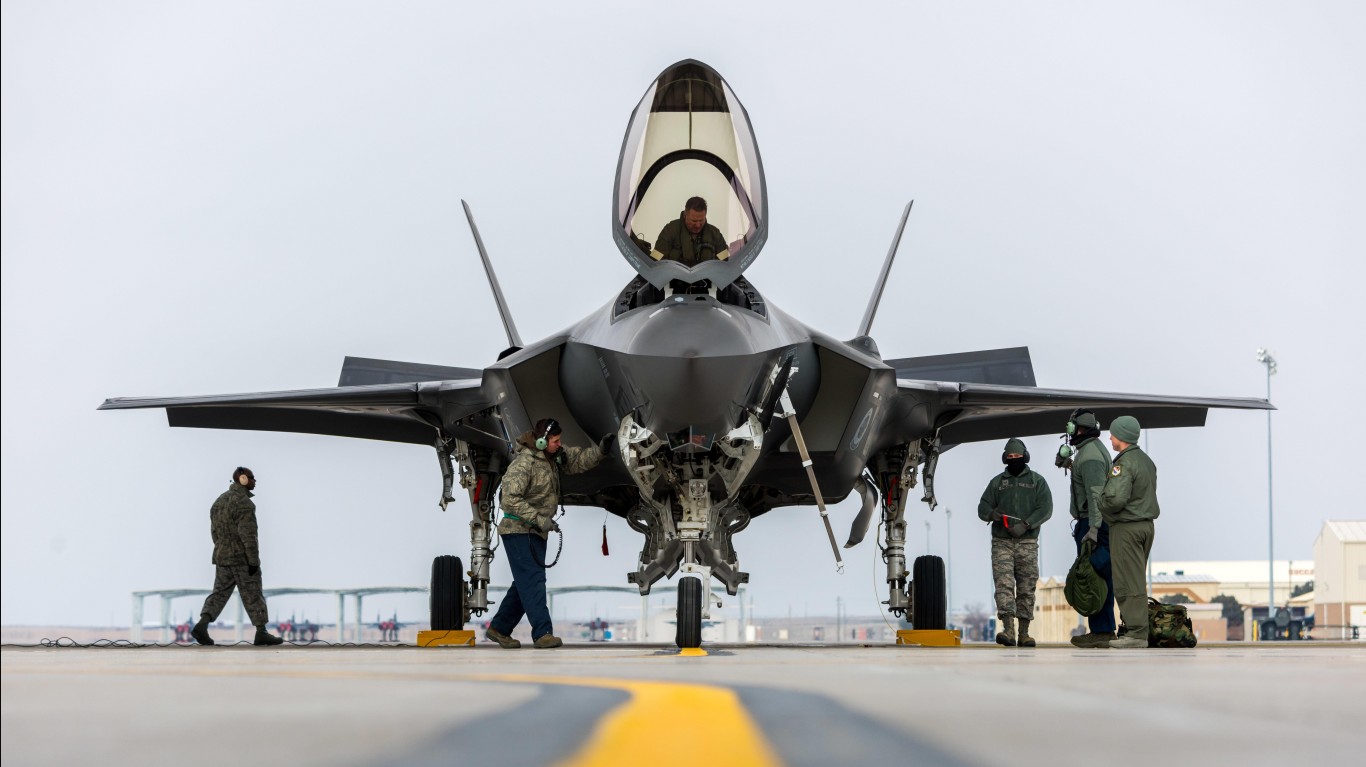
7. United States
> Change from 2009-13 to 2014-18: +29%
> Share of global arms exports (2014-18): 36.0%
> Share of global arms exports (2009-13): 30.0%
> Main client, share of supplier’s total exports: Saudi Arabia, 22%
> GDP per capita: $54,225
[in-text-ad-2]

6. France
> Change from 2009-13 to 2014-18: +43%
> Share of global arms exports (2014-18): 6.8%
> Share of global arms exports (2009-13): 5.1%
> Main client, share of supplier’s total exports: Egypt, 28%
> GDP per capita: $38,606

5. Israel
> Change from 2009-13 to 2014-18: +60%
> Share of global arms exports (2014-18): 3.1%
> Share of global arms exports (2009-13): 2.1%
> Main client, share of supplier’s total exports: India, 46%
> GDP per capita: $33,132
[in-text-ad]
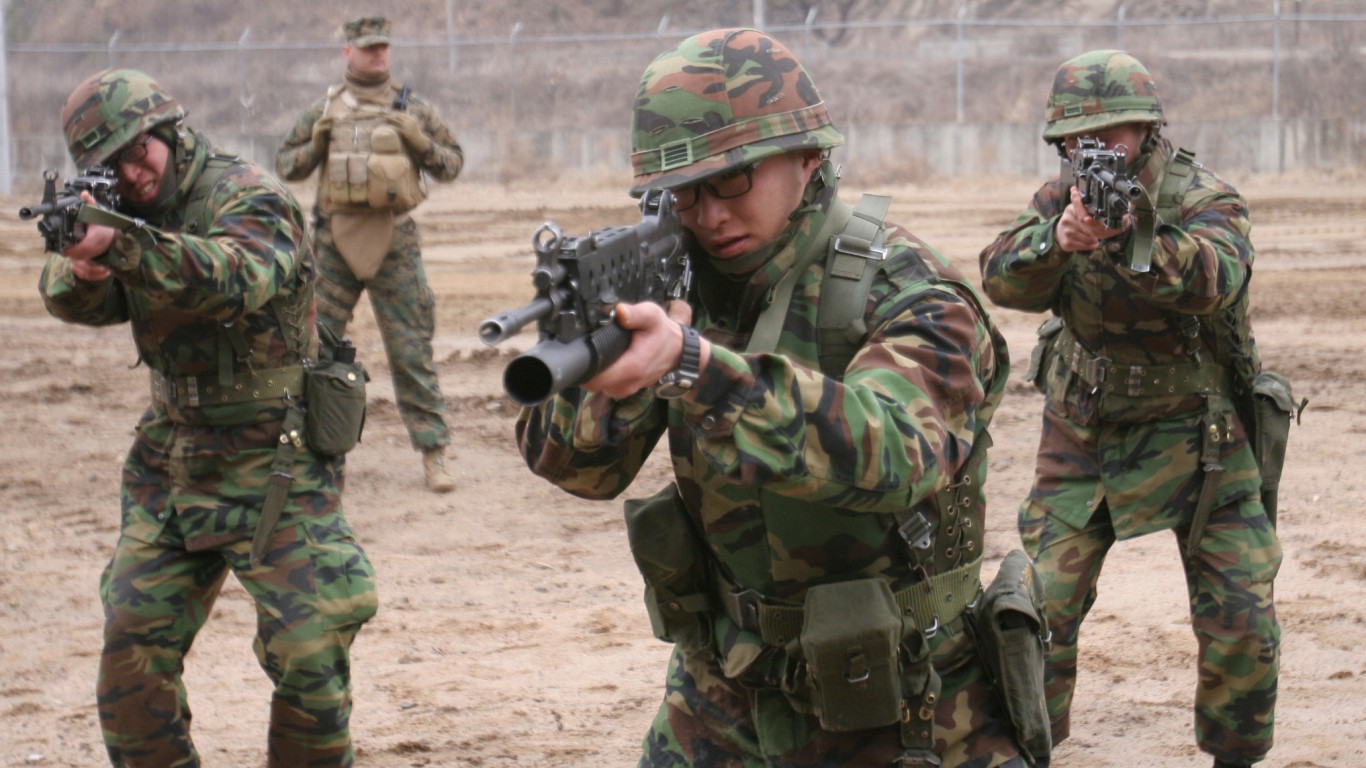
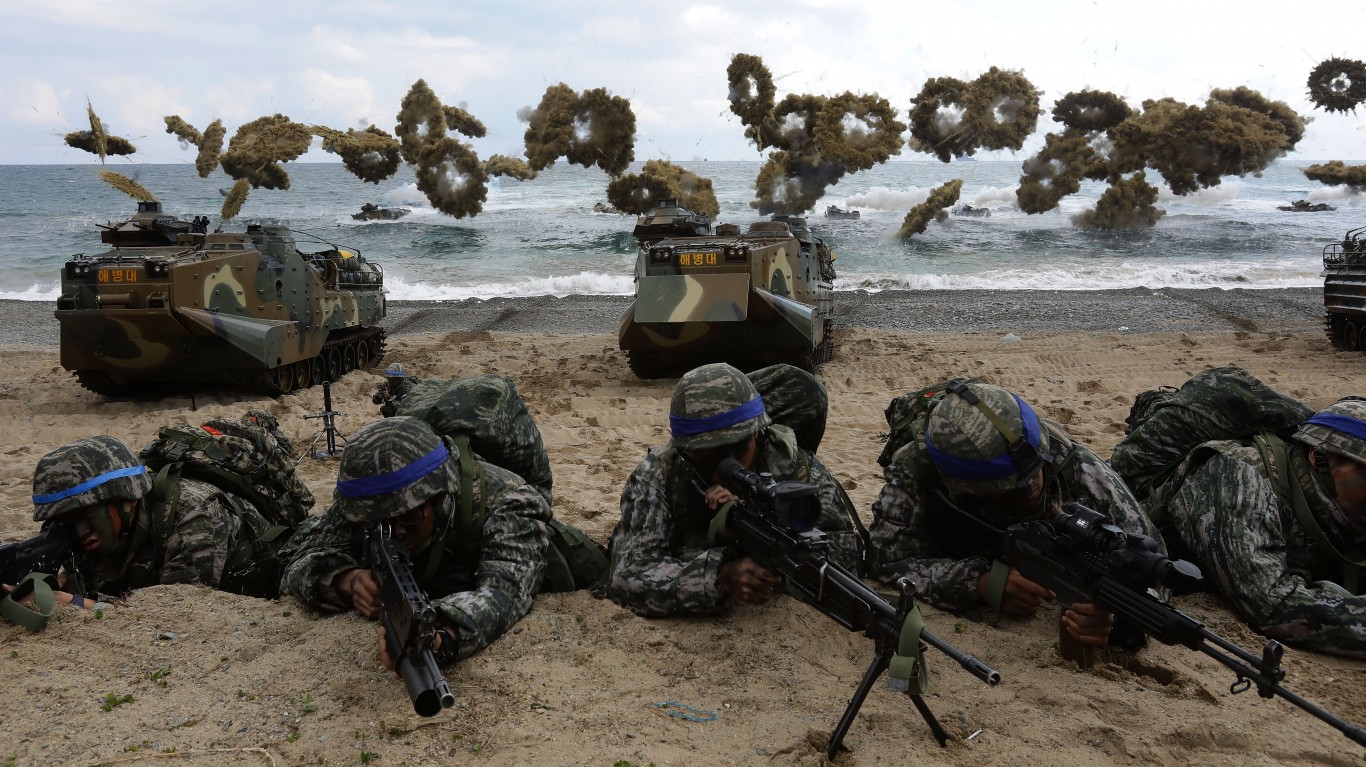
4. South Korea
> Change from 2009-13 to 2014-18: +94%
> Share of global arms exports (2014-18): 1.8%
> Share of global arms exports (2009-13): 1.0%
> Main client, share of supplier’s total exports: Indonesia, 17%
> GDP per capita: $35,938
[recirclink id=488561]
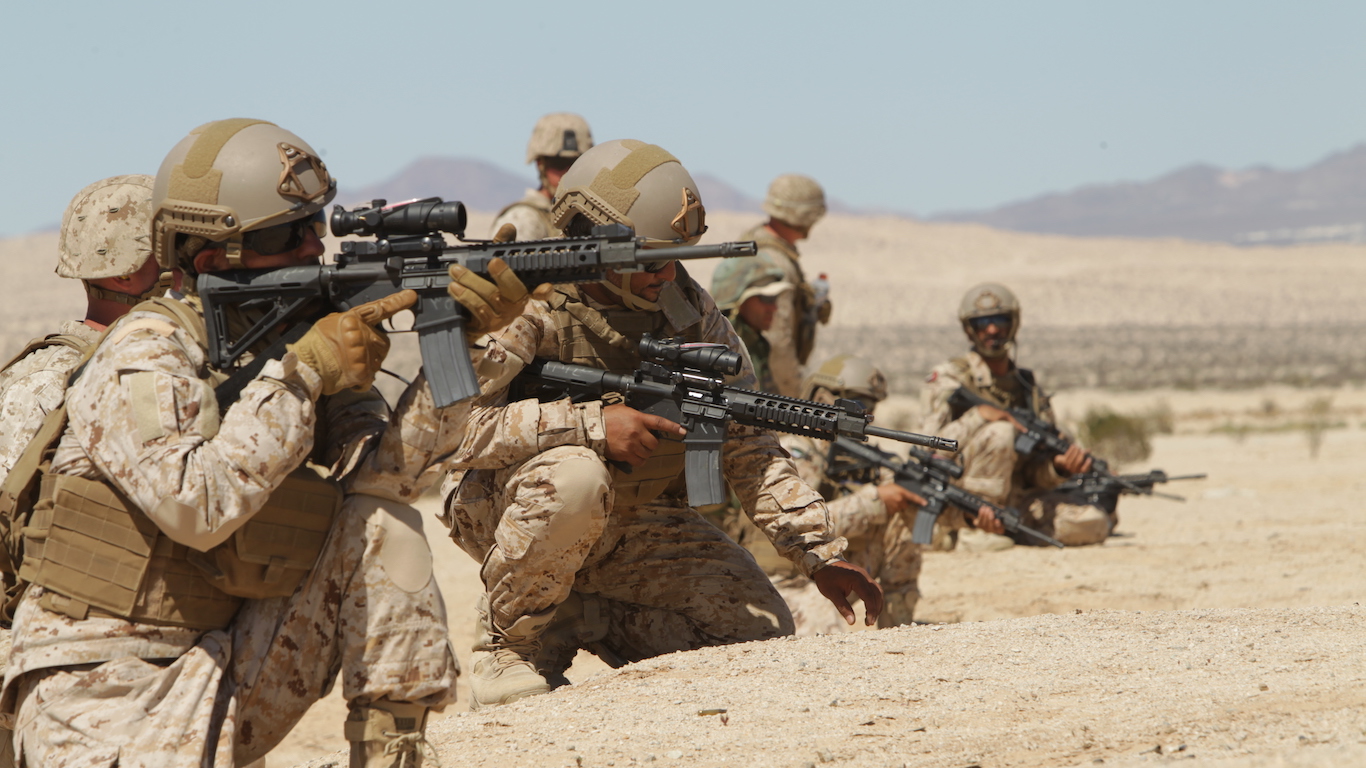
3. United Arab Emirates
> Change from 2009-13 to 2014-18: +103%
> Share of global arms exports (2014-18): 0.3%
> Share of global arms exports (2009-13): 0.2%
> Main client, share of supplier’s total exports: Egypt, 41%
> GDP per capita: $67,293
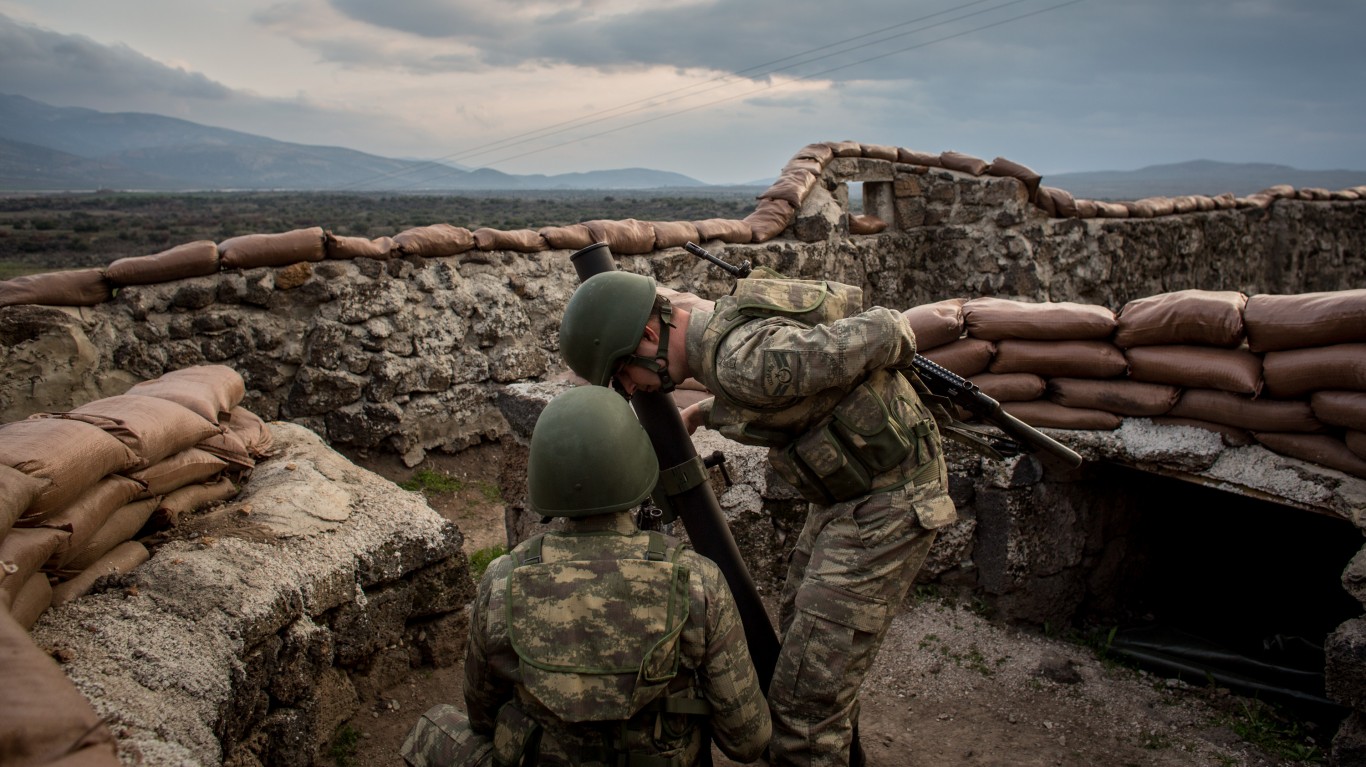
2. Turkey
> Change from 2009-13 to 2014-18: +170%
> Share of global arms exports (2014-18): 1.0%
> Share of global arms exports (2009-13): 0.4%
> Main client, share of supplier’s total exports: UAE, 30%
> GDP per capita: $25,135
[in-text-ad-2]
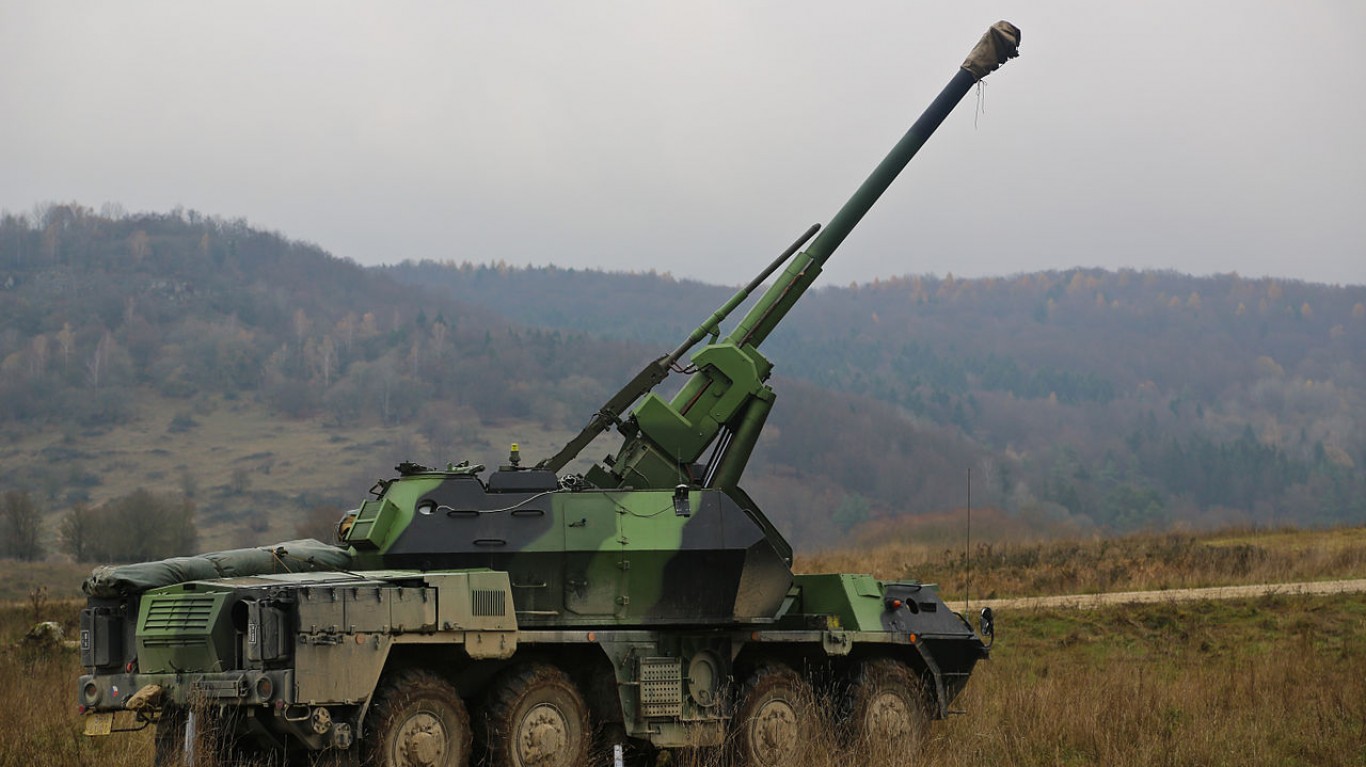
1. Czech Republic
> Change from 2009-13 to 2014-18: +472%
> Share of global arms exports (2014-18): 0.3%
> Share of global arms exports (2009-13): 0.1%
> Main client, share of supplier’s total exports: Iraq, 40%
> GDP per capita: $32,606