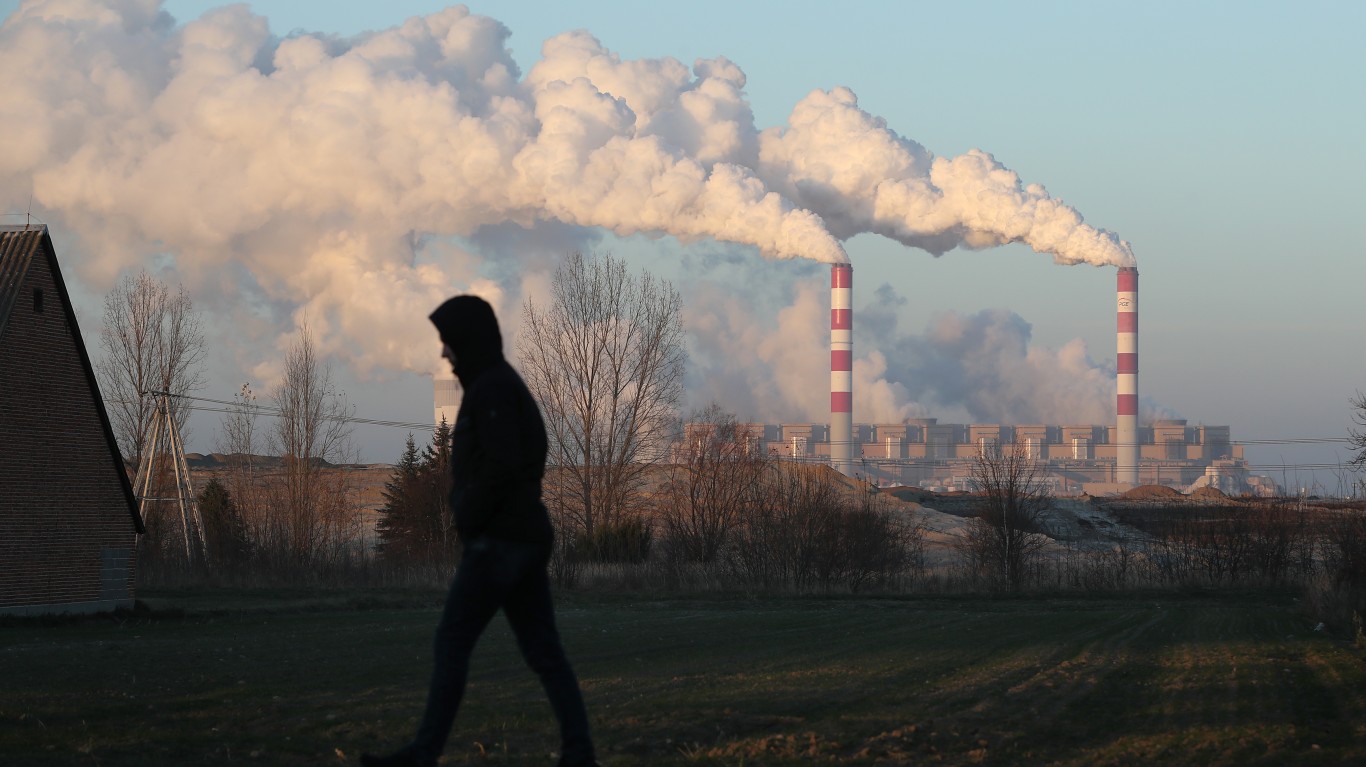
An alarming new report from the European Union’s Copernicus Climate Change Service asserted that 2023 is “virtually certain” to be the hottest year on record. In the United States, the devastating effects of a warming planet were evident throughout the summer – from severe flooding in Vermont to record breaking heat waves in Arizona and Florida.
The latest data represents the continuation of a longer term trend. According to the World Meteorological Organization, the eight years preceding 2023 were also the eight hottest years on record. Notably, through the Inflation Reduction Act, the Biden White House took unprecedented action to address the climate crisis, allocating nearly $370 billion to the effort. The new law is a crucial step to realizing the administration’s goal of cutting U.S. greenhouse gas emissions in half by 2030.
Still, it may be years before any meaningful results are realized, and in the meantime, the U.S. continues to pump billions of metric tons of carbon dioxide into the atmosphere every year. (Here is a look at the 20 countries emitting the most Co2.)
Using data from the EIA, 24/7 Wall St. identified the states driving up greenhouse gas emissions the most. We ranked all 50 states by the percent change in total energy-related carbon dioxide emissions between 2020 and 2021, the latest years of available data. The sources of carbon emissions include commercial, industrial, transportation, residential, and power generation.
From 2020 to 2021, America’s energy-related carbon emissions jumped by 6.9%, or nearly 317 million metric tons. Mississippi, Virginia, and Wyoming are the only three states to report an improvement in greenhouse gas emissions from 2020 to 2021. Among the remaining states, carbon emissions climbed by anywhere from 1.4% to 16.2% over the same period.
Encouragingly, the most recent national increase in carbon emissions may have been an anomaly. In 2020, America’s carbon footprint was reduced by the COVD-19 pandemic, as shelter-in-place policies reduced demand for energy and the burning of fossil fuels. By 2021, however, rising demand for consumer goods, increased use of coal in the face of rising natural gas prices, and vaccinations that allowed many to return to a more normal way of life resulted in a spike in carbon emissions.
Longer-term trends in U.S. greenhouse gas emissions further support this argument. Over the five years from 2017 to 2021, carbon emissions fell in all but eight states, declining by 5% or more in nearly half of all states. (These are the 25 worst cities to live in as global warming gets worse.)
Here are the states where carbon emissions are going up the most.
50. Wyoming
- 1-yr. change in energy-related carbon dioxide emissions: -1.9% (-1.0 million metric tons)
- 5-yr. change in energy-related carbon dioxide emissions: -13.1% (-8.2 million metric tons)
- Energy-related carbon dioxide emissions in 2021: 94.3 metric tons per person – the highest (54.6 million metric tons total)
- Energy-related carbon dioxide emissions in 2020: 96.2 metric tons per person – the highest (55.6 million metric tons total)
49. Virginia
- 1-yr. change in energy-related carbon dioxide emissions: -0.2% (-222,446 metric tons)
- 5-yr. change in energy-related carbon dioxide emissions: -7.2% (-7.6 million metric tons)
- Energy-related carbon dioxide emissions in 2021: 11.3 metric tons per person – 16th lowest (98.0 million metric tons total)
- Energy-related carbon dioxide emissions in 2020: 11.4 metric tons per person – 19th lowest (98.2 million metric tons total)
48. Mississippi

- 1-yr. change in energy-related carbon dioxide emissions: -0.2% (-98,052 metric tons)
- 5-yr. change in energy-related carbon dioxide emissions: +4.3% (+2.6 million metric tons)
- Energy-related carbon dioxide emissions in 2021: 21.4 metric tons per person – 15th highest (63.1 million metric tons total)
- Energy-related carbon dioxide emissions in 2020: 21.3 metric tons per person – 11th highest (63.2 million metric tons total)
47. South Dakota

- 1-yr. change in energy-related carbon dioxide emissions: +1.4% (+204,640 metric tons)
- 5-yr. change in energy-related carbon dioxide emissions: +3.4% (+500,422 metric tons)
- Energy-related carbon dioxide emissions in 2021: 16.9 metric tons per person – 20th highest (15.2 million metric tons total)
- Energy-related carbon dioxide emissions in 2020: 16.8 metric tons per person – 20th highest (15.0 million metric tons total)
46. New Mexico

- 1-yr. change in energy-related carbon dioxide emissions: +1.5% (+675,752 metric tons)
- 5-yr. change in energy-related carbon dioxide emissions: -7.5% (-3.7 million metric tons)
- Energy-related carbon dioxide emissions in 2021: 21.7 metric tons per person – 13th highest (45.9 million metric tons total)
- Energy-related carbon dioxide emissions in 2020: 21.3 metric tons per person – 12th highest (45.2 million metric tons total)
45. Nebraska

- 1-yr. change in energy-related carbon dioxide emissions: +1.5% (+712,840 metric tons)
- 5-yr. change in energy-related carbon dioxide emissions: -1.4% (-649,832 metric tons)
- Energy-related carbon dioxide emissions in 2021: 24.0 metric tons per person – 9th highest (47.2 million metric tons total)
- Energy-related carbon dioxide emissions in 2020: 23.7 metric tons per person – 7th highest (46.5 million metric tons total)
44. Oregon

- 1-yr. change in energy-related carbon dioxide emissions: +2.7% (+1.0 million metric tons)
- 5-yr. change in energy-related carbon dioxide emissions: -0.7% (-255,132 metric tons)
- Energy-related carbon dioxide emissions in 2021: 9.1 metric tons per person – 6th lowest (38.5 million metric tons total)
- Energy-related carbon dioxide emissions in 2020: 8.8 metric tons per person – 6th lowest (37.5 million metric tons total)
43. Vermont

- 1-yr. change in energy-related carbon dioxide emissions: +2.8% (+149,613 metric tons)
- 5-yr. change in energy-related carbon dioxide emissions: -4.4% (-258,736 metric tons)
- Energy-related carbon dioxide emissions in 2021: 8.6 metric tons per person – 5th lowest (5.6 million metric tons total)
- Energy-related carbon dioxide emissions in 2020: 8.4 metric tons per person – 5th lowest (5.4 million metric tons total)
42. Louisiana

- 1-yr. change in energy-related carbon dioxide emissions: +2.9% (+5.3 million metric tons)
- 5-yr. change in energy-related carbon dioxide emissions: -2.5% (-4.8 million metric tons)
- Energy-related carbon dioxide emissions in 2021: 40.8 metric tons per person – 5th highest (188.6 million metric tons total)
- Energy-related carbon dioxide emissions in 2020: 39.4 metric tons per person – 5th highest (183.3 million metric tons total)
41. Kansas

- 1-yr. change in energy-related carbon dioxide emissions: +3.4% (+2.0 million metric tons)
- 5-yr. change in energy-related carbon dioxide emissions: +1.2% (+725,806 metric tons)
- Energy-related carbon dioxide emissions in 2021: 20.3 metric tons per person – 17th highest (59.8 million metric tons total)
- Energy-related carbon dioxide emissions in 2020: 19.7 metric tons per person – 15th highest (57.8 million metric tons total)
40. Arizona
- 1-yr. change in energy-related carbon dioxide emissions: +3.6% (+2.9 million metric tons)
- 5-yr. change in energy-related carbon dioxide emissions: -8.2% (-7.5 million metric tons)
- Energy-related carbon dioxide emissions in 2021: 11.4 metric tons per person – 17th lowest (83.0 million metric tons total)
- Energy-related carbon dioxide emissions in 2020: 11.2 metric tons per person – 18th lowest (80.2 million metric tons total)
39. Delaware
- 1-yr. change in energy-related carbon dioxide emissions: +3.9% (+489,763 metric tons)
- 5-yr. change in energy-related carbon dioxide emissions: -5.8% (-802,128 metric tons)
- Energy-related carbon dioxide emissions in 2021: 12.9 metric tons per person – 21st lowest (13.0 million metric tons total)
- Energy-related carbon dioxide emissions in 2020: 12.6 metric tons per person – 23rd lowest (12.5 million metric tons total)
38. Oklahoma

- 1-yr. change in energy-related carbon dioxide emissions: +4.1% (+3.4 million metric tons)
- 5-yr. change in energy-related carbon dioxide emissions: -6.0% (-5.7 million metric tons)
- Energy-related carbon dioxide emissions in 2021: 22.0 metric tons per person – 12th highest (87.8 million metric tons total)
- Energy-related carbon dioxide emissions in 2020: 21.3 metric tons per person – 13th highest (84.4 million metric tons total)
37. North Dakota
- 1-yr. change in energy-related carbon dioxide emissions: +4.2% (+2.3 million metric tons)
- 5-yr. change in energy-related carbon dioxide emissions: -0.7% (-382,006 metric tons)
- Energy-related carbon dioxide emissions in 2021: 72.7 metric tons per person – 2nd highest (56.5 million metric tons total)
- Energy-related carbon dioxide emissions in 2020: 69.6 metric tons per person – 2nd highest (54.3 million metric tons total)
36. Ohio

- 1-yr. change in energy-related carbon dioxide emissions: +4.5% (+8.4 million metric tons)
- 5-yr. change in energy-related carbon dioxide emissions: -5.4% (-11.0 million metric tons)
- Energy-related carbon dioxide emissions in 2021: 16.5 metric tons per person – 21st highest (194.0 million metric tons total)
- Energy-related carbon dioxide emissions in 2020: 15.7 metric tons per person – 21st highest (185.7 million metric tons total)
35. Idaho

- 1-yr. change in energy-related carbon dioxide emissions: +6.0% (+1.2 million metric tons)
- 5-yr. change in energy-related carbon dioxide emissions: +9.7% (+1.8 million metric tons)
- Energy-related carbon dioxide emissions in 2021: 10.8 metric tons per person – 14th lowest (20.5 million metric tons total)
- Energy-related carbon dioxide emissions in 2020: 10.5 metric tons per person – 16th lowest (19.4 million metric tons total)
34. Minnesota

- 1-yr. change in energy-related carbon dioxide emissions: +6.1% (+4.8 million metric tons)
- 5-yr. change in energy-related carbon dioxide emissions: -8.9% (-8.1 million metric tons)
- Energy-related carbon dioxide emissions in 2021: 14.6 metric tons per person – 25th lowest (83.2 million metric tons total)
- Energy-related carbon dioxide emissions in 2020: 13.7 metric tons per person – 25th highest (78.4 million metric tons total)
33. Texas

- 1-yr. change in energy-related carbon dioxide emissions: +6.2% (+38.8 million metric tons)
- 5-yr. change in energy-related carbon dioxide emissions: -0.2% (-1.6 million metric tons)
- Energy-related carbon dioxide emissions in 2021: 22.4 metric tons per person – 11th highest (663.5 million metric tons total)
- Energy-related carbon dioxide emissions in 2020: 21.4 metric tons per person – 10th highest (624.7 million metric tons total)
32. Wisconsin

- 1-yr. change in energy-related carbon dioxide emissions: +6.2% (+5.4 million metric tons)
- 5-yr. change in energy-related carbon dioxide emissions: -6.3% (-6.2 million metric tons)
- Energy-related carbon dioxide emissions in 2021: 15.7 metric tons per person – 23rd highest (92.5 million metric tons total)
- Energy-related carbon dioxide emissions in 2020: 14.8 metric tons per person – 23rd highest (87.0 million metric tons total)
31. New Jersey

- 1-yr. change in energy-related carbon dioxide emissions: +6.3% (+5.3 million metric tons)
- 5-yr. change in energy-related carbon dioxide emissions: -10.3% (-10.2 million metric tons)
- Energy-related carbon dioxide emissions in 2021: 9.6 metric tons per person – 9th lowest (89.1 million metric tons total)
- Energy-related carbon dioxide emissions in 2020: 9.0 metric tons per person – 10th lowest (83.8 million metric tons total)
30. Georgia

- 1-yr. change in energy-related carbon dioxide emissions: +6.5% (+7.5 million metric tons)
- 5-yr. change in energy-related carbon dioxide emissions: -12.5% (-17.7 million metric tons)
- Energy-related carbon dioxide emissions in 2021: 11.5 metric tons per person – 18th lowest (124.1 million metric tons total)
- Energy-related carbon dioxide emissions in 2020: 10.9 metric tons per person – 17th lowest (116.6 million metric tons total)
29. California

- 1-yr. change in energy-related carbon dioxide emissions: +6.7% (+20.2 million metric tons)
- 5-yr. change in energy-related carbon dioxide emissions: -9.1% (-32.5 million metric tons)
- Energy-related carbon dioxide emissions in 2021: 8.3 metric tons per person – 3rd lowest (324.0 million metric tons total)
- Energy-related carbon dioxide emissions in 2020: 7.7 metric tons per person – 3rd lowest (303.8 million metric tons total)
28. New Hampshire

- 1-yr. change in energy-related carbon dioxide emissions: +6.7% (+831,385 metric tons)
- 5-yr. change in energy-related carbon dioxide emissions: -1.6% (-222,708 metric tons)
- Energy-related carbon dioxide emissions in 2021: 9.6 metric tons per person – 8th lowest (13.3 million metric tons total)
- Energy-related carbon dioxide emissions in 2020: 9.0 metric tons per person – 9th lowest (12.5 million metric tons total)
27. Maine

- 1-yr. change in energy-related carbon dioxide emissions: +6.7% (+904,274 metric tons)
- 5-yr. change in energy-related carbon dioxide emissions: -6.3% (-969,048 metric tons)
- Energy-related carbon dioxide emissions in 2021: 10.5 metric tons per person – 13th lowest (14.4 million metric tons total)
- Energy-related carbon dioxide emissions in 2020: 9.9 metric tons per person – 13th lowest (13.5 million metric tons total)
26. Colorado
- 1-yr. change in energy-related carbon dioxide emissions: +6.8% (+5.5 million metric tons)
- 5-yr. change in energy-related carbon dioxide emissions: -3.8% (-3.4 million metric tons)
- Energy-related carbon dioxide emissions in 2021: 14.7 metric tons per person – 25th highest (85.4 million metric tons total)
- Energy-related carbon dioxide emissions in 2020: 13.8 metric tons per person – 24th highest (79.9 million metric tons total)
25. Massachusetts
- 1-yr. change in energy-related carbon dioxide emissions: +7.3% (+3.8 million metric tons)
- 5-yr. change in energy-related carbon dioxide emissions: -13.3% (-8.6 million metric tons)
- Energy-related carbon dioxide emissions in 2021: 8.0 metric tons per person – 2nd lowest (56.1 million metric tons total)
- Energy-related carbon dioxide emissions in 2020: 7.5 metric tons per person – 2nd lowest (52.3 million metric tons total)
24. Missouri

- 1-yr. change in energy-related carbon dioxide emissions: +7.6% (+8.2 million metric tons)
- 5-yr. change in energy-related carbon dioxide emissions: -6.1% (-7.6 million metric tons)
- Energy-related carbon dioxide emissions in 2021: 19.0 metric tons per person – 18th highest (117.0 million metric tons total)
- Energy-related carbon dioxide emissions in 2020: 17.7 metric tons per person – 18th highest (108.7 million metric tons total)
23. Indiana

- 1-yr. change in energy-related carbon dioxide emissions: +7.7% (+11.9 million metric tons)
- 5-yr. change in energy-related carbon dioxide emissions: -5.4% (-9.5 million metric tons)
- Energy-related carbon dioxide emissions in 2021: 24.4 metric tons per person – 8th highest (166.4 million metric tons total)
- Energy-related carbon dioxide emissions in 2020: 22.7 metric tons per person – 8th highest (154.4 million metric tons total)
22. Washington

- 1-yr. change in energy-related carbon dioxide emissions: +7.9% (+5.4 million metric tons)
- 5-yr. change in energy-related carbon dioxide emissions: -6.7% (-5.3 million metric tons)
- Energy-related carbon dioxide emissions in 2021: 9.5 metric tons per person – 7th lowest (73.8 million metric tons total)
- Energy-related carbon dioxide emissions in 2020: 8.9 metric tons per person – 7th lowest (68.4 million metric tons total)
21. Michigan

- 1-yr. change in energy-related carbon dioxide emissions: +8.0% (+11.0 million metric tons)
- 5-yr. change in energy-related carbon dioxide emissions: -5.0% (-7.9 million metric tons)
- Energy-related carbon dioxide emissions in 2021: 14.7 metric tons per person – 24th highest (147.8 million metric tons total)
- Energy-related carbon dioxide emissions in 2020: 13.6 metric tons per person – 25th lowest (136.9 million metric tons total)
20. Alaska

- 1-yr. change in energy-related carbon dioxide emissions: +8.0% (+2.9 million metric tons)
- 5-yr. change in energy-related carbon dioxide emissions: +15.2% (+5.1 million metric tons)
- Energy-related carbon dioxide emissions in 2021: 53.0 metric tons per person – 3rd highest (38.9 million metric tons total)
- Energy-related carbon dioxide emissions in 2020: 49.1 metric tons per person – 3rd highest (36.0 million metric tons total)
19. Utah

- 1-yr. change in energy-related carbon dioxide emissions: +8.1% (+4.7 million metric tons)
- 5-yr. change in energy-related carbon dioxide emissions: +5.1% (+3.0 million metric tons)
- Energy-related carbon dioxide emissions in 2021: 18.6 metric tons per person – 19th highest (62.1 million metric tons total)
- Energy-related carbon dioxide emissions in 2020: 17.5 metric tons per person – 19th highest (57.4 million metric tons total)
18. Illinois
- 1-yr. change in energy-related carbon dioxide emissions: +8.3% (+14.1 million metric tons)
- 5-yr. change in energy-related carbon dioxide emissions: -10.6% (-21.7 million metric tons)
- Energy-related carbon dioxide emissions in 2021: 14.5 metric tons per person – 24th lowest (184.2 million metric tons total)
- Energy-related carbon dioxide emissions in 2020: 13.3 metric tons per person – 24th lowest (170.2 million metric tons total)
17. Rhode Island

- 1-yr. change in energy-related carbon dioxide emissions: +8.3% (+815,845 metric tons)
- 5-yr. change in energy-related carbon dioxide emissions: +6.8% (+676,797 metric tons)
- Energy-related carbon dioxide emissions in 2021: 9.7 metric tons per person – 10th lowest (10.6 million metric tons total)
- Energy-related carbon dioxide emissions in 2020: 9.0 metric tons per person – 8th lowest (9.8 million metric tons total)
16. Connecticut

- 1-yr. change in energy-related carbon dioxide emissions: +8.3% (+2.8 million metric tons)
- 5-yr. change in energy-related carbon dioxide emissions: +8.0% (+2.7 million metric tons)
- Energy-related carbon dioxide emissions in 2021: 10.1 metric tons per person – 11th lowest (36.6 million metric tons total)
- Energy-related carbon dioxide emissions in 2020: 9.4 metric tons per person – 11th lowest (33.8 million metric tons total)
15. North Carolina

- 1-yr. change in energy-related carbon dioxide emissions: +8.4% (+9.0 million metric tons)
- 5-yr. change in energy-related carbon dioxide emissions: -4.6% (-5.6 million metric tons)
- Energy-related carbon dioxide emissions in 2021: 10.9 metric tons per person – 15th lowest (115.6 million metric tons total)
- Energy-related carbon dioxide emissions in 2020: 10.2 metric tons per person – 14th lowest (106.6 million metric tons total)
14. Montana
- 1-yr. change in energy-related carbon dioxide emissions: +8.5% (+2.2 million metric tons)
- 5-yr. change in energy-related carbon dioxide emissions: -8.7% (-2.7 million metric tons)
- Energy-related carbon dioxide emissions in 2021: 25.8 metric tons per person – 6th highest (28.5 million metric tons total)
- Energy-related carbon dioxide emissions in 2020: 24.2 metric tons per person – 6th highest (26.3 million metric tons total)
13. New York

- 1-yr. change in energy-related carbon dioxide emissions: +8.8% (+12.6 million metric tons)
- 5-yr. change in energy-related carbon dioxide emissions: -5.9% (-9.8 million metric tons)
- Energy-related carbon dioxide emissions in 2021: 7.9 metric tons per person – the lowest (156.0 million metric tons total)
- Energy-related carbon dioxide emissions in 2020: 7.1 metric tons per person – the lowest (143.4 million metric tons total)
12. Nevada

- 1-yr. change in energy-related carbon dioxide emissions: +8.9% (+3.2 million metric tons)
- 5-yr. change in energy-related carbon dioxide emissions: -1.9% (-782,687 metric tons)
- Energy-related carbon dioxide emissions in 2021: 12.5 metric tons per person – 20th lowest (39.4 million metric tons total)
- Energy-related carbon dioxide emissions in 2020: 11.6 metric tons per person – 20th lowest (36.2 million metric tons total)
11. Florida
- 1-yr. change in energy-related carbon dioxide emissions: +9.0% (+18.6 million metric tons)
- 5-yr. change in energy-related carbon dioxide emissions: -5.1% (-12.1 million metric tons)
- Energy-related carbon dioxide emissions in 2021: 10.4 metric tons per person – 12th lowest (226.3 million metric tons total)
- Energy-related carbon dioxide emissions in 2020: 9.6 metric tons per person – 12th lowest (207.7 million metric tons total)
10. South Carolina

- 1-yr. change in energy-related carbon dioxide emissions: +9.1% (+5.8 million metric tons)
- 5-yr. change in energy-related carbon dioxide emissions: -0.9% (-625,075 metric tons)
- Energy-related carbon dioxide emissions in 2021: 13.4 metric tons per person – 23rd lowest (69.3 million metric tons total)
- Energy-related carbon dioxide emissions in 2020: 12.4 metric tons per person – 22nd lowest (63.6 million metric tons total)
9. Maryland
- 1-yr. change in energy-related carbon dioxide emissions: +9.3% (+4.5 million metric tons)
- 5-yr. change in energy-related carbon dioxide emissions: -4.5% (-2.5 million metric tons)
- Energy-related carbon dioxide emissions in 2021: 8.5 metric tons per person – 4th lowest (52.6 million metric tons total)
- Energy-related carbon dioxide emissions in 2020: 7.8 metric tons per person – 4th lowest (48.1 million metric tons total)
8. Kentucky

- 1-yr. change in energy-related carbon dioxide emissions: +10.0% (+10.1 million metric tons)
- 5-yr. change in energy-related carbon dioxide emissions: -4.7% (-5.5 million metric tons)
- Energy-related carbon dioxide emissions in 2021: 24.7 metric tons per person – 7th highest (111.3 million metric tons total)
- Energy-related carbon dioxide emissions in 2020: 22.4 metric tons per person – 9th highest (101.2 million metric tons total)
7. Alabama

- 1-yr. change in energy-related carbon dioxide emissions: +10.1% (+10.0 million metric tons)
- 5-yr. change in energy-related carbon dioxide emissions: -0.2% (-202,453 metric tons)
- Energy-related carbon dioxide emissions in 2021: 21.5 metric tons per person – 14th highest (108.4 million metric tons total)
- Energy-related carbon dioxide emissions in 2020: 19.6 metric tons per person – 16th highest (98.4 million metric tons total)
6. Pennsylvania

- 1-yr. change in energy-related carbon dioxide emissions: +10.5% (+20.2 million metric tons)
- 5-yr. change in energy-related carbon dioxide emissions: -0.8% (-1.8 million metric tons)
- Energy-related carbon dioxide emissions in 2021: 16.4 metric tons per person – 22nd highest (213.5 million metric tons total)
- Energy-related carbon dioxide emissions in 2020: 14.9 metric tons per person – 22nd highest (193.3 million metric tons total)
5. Tennessee

- 1-yr. change in energy-related carbon dioxide emissions: +11.2% (+9.4 million metric tons)
- 5-yr. change in energy-related carbon dioxide emissions: -4.9% (-4.7 million metric tons)
- Energy-related carbon dioxide emissions in 2021: 13.3 metric tons per person – 22nd lowest (92.7 million metric tons total)
- Energy-related carbon dioxide emissions in 2020: 12.0 metric tons per person – 21st lowest (83.3 million metric tons total)
4. Iowa
- 1-yr. change in energy-related carbon dioxide emissions: +11.4% (+7.5 million metric tons)
- 5-yr. change in energy-related carbon dioxide emissions: -4.1% (-3.2 million metric tons)
- Energy-related carbon dioxide emissions in 2021: 22.9 metric tons per person – 10th highest (73.1 million metric tons total)
- Energy-related carbon dioxide emissions in 2020: 20.6 metric tons per person – 14th highest (65.7 million metric tons total)
3. Arkansas
- 1-yr. change in energy-related carbon dioxide emissions: +13.3% (+7.3 million metric tons)
- 5-yr. change in energy-related carbon dioxide emissions: -3.4% (-2.2 million metric tons)
- Energy-related carbon dioxide emissions in 2021: 20.5 metric tons per person – 16th highest (62.0 million metric tons total)
- Energy-related carbon dioxide emissions in 2020: 18.2 metric tons per person – 17th highest (54.7 million metric tons total)
2. West Virginia
- 1-yr. change in energy-related carbon dioxide emissions: +14.9% (+11.5 million metric tons)
- 5-yr. change in energy-related carbon dioxide emissions: -2.7% (-2.4 million metric tons)
- Energy-related carbon dioxide emissions in 2021: 49.5 metric tons per person – 4th highest (88.4 million metric tons total)
- Energy-related carbon dioxide emissions in 2020: 43.0 metric tons per person – 4th highest (76.9 million metric tons total)
1. Hawaii

- 1-yr. change in energy-related carbon dioxide emissions: +16.2% (+2.4 million metric tons)
- 5-yr. change in energy-related carbon dioxide emissions: -15.1% (-3.1 million metric tons)
- Energy-related carbon dioxide emissions in 2021: 12.0 metric tons per person – 19th lowest (17.3 million metric tons total)
- Energy-related carbon dioxide emissions in 2020: 10.3 metric tons per person – 15th lowest (14.9 million metric tons total)
Methodology
To identify the states where carbon emissions are rising fastest, 24/7 Wall St. reviewed data from the U.S. Energy Information Administration, a division of the Department of Energy. States are ranked on percent change in energy-related carbon dioxide emissions from 2020 to 2021.
We also reviewed five-year changes – 2017 to 2021 – in carbon emissions by state, though this longer term trend was not considered in the ranking.
Data on carbon emissions per capita is also from the Energy Information Administration.