In an era of economic uncertainty, the U.S. job market remains resilient. After falling to 3.7% in November 2023, the national unemployment rate has been below 4% for 22 consecutive months, the longest streak in over 50 years.
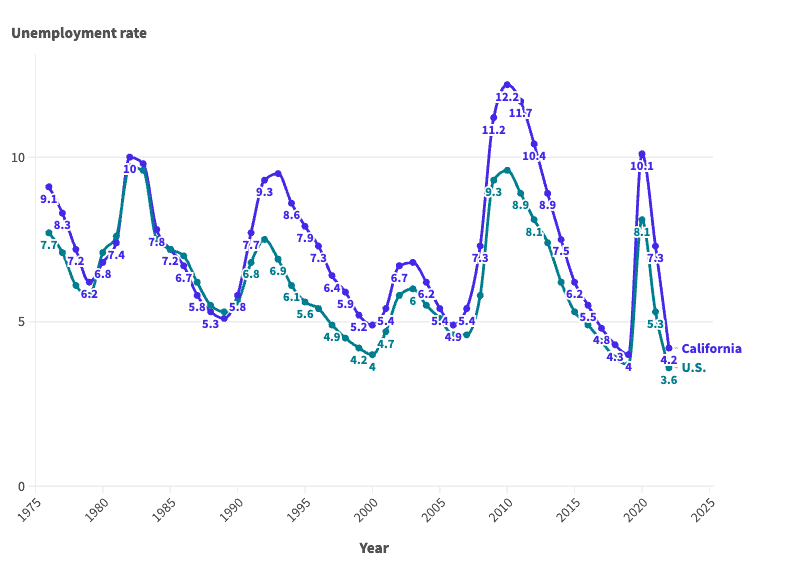
Of course, if history is any guide, much of the economy is subject to boom and bust cycles — and the job market is no exception. Since the mid-1970s, the average annual unemployment rate in the U.S. has fluctuated between 3.6% and nearly 10%, according to the Bureau of Labor Statistics.
These same cyclical patterns are also evident in California, where the job market is supported largely by the professional and scientific and retail trade industries. The annual unemployment rate in the state was 4.2% in 2022, closely in line with the state’s lowest recorded annual jobless rate of 4%. However, conditions for job seekers have not always been so favorable.
According to historical BLS data going back to 1976, the annual jobless rate has been as high as 12.2% in California. More than once, unemployment in the state has either matched or come close to that peak.
This is how California’s job market has changed in each of the last 47 years.
1976
- Avg. unemployment rate: 9.1% (7.7% nationwide)
- Labor force participation rate: 62.5% (61.6% nationwide)
- Unemployed population in California: 908,635
1977

- Avg. unemployment rate: 8.3% (7.1% nationwide)
- Labor force participation rate: 63.8% (62.3% nationwide)
- Unemployed population in California: 868,374
1978

- Avg. unemployment rate: 7.2% (6.1% nationwide)
- Labor force participation rate: 65.1% (63.2% nationwide)
- Unemployed population in California: 778,834
1979
- Avg. unemployment rate: 6.2% (5.8% nationwide)
- Labor force participation rate: 65.6% (63.7% nationwide)
- Unemployed population in California: 701,996
1980
- Avg. unemployment rate: 6.8% (7.1% nationwide)
- Labor force participation rate: 65.6% (63.8% nationwide)
- Unemployed population in California: 798,795
1981

- Avg. unemployment rate: 7.4% (7.6% nationwide)
- Labor force participation rate: 65.4% (63.9% nationwide)
- Unemployed population in California: 879,116
1982
- Avg. unemployment rate: 10.0% (9.7% nationwide)
- Labor force participation rate: 66.0% (64.0% nationwide)
- Unemployed population in California: 1,223,926
1983
- Avg. unemployment rate: 9.8% (9.6% nationwide)
- Labor force participation rate: 65.7% (64.0% nationwide)
- Unemployed population in California: 1,207,942
1984
- Avg. unemployment rate: 7.8% (7.5% nationwide)
- Labor force participation rate: 65.8% (64.4% nationwide)
- Unemployed population in California: 977,154
1985
- Avg. unemployment rate: 7.2% (7.2% nationwide)
- Labor force participation rate: 66.0% (64.8% nationwide)
- Unemployed population in California: 933,949
1986
- Avg. unemployment rate: 6.7% (7.0% nationwide)
- Labor force participation rate: 66.5% (65.3% nationwide)
- Unemployed population in California: 900,489
1987
- Avg. unemployment rate: 5.8% (6.2% nationwide)
- Labor force participation rate: 66.9% (65.6% nationwide)
- Unemployed population in California: 801,291
1988
- Avg. unemployment rate: 5.3% (5.5% nationwide)
- Labor force participation rate: 67.4% (65.9% nationwide)
- Unemployed population in California: 745,913
1989
- Avg. unemployment rate: 5.1% (5.3% nationwide)
- Labor force participation rate: 67.7% (66.5% nationwide)
- Unemployed population in California: 739,894
1990
- Avg. unemployment rate: 5.8% (5.6% nationwide)
- Labor force participation rate: 67.0% (66.5% nationwide)
- Unemployed population in California: 873,843
1991
- Avg. unemployment rate: 7.7% (6.8% nationwide)
- Labor force participation rate: 66.4% (66.2% nationwide)
- Unemployed population in California: 1,180,805
1992
- Avg. unemployment rate: 9.3% (7.5% nationwide)
- Labor force participation rate: 66.4% (66.4% nationwide)
- Unemployed population in California: 1,432,475
1993
- Avg. unemployment rate: 9.5% (6.9% nationwide)
- Labor force participation rate: 65.9% (66.3% nationwide)
- Unemployed population in California: 1,453,169
1994
- Avg. unemployment rate: 8.6% (6.1% nationwide)
- Labor force participation rate: 65.8% (66.6% nationwide)
- Unemployed population in California: 1,322,849
1995
- Avg. unemployment rate: 7.9% (5.6% nationwide)
- Labor force participation rate: 65.6% (66.6% nationwide)
- Unemployed population in California: 1,204,269
1996
- Avg. unemployment rate: 7.3% (5.4% nationwide)
- Labor force participation rate: 65.7% (66.8% nationwide)
- Unemployed population in California: 1,131,644
1997
- Avg. unemployment rate: 6.4% (4.9% nationwide)
- Labor force participation rate: 66.3% (67.1% nationwide)
- Unemployed population in California: 1,011,078
1998
- Avg. unemployment rate: 5.9% (4.5% nationwide)
- Labor force participation rate: 66.6% (67.1% nationwide)
- Unemployed population in California: 960,743
1999
- Avg. unemployment rate: 5.2% (4.2% nationwide)
- Labor force participation rate: 66.5% (67.1% nationwide)
- Unemployed population in California: 867,316
2000
- Avg. unemployment rate: 4.9% (4.0% nationwide)
- Labor force participation rate: 67.0% (67.1% nationwide)
- Unemployed population in California: 825,917
2001
- Avg. unemployment rate: 5.4% (4.7% nationwide)
- Labor force participation rate: 67.0% (66.8% nationwide)
- Unemployed population in California: 935,919
2002
- Avg. unemployment rate: 6.7% (5.8% nationwide)
- Labor force participation rate: 66.6% (66.6% nationwide)
- Unemployed population in California: 1,165,056
2003
- Avg. unemployment rate: 6.8% (6.0% nationwide)
- Labor force participation rate: 65.9% (66.2% nationwide)
- Unemployed population in California: 1,190,384
2004
- Avg. unemployment rate: 6.2% (5.5% nationwide)
- Labor force participation rate: 65.6% (66.0% nationwide)
- Unemployed population in California: 1,080,951
2005
- Avg. unemployment rate: 5.4% (5.1% nationwide)
- Labor force participation rate: 65.5% (66.0% nationwide)
- Unemployed population in California: 944,309
2006
- Avg. unemployment rate: 4.9% (4.6% nationwide)
- Labor force participation rate: 65.4% (66.2% nationwide)
- Unemployed population in California: 863,334
2007
- Avg. unemployment rate: 5.4% (4.6% nationwide)
- Labor force participation rate: 65.7% (66.0% nationwide)
- Unemployed population in California: 955,326
2008
- Avg. unemployment rate: 7.3% (5.8% nationwide)
- Labor force participation rate: 65.9% (66.0% nationwide)
- Unemployed population in California: 1,323,825
2009

- Avg. unemployment rate: 11.2% (9.3% nationwide)
- Labor force participation rate: 65.5% (65.4% nationwide)
- Unemployed population in California: 2,112,831
2010
- Avg. unemployment rate: 12.2% (9.6% nationwide)
- Labor force participation rate: 64.4% (64.7% nationwide)
- Unemployed population in California: 2,292,082
2011
- Avg. unemployment rate: 11.7% (8.9% nationwide)
- Labor force participation rate: 63.6% (64.1% nationwide)
- Unemployed population in California: 2,186,154
2012
- Avg. unemployment rate: 10.4% (8.1% nationwide)
- Labor force participation rate: 63.1% (63.7% nationwide)
- Unemployed population in California: 1,943,842
2013
- Avg. unemployment rate: 8.9% (7.4% nationwide)
- Labor force participation rate: 62.7% (63.2% nationwide)
- Unemployed population in California: 1,677,544
2014
- Avg. unemployment rate: 7.5% (6.2% nationwide)
- Labor force participation rate: 62.3% (62.9% nationwide)
- Unemployed population in California: 1,412,174
2015
- Avg. unemployment rate: 6.2% (5.3% nationwide)
- Labor force participation rate: 62.2% (62.7% nationwide)
- Unemployed population in California: 1,176,732
2016
- Avg. unemployment rate: 5.5% (4.9% nationwide)
- Labor force participation rate: 62.2% (62.8% nationwide)
- Unemployed population in California: 1,046,610
2017
- Avg. unemployment rate: 4.8% (4.4% nationwide)
- Labor force participation rate: 62.3% (62.9% nationwide)
- Unemployed population in California: 927,302
2018
- Avg. unemployment rate: 4.3% (3.9% nationwide)
- Labor force participation rate: 62.3% (62.9% nationwide)
- Unemployed population in California: 819,595
2019
- Avg. unemployment rate: 4.0% (3.7% nationwide)
- Labor force participation rate: 62.5% (63.1% nationwide)
- Unemployed population in California: 795,311
2020
- Avg. unemployment rate: 10.1% (8.1% nationwide)
- Labor force participation rate: 60.8% (61.7% nationwide)
- Unemployed population in California: 1,923,991
2021
- Avg. unemployment rate: 7.3% (5.3% nationwide)
- Labor force participation rate: 61.0% (61.7% nationwide)
- Unemployed population in California: 1,387,063
2022
- Avg. unemployment rate: 4.2% (3.6% nationwide)
- Labor force participation rate: 61.9% (62.2% nationwide)
- Unemployed population in California: 811,079
| Year | California unemployment rate | U.S. unemployment rate | Unemployed population in California |
|---|---|---|---|
| 1976 | 9.1 | 7.7 | 908,635 |
| 1977 | 8.3 | 7.1 | 868,374 |
| 1978 | 7.2 | 6.1 | 778,834 |
| 1979 | 6.2 | 5.8 | 701,996 |
| 1980 | 6.8 | 7.1 | 798,795 |
| 1981 | 7.4 | 7.6 | 879,116 |
| 1982 | 10.0 | 9.7 | 1,223,926 |
| 1983 | 9.8 | 9.6 | 1,207,942 |
| 1984 | 7.8 | 7.5 | 977,154 |
| 1985 | 7.2 | 7.2 | 933,949 |
| 1986 | 6.7 | 7.0 | 900,489 |
| 1987 | 5.8 | 6.2 | 801,291 |
| 1988 | 5.3 | 5.5 | 745,913 |
| 1989 | 5.1 | 5.3 | 739,894 |
| 1990 | 5.8 | 5.6 | 873,843 |
| 1991 | 7.7 | 6.8 | 1,180,805 |
| 1992 | 9.3 | 7.5 | 1,432,475 |
| 1993 | 9.5 | 6.9 | 1,453,169 |
| 1994 | 8.6 | 6.1 | 1,322,849 |
| 1995 | 7.9 | 5.6 | 1,204,269 |
| 1996 | 7.3 | 5.4 | 1,131,644 |
| 1997 | 6.4 | 4.9 | 1,011,078 |
| 1998 | 5.9 | 4.5 | 960,743 |
| 1999 | 5.2 | 4.2 | 867,316 |
| 2000 | 4.9 | 4.0 | 825,917 |
| 2001 | 5.4 | 4.7 | 935,919 |
| 2002 | 6.7 | 5.8 | 1,165,056 |
| 2003 | 6.8 | 6.0 | 1,190,384 |
| 2004 | 6.2 | 5.5 | 1,080,951 |
| 2005 | 5.4 | 5.1 | 944,309 |
| 2006 | 4.9 | 4.6 | 863,334 |
| 2007 | 5.4 | 4.6 | 955,326 |
| 2008 | 7.3 | 5.8 | 1,323,825 |
| 2009 | 11.2 | 9.3 | 2,112,831 |
| 2010 | 12.2 | 9.6 | 2,292,082 |
| 2011 | 11.7 | 8.9 | 2,186,154 |
| 2012 | 10.4 | 8.1 | 1,943,842 |
| 2013 | 8.9 | 7.4 | 1,677,544 |
| 2014 | 7.5 | 6.2 | 1,412,174 |
| 2015 | 6.2 | 5.3 | 1,176,732 |
| 2016 | 5.5 | 4.9 | 1,046,610 |
| 2017 | 4.8 | 4.4 | 927,302 |
| 2018 | 4.3 | 3.9 | 819,595 |
| 2019 | 4.0 | 3.7 | 795,311 |
| 2020 | 10.1 | 8.1 | 1,923,991 |
| 2021 | 7.3 | 5.3 | 1,387,063 |
| 2022 | 4.2 | 3.6 | 811,079 |