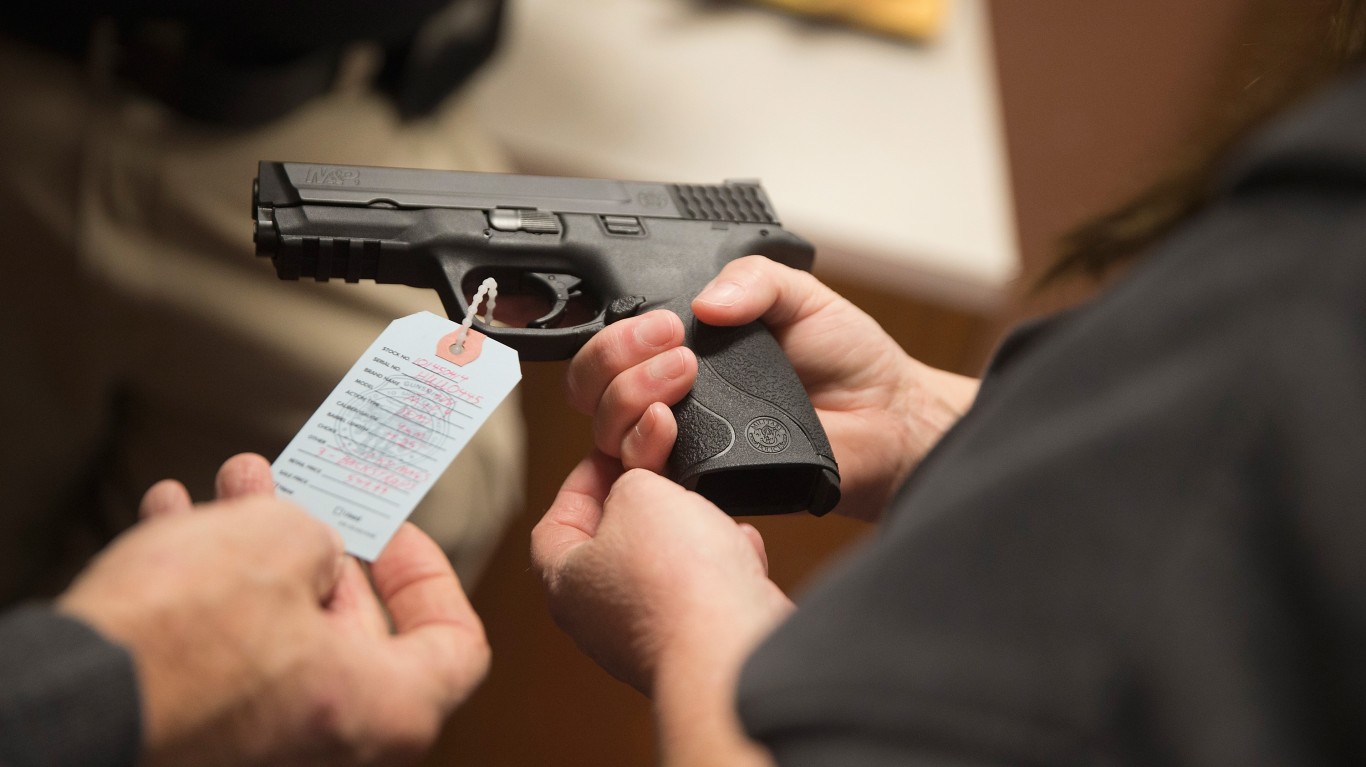
Following a surge in gun sales amid the pandemic, the level of firearm ownership in the U.S. has reached its highest point in years. A Gallup poll conducted in October of 2022 reported that 45% of American households owned at least one firearm, representing the highest recorded rate of household-level gun ownership since December of 1993.
Although the majority of gun owners do not intend to participate in criminal activities, the widspread presence of firearms in American households does raise the risk of guns ending up in the wrong hands, especially through theft. Every year, thousands of guns in the U.S. are stolen from homes and vehicles. Firearms that have been stolen are frequently sold on the black market, with a portion of them ultimately used in criminal activities.
24/7 Wall St. used data from the ATF’s report National Firearms Commerce and Trafficking Assessment (NFCTA): Crime Guns – Volume Two, to identify the states with the highest firearm theft rates. States are categorized according to the average annual number of guns stolen from private citizens per 100,000 people within the state between 2017 and 2021, excluding thefts from gun stores and manufacturers.
From 2017 to 2021, the Bureau of Alcohol, Tobacco, Firearms, and Explosives also reported that more than 1 million firearms in the U.S. were stolen. Significant variations in firearm theft rates among regions in the United States are common. During the period from 2017 to 2021, Southern states were responsible for more than 60% of firearm thefts, with states in the Northeast accounting for less than 5%.
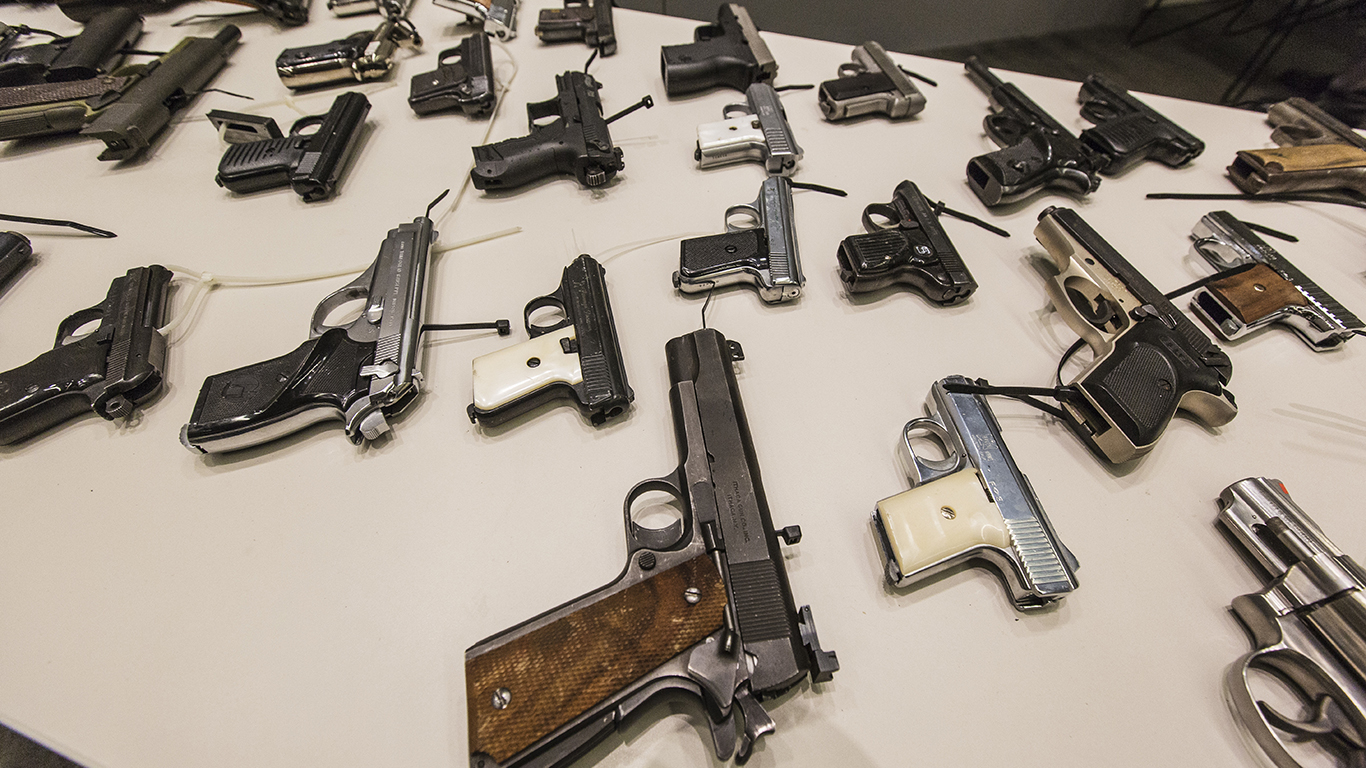
The top five firearm calibers with the highest likelihood of being stolen – .45, .22, .380, .40, and 9mm – are popular choices among semi-automatic handguns. Over the last five years, these types of firearms have constituted over 70% of all recorded firearm thefts in the U.S.
Here are the states where the most guns are stolen:
50. Massachusetts

- Avg. number of guns stolen from private citizens annually: 5.4 per 100,000 people (378 total per year)
- Est. total number of guns stolen from private citizens, 2017-2021: 1,890 (7th fewest of 50 states)
- Stolen guns recovered in state, 2017-2021: 416 (approx. 22.0% of total – 10th smallest share of 50 states)
- Population: 6,991,852
49. New Jersey

- Avg. number of guns stolen from private citizens annually: 6.8 per 100,000 people (629 total per year)
- Est. total number of guns stolen from private citizens, 2017-2021: 3,145 (11th fewest of 50 states)
- Stolen guns recovered in state, 2017-2021: 795 (approx. 25.3% of total – 18th smallest share of 50 states)
- Population: 9,234,024
48. New York

- Avg. number of guns stolen from private citizens annually: 8.9 per 100,000 people (1,766 total per year)
- Est. total number of guns stolen from private citizens, 2017-2021: 8,830 (23rd fewest of 50 states)
- Stolen guns recovered in state, 2017-2021: 1,287 (approx. 14.6% of total – 4th smallest share of 50 states)
- Population: 20,114,745
47. Rhode Island

- Avg. number of guns stolen from private citizens annually: 10.7 per 100,000 people (117 total per year)
- Est. total number of guns stolen from private citizens, 2017-2021: 585 (the fewest of 50 states)
- Stolen guns recovered in state, 2017-2021: 125 (approx. 21.4% of total – 9th smallest share of 50 states)
- Population: 1,091,949
46. Hawaii

- Avg. number of guns stolen from private citizens annually: 12.1 per 100,000 people (174 total per year)
- Est. total number of guns stolen from private citizens, 2017-2021: 870 (2nd fewest of 50 states)
- Stolen guns recovered in state, 2017-2021: 118 (approx. 13.6% of total – 2nd smallest share of 50 states)
- Population: 1,453,498
45. Maryland

- Avg. number of guns stolen from private citizens annually: 18.3 per 100,000 people (1,130 total per year)
- Est. total number of guns stolen from private citizens, 2017-2021: 5,650 (17th fewest of 50 states)
- Stolen guns recovered in state, 2017-2021: 1,287 (approx. 22.8% of total – 11th smallest share of 50 states)
- Population: 6,148,545
44. Wisconsin

- Avg. number of guns stolen from private citizens annually: 21.3 per 100,000 people (1,255 total per year)
- Est. total number of guns stolen from private citizens, 2017-2021: 6,275 (19th fewest of 50 states)
- Stolen guns recovered in state, 2017-2021: 05 (approx. 0.1% of total – the smallest share of 50 states)
- Population: 5,871,661
43. California

- Avg. number of guns stolen from private citizens annually: 21.7 per 100,000 people (8,509 total per year)
- Est. total number of guns stolen from private citizens, 2017-2021: 42,545 (5th most of 50 states)
- Stolen guns recovered in state, 2017-2021: 6,274 (approx. 14.7% of total – 5th smallest share of 50 states)
- Population: 39,455,353
42. Connecticut

- Avg. number of guns stolen from private citizens annually: 24.0 per 100,000 people (866 total per year)
- Est. total number of guns stolen from private citizens, 2017-2021: 4,330 (13th fewest of 50 states)
- Stolen guns recovered in state, 2017-2021: 816 (approx. 18.8% of total – 6th smallest share of 50 states)
- Population: 3,605,330
41. New Hampshire

- Avg. number of guns stolen from private citizens annually: 26.8 per 100,000 people (372 total per year)
- Est. total number of guns stolen from private citizens, 2017-2021: 1,860 (5th fewest of 50 states)
- Stolen guns recovered in state, 2017-2021: 538 (approx. 28.9% of total – 15th largest share of 50 states)
- Population: 1,372,175
40. Minnesota

- Avg. number of guns stolen from private citizens annually: 27.3 per 100,000 people (1,559 total per year)
- Est. total number of guns stolen from private citizens, 2017-2021: 7,795 (21st fewest of 50 states)
- Stolen guns recovered in state, 2017-2021: 2,275 (approx. 29.2% of total – 12th largest share of 50 states)
- Population: 5,670,472
39. Illinois

- Avg. number of guns stolen from private citizens annually: 33.7 per 100,000 people (4,265 total per year)
- Est. total number of guns stolen from private citizens, 2017-2021: 21,325 (20th most of 50 states)
- Stolen guns recovered in state, 2017-2021: 6,401 (approx. 30.0% of total – 9th largest share of 50 states)
- Population: 12,821,813
38. Nebraska

- Avg. number of guns stolen from private citizens annually: 37.3 per 100,000 people (733 total per year)
- Est. total number of guns stolen from private citizens, 2017-2021: 3,665 (12th fewest of 50 states)
- Stolen guns recovered in state, 2017-2021: 1,310 (approx. 35.7% of total – 3rd largest share of 50 states)
- Population: 1,951,480
37. Delaware

- Avg. number of guns stolen from private citizens annually: 37.8 per 100,000 people (379 total per year)
- Est. total number of guns stolen from private citizens, 2017-2021: 1,895 (8th fewest of 50 states)
- Stolen guns recovered in state, 2017-2021: 455 (approx. 24.0% of total – 13th smallest share of 50 states)
- Population: 981,892
36. Vermont

- Avg. number of guns stolen from private citizens annually: 39.1 per 100,000 people (253 total per year)
- Est. total number of guns stolen from private citizens, 2017-2021: 1,265 (3rd fewest of 50 states)
- Stolen guns recovered in state, 2017-2021: 244 (approx. 19.3% of total – 7th smallest share of 50 states)
- Population: 641,637
35. Iowa

- Avg. number of guns stolen from private citizens annually: 39.1 per 100,000 people (1,249 total per year)
- Est. total number of guns stolen from private citizens, 2017-2021: 6,245 (18th fewest of 50 states)
- Stolen guns recovered in state, 2017-2021: 1,706 (approx. 27.3% of total – 20th largest share of 50 states)
- Population: 3,179,090
34. Maine

- Avg. number of guns stolen from private citizens annually: 40.8 per 100,000 people (559 total per year)
- Est. total number of guns stolen from private citizens, 2017-2021: 2,795 (10th fewest of 50 states)
- Stolen guns recovered in state, 2017-2021: 386 (approx. 13.8% of total – 3rd smallest share of 50 states)
- Population: 1,357,046
33. Utah

- Avg. number of guns stolen from private citizens annually: 42.1 per 100,000 people (1,406 total per year)
- Est. total number of guns stolen from private citizens, 2017-2021: 7,030 (20th fewest of 50 states)
- Stolen guns recovered in state, 2017-2021: 2,355 (approx. 33.5% of total – 4th largest share of 50 states)
- Population: 3,231,370
32. Pennsylvania

- Avg. number of guns stolen from private citizens annually: 45.3 per 100,000 people (5,870 total per year)
- Est. total number of guns stolen from private citizens, 2017-2021: 29,350 (13th most of 50 states)
- Stolen guns recovered in state, 2017-2021: 7,886 (approx. 26.9% of total – 24th largest share of 50 states)
- Population: 12,970,650
31. North Dakota
- Avg. number of guns stolen from private citizens annually: 45.8 per 100,000 people (355 total per year)
- Est. total number of guns stolen from private citizens, 2017-2021: 1,775 (4th fewest of 50 states)
- Stolen guns recovered in state, 2017-2021: 476 (approx. 26.8% of total – 25th smallest share of 50 states)
- Population: 773,344
30. Washington

- Avg. number of guns stolen from private citizens annually: 52.6 per 100,000 people (4,074 total per year)
- Est. total number of guns stolen from private citizens, 2017-2021: 20,370 (21st most of 50 states)
- Stolen guns recovered in state, 2017-2021: 5,921 (approx. 29.1% of total – 13th largest share of 50 states)
- Population: 7,617,364
29. South Dakota

- Avg. number of guns stolen from private citizens annually: 53.2 per 100,000 people (476 total per year)
- Est. total number of guns stolen from private citizens, 2017-2021: 2,380 (9th fewest of 50 states)
- Stolen guns recovered in state, 2017-2021: 739 (approx. 31.1% of total – 6th largest share of 50 states)
- Population: 881,785
28. Idaho

- Avg. number of guns stolen from private citizens annually: 53.6 per 100,000 people (1,018 total per year)
- Est. total number of guns stolen from private citizens, 2017-2021: 5,090 (16th fewest of 50 states)
- Stolen guns recovered in state, 2017-2021: 1,427 (approx. 28.0% of total – 18th largest share of 50 states)
- Population: 1,811,617
27. Ohio

- Avg. number of guns stolen from private citizens annually: 56.8 per 100,000 people (6,697 total per year)
- Est. total number of guns stolen from private citizens, 2017-2021: 33,485 (11th most of 50 states)
- Stolen guns recovered in state, 2017-2021: 8,700 (approx. 26.0% of total – 20th smallest share of 50 states)
- Population: 11,769,923
26. Oregon

- Avg. number of guns stolen from private citizens annually: 57.1 per 100,000 people (2,423 total per year)
- Est. total number of guns stolen from private citizens, 2017-2021: 12,115 (25th most of 50 states)
- Stolen guns recovered in state, 2017-2021: 3,249 (approx. 26.8% of total – 25th largest share of 50 states)
- Population: 4,207,177
25. Colorado

- Avg. number of guns stolen from private citizens annually: 57.4 per 100,000 people (3,336 total per year)
- Est. total number of guns stolen from private citizens, 2017-2021: 16,680 (23rd most of 50 states)
- Stolen guns recovered in state, 2017-2021: 4,075 (approx. 24.4% of total – 15th smallest share of 50 states)
- Population: 5,723,176
24. Virginia

- Avg. number of guns stolen from private citizens annually: 60.4 per 100,000 people (5,224 total per year)
- Est. total number of guns stolen from private citizens, 2017-2021: 26,120 (16th most of 50 states)
- Stolen guns recovered in state, 2017-2021: 6,914 (approx. 26.5% of total – 24th smallest share of 50 states)
- Population: 8,582,479
23. Florida

- Avg. number of guns stolen from private citizens annually: 64.0 per 100,000 people (13,940 total per year)
- Est. total number of guns stolen from private citizens, 2017-2021: 69,700 (3rd most of 50 states)
- Stolen guns recovered in state, 2017-2021: 20,460 (approx. 29.4% of total – 11th largest share of 50 states)
- Population: 21,339,762
22. Michigan

- Avg. number of guns stolen from private citizens annually: 64.3 per 100,000 people (6,462 total per year)
- Est. total number of guns stolen from private citizens, 2017-2021: 32,310 (12th most of 50 states)
- Stolen guns recovered in state, 2017-2021: 8,546 (approx. 26.5% of total – 23rd smallest share of 50 states)
- Population: 10,062,512
21. Wyoming

- Avg. number of guns stolen from private citizens annually: 64.7 per 100,000 people (374 total per year)
- Est. total number of guns stolen from private citizens, 2017-2021: 1,870 (6th fewest of 50 states)
- Stolen guns recovered in state, 2017-2021: 551 (approx. 29.5% of total – 10th largest share of 50 states)
- Population: 576,641
20. Arizona

- Avg. number of guns stolen from private citizens annually: 70.0 per 100,000 people (5,090 total per year)
- Est. total number of guns stolen from private citizens, 2017-2021: 25,450 (17th most of 50 states)
- Stolen guns recovered in state, 2017-2021: 7,101 (approx. 27.9% of total – 19th largest share of 50 states)
- Population: 7,079,203
19. Kansas

- Avg. number of guns stolen from private citizens annually: 76.0 per 100,000 people (2,230 total per year)
- Est. total number of guns stolen from private citizens, 2017-2021: 11,150 (24th fewest of 50 states)
- Stolen guns recovered in state, 2017-2021: 2,876 (approx. 25.8% of total – 19th smallest share of 50 states)
- Population: 2,932,099
18. Indiana

- Avg. number of guns stolen from private citizens annually: 77.3 per 100,000 people (5,260 total per year)
- Est. total number of guns stolen from private citizens, 2017-2021: 26,300 (15th most of 50 states)
- Stolen guns recovered in state, 2017-2021: 6,906 (approx. 26.3% of total – 22nd smallest share of 50 states)
- Population: 6,751,340
17. Nevada

- Avg. number of guns stolen from private citizens annually: 83.1 per 100,000 people (2,614 total per year)
- Est. total number of guns stolen from private citizens, 2017-2021: 13,070 (24th most of 50 states)
- Stolen guns recovered in state, 2017-2021: 3,223 (approx. 24.7% of total – 17th smallest share of 50 states)
- Population: 3,059,238
16. Texas

- Avg. number of guns stolen from private citizens annually: 85.6 per 100,000 people (25,270 total per year)
- Est. total number of guns stolen from private citizens, 2017-2021: 126,350 (the most of 50 states)
- Stolen guns recovered in state, 2017-2021: 31,098 (approx. 24.6% of total – 16th smallest share of 50 states)
- Population: 28,862,581
15. Montana
- Avg. number of guns stolen from private citizens annually: 88.7 per 100,000 people (980 total per year)
- Est. total number of guns stolen from private citizens, 2017-2021: 4,900 (15th fewest of 50 states)
- Stolen guns recovered in state, 2017-2021: 1,484 (approx. 30.3% of total – 8th largest share of 50 states)
- Population: 1,077,978
14. West Virginia

- Avg. number of guns stolen from private citizens annually: 97.0 per 100,000 people (1,730 total per year)
- Est. total number of guns stolen from private citizens, 2017-2021: 8,650 (22nd fewest of 50 states)
- Stolen guns recovered in state, 2017-2021: 1,703 (approx. 19.7% of total – 8th smallest share of 50 states)
- Population: 1,801,049
13. North Carolina

- Avg. number of guns stolen from private citizens annually: 103.9 per 100,000 people (10,961 total per year)
- Est. total number of guns stolen from private citizens, 2017-2021: 54,805 (4th most of 50 states)
- Stolen guns recovered in state, 2017-2021: 15,859 (approx. 28.9% of total – 14th largest share of 50 states)
- Population: 10,367,022
12. Kentucky

- Avg. number of guns stolen from private citizens annually: 103.9 per 100,000 people (4,684 total per year)
- Est. total number of guns stolen from private citizens, 2017-2021: 23,420 (18th most of 50 states)
- Stolen guns recovered in state, 2017-2021: 8,537 (approx. 36.5% of total – the largest share of 50 states)
- Population: 4,494,141
11. New Mexico
- Avg. number of guns stolen from private citizens annually: 106.8 per 100,000 people (2,260 total per year)
- Est. total number of guns stolen from private citizens, 2017-2021: 11,300 (25th fewest of 50 states)
- Stolen guns recovered in state, 2017-2021: 2,689 (approx. 23.8% of total – 12th smallest share of 50 states)
- Population: 2,109,366
10. Oklahoma

- Avg. number of guns stolen from private citizens annually: 111.0 per 100,000 people (4,426 total per year)
- Est. total number of guns stolen from private citizens, 2017-2021: 22,130 (19th most of 50 states)
- Stolen guns recovered in state, 2017-2021: 5,984 (approx. 27.0% of total – 23rd largest share of 50 states)
- Population: 3,948,136
9. Tennessee

- Avg. number of guns stolen from private citizens annually: 116.7 per 100,000 people (8,143 total per year)
- Est. total number of guns stolen from private citizens, 2017-2021: 40,715 (7th most of 50 states)
- Stolen guns recovered in state, 2017-2021: 11,113 (approx. 27.3% of total – 21st largest share of 50 states)
- Population: 6,859,497
8. Missouri

- Avg. number of guns stolen from private citizens annually: 117.9 per 100,000 people (7,270 total per year)
- Est. total number of guns stolen from private citizens, 2017-2021: 36,350 (9th most of 50 states)
- Stolen guns recovered in state, 2017-2021: 10,287 (approx. 28.3% of total – 17th largest share of 50 states)
- Population: 6,141,534
7. Alaska

- Avg. number of guns stolen from private citizens annually: 130.0 per 100,000 people (953 total per year)
- Est. total number of guns stolen from private citizens, 2017-2021: 4,765 (14th fewest of 50 states)
- Stolen guns recovered in state, 2017-2021: 1,725 (approx. 36.2% of total – 2nd largest share of 50 states)
- Population: 735,951
6. Arkansas

- Avg. number of guns stolen from private citizens annually: 131.8 per 100,000 people (3,989 total per year)
- Est. total number of guns stolen from private citizens, 2017-2021: 19,945 (22nd most of 50 states)
- Stolen guns recovered in state, 2017-2021: 6,572 (approx. 33.0% of total – 5th largest share of 50 states)
- Population: 3,006,309
5. Georgia

- Avg. number of guns stolen from private citizens annually: 132.3 per 100,000 people (14,288 total per year)
- Est. total number of guns stolen from private citizens, 2017-2021: 71,440 (2nd most of 50 states)
- Stolen guns recovered in state, 2017-2021: 18,708 (approx. 26.2% of total – 21st smallest share of 50 states)
- Population: 10,625,615
4. South Carolina

- Avg. number of guns stolen from private citizens annually: 150.8 per 100,000 people (7,825 total per year)
- Est. total number of guns stolen from private citizens, 2017-2021: 39,125 (8th most of 50 states)
- Stolen guns recovered in state, 2017-2021: 10,666 (approx. 27.3% of total – 22nd largest share of 50 states)
- Population: 5,078,903
3. Louisiana

- Avg. number of guns stolen from private citizens annually: 155.1 per 100,000 people (7,170 total per year)
- Est. total number of guns stolen from private citizens, 2017-2021: 35,850 (10th most of 50 states)
- Stolen guns recovered in state, 2017-2021: 10,919 (approx. 30.5% of total – 7th largest share of 50 states)
- Population: 4,657,305
2. Alabama

- Avg. number of guns stolen from private citizens annually: 165.7 per 100,000 people (8,353 total per year)
- Est. total number of guns stolen from private citizens, 2017-2021: 41,765 (6th most of 50 states)
- Stolen guns recovered in state, 2017-2021: 11,851 (approx. 28.4% of total – 16th largest share of 50 states)
- Population: 4,997,675
1. Mississippi

- Avg. number of guns stolen from private citizens annually: 185.1 per 100,000 people (5,460 total per year)
- Est. total number of guns stolen from private citizens, 2017-2021: 27,300 (14th most of 50 states)
- Stolen guns recovered in state, 2017-2021: 6,647 (approx. 24.3% of total – 14th smallest share of 50 states)
- Population: 2,967,023