Supply, the other half of the supply-and-demand equation, remained essentially flat at 1,089.2 tonnes, down 4.1 tonnes year-over-year. Mining supply rose 1% to 734.2 tonnes, but recycled gold supply fell 3% to 355.1 tonnes.
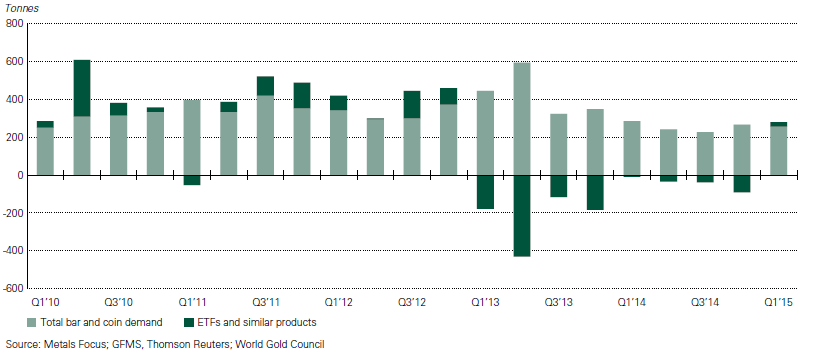
Among investors, demand fell 10% for bars and coins but rose to 25.7 tonnes for exchange traded funds (ETFs) and similar investment products. In the first quarter of 2014, demand from ETFs fell by 13.5 tonnes.
Central bank gold buying also remained essentially unchanged at 119.4 tonnes, compared with 119.8 tonnes in the year-ago quarter. Demand from the technology sector slipped 2% year-over-year to 80.4 tonnes, and jewelry demand slipped 3% from 620.2 tonnes to 600.8 tonnes.
The World Gold Council seemed satisfied:
Even in changeable conditions, the gold market remains well supported. [The] contrast between the global picture and the more granular demand data clearly demonstrates the multi-faceted nature of the gold market. The numerous and varying roles that gold plays means it responds to different cues in different ways, smoothing out the fluctuations occurring at a more localised level.
While it seems scarcely believable that demand from ETFs has been negative for eight consecutive quarters, the council’s chart that appears below tells the tale. Positive inflows were mainly directed toward U.S.-listed ETFs, but both Germany and the United Kingdom saw positive action as well. According to the World Gold Council, a third of investors in U.S.-listed ETFs have held their positions for more than five years.
Central bank purchases did not reach the heights of fourth quarter 2014 buying, but they did extend the positive purchase streak to 17 quarters. The council said that many central banks that are exposed to a small number of key reserve currencies maintain gold as a hedge against volatile currency movements.
Concerning supply, the World Gold Council believes that full-year mining supply is likely to be roughly even with last year. The first-quarter increase and a likely second-quarter increase are expected to be offset by negative comparisons for the second half of the year.
Recycled supply is dwindling as more U.S. and European consumers hold on to their gold. “Improving economic conditions in the US and the much-reduced pool of near-market gold available for recycling in Europe kept the longer term downtrend in place,” according to the council.