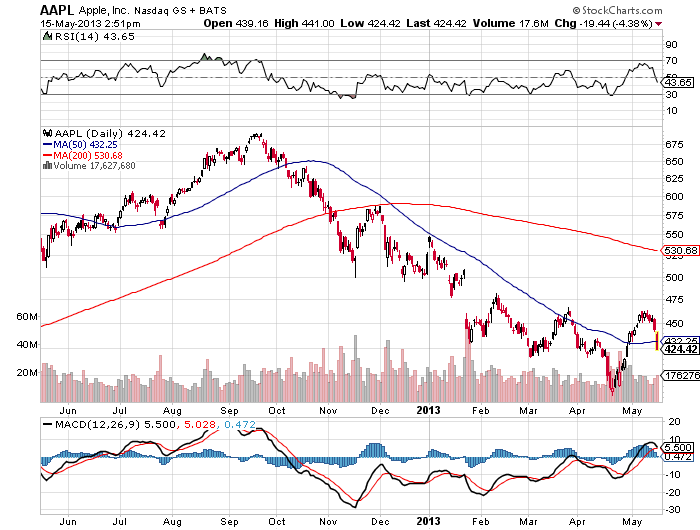
The price of Apple stock had handily recovered from under $400 up to back over $460 in only about two weeks. Then the stock started to lose its momentum, the last two trading days have been very rough for tim Cook and friends. If you will review the chart below from stockcharts.com you will see how important this 50-day moving average has been of late.
When Apple truly broke under the 50-day moving average last October, its rally was over and the stock fell from $650 down to $525 in just about six weeks. The the stock made 5 runs back toward the 50-day moving average and could not get above it until this last run up in the stock. Now the chart appears to be failing again.
Maybe Apple will use this as support, but the stock has burned so many investors in the last 8 months that trust is getting harder and harder to find.
Apple’s 50-day moving average is $432.25 and shares are down 4.4% at $424.80 so far on Wednesday. It’s 52-week trading range is $385.10 to $705.07.