[cnxvideo id=”655419″ placement=”ros”]The Mexican immigrant population of the United States in 2014 was about 11.7 million. Of that total, only 27% are naturalized U.S. citizens, about half the naturalization rate for the total U.S. foreign-born population.
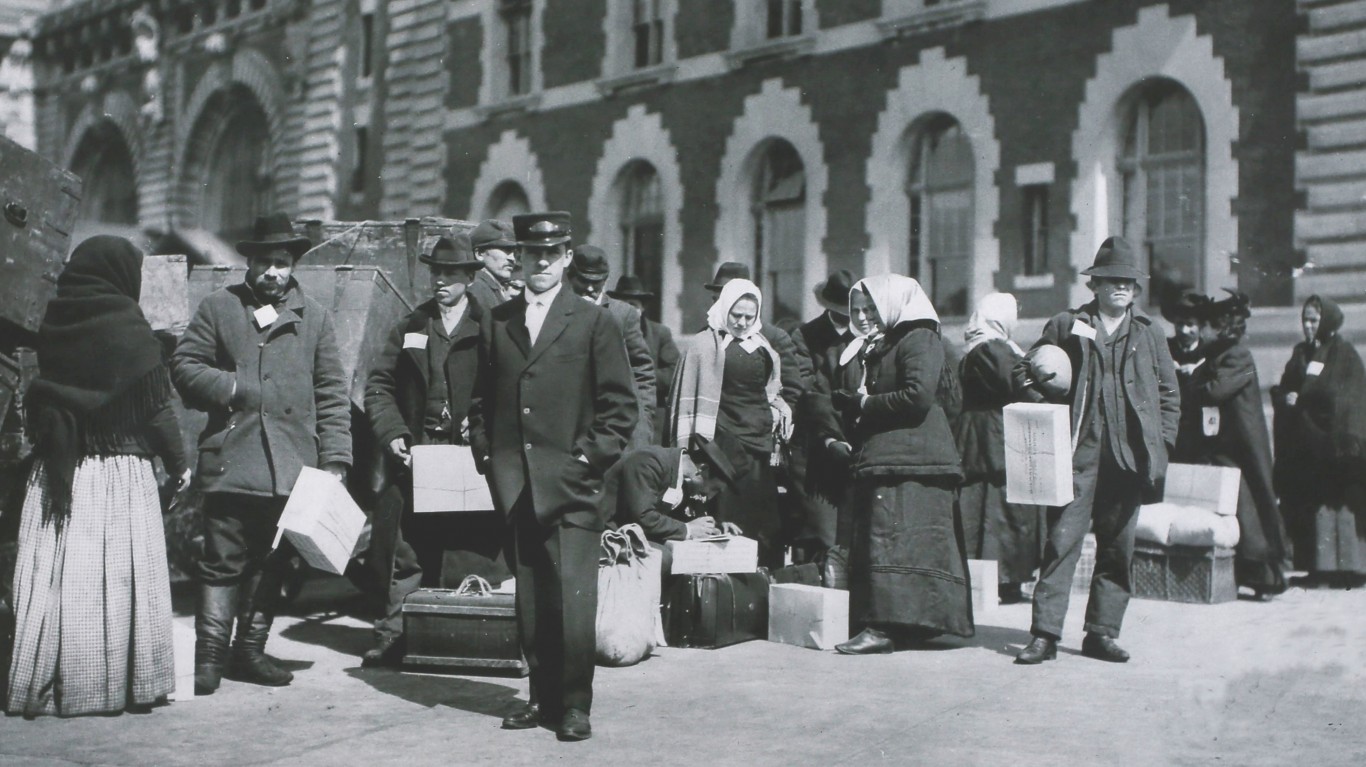
According to U.S. Census Bureau data published by the Migration Policy Institute (MPI), 63% of the Mexican immigrant population arrived in the United States before 2000, another 31% arrived between 2000 and 2009, and the remaining 6% arrived in 2010 or later.
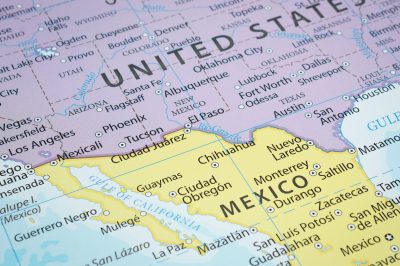
MPI reports a total unauthorized Mexican immigrant U.S. population of about 6.2 million in 2014. These are people that President Donald Trump’s wall is meant to keep out. More on that in a moment.
Just under half (48%) of the total Mexican immigrant population of the United States lives in 10 metropolitan areas. Four of the metro areas are located in California, three in Texas and one each in Illinois, Arizona and New York.
[nativounit]
The following list includes the metro area, its Mexican immigrant population and the percentage that the Mexican immigrant population represents of the metro area’s total population.
- Los Angeles-Long Beach-Santa Ana, California: 1.735 million; 13.3%
- Chicago-Joliet-Naperville, IL-IN-WI: 669,000; 7.0%
- Houston-Sugar Land-Baytown, Texas: 606,000; 9.8%
- Dallas-Ft. Worth-Arlington, Texas: 601,000; 9.0%
- Riverside-San Bernardino-Ontario, California: 562,000; 12.9%
- Phoenix-Mesa-Glendale, Arizona: 344,000; 7.9%
- San Diego-Carlsbad-San Marcos, California: 337,000; 10.6%
- New York-Northern New Jersey-Long Island, NY-NJ-PA: 332,000; 1.7%
- San Francisco-Oakland-Fremont, California: 250,000; 5.6%
- McAllen-Edinburg-Mission, Texas: 218,000; 27.1%
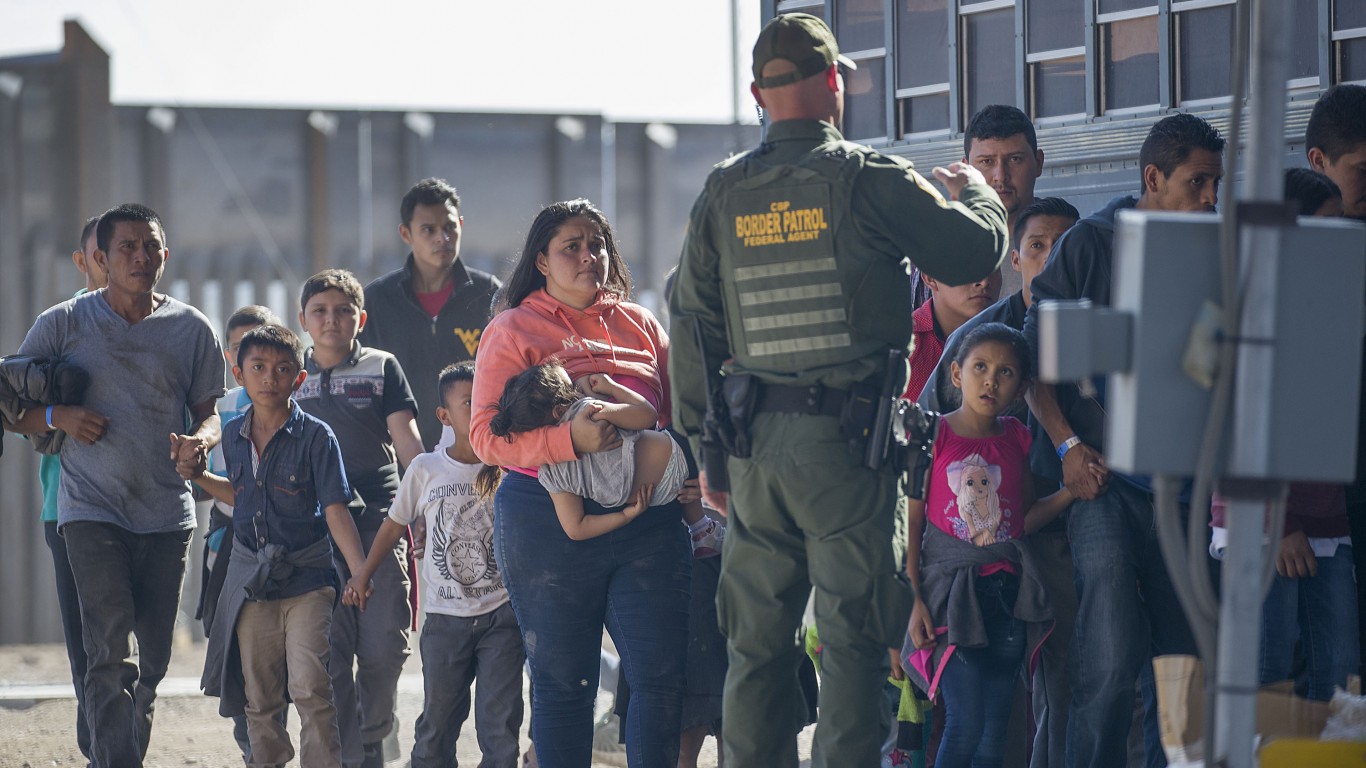
Now about that wall on the United States-Mexico border. Between 2006 and 2014, the total Mexican immigrant population in the United States rose from 11.54 million to 11.71 million. That’s less than 20,000 immigrants per year and that includes both legal and illegal immigration. Using 27% as the portion of legal immigrants, 73% — 124,100 — are illegal.
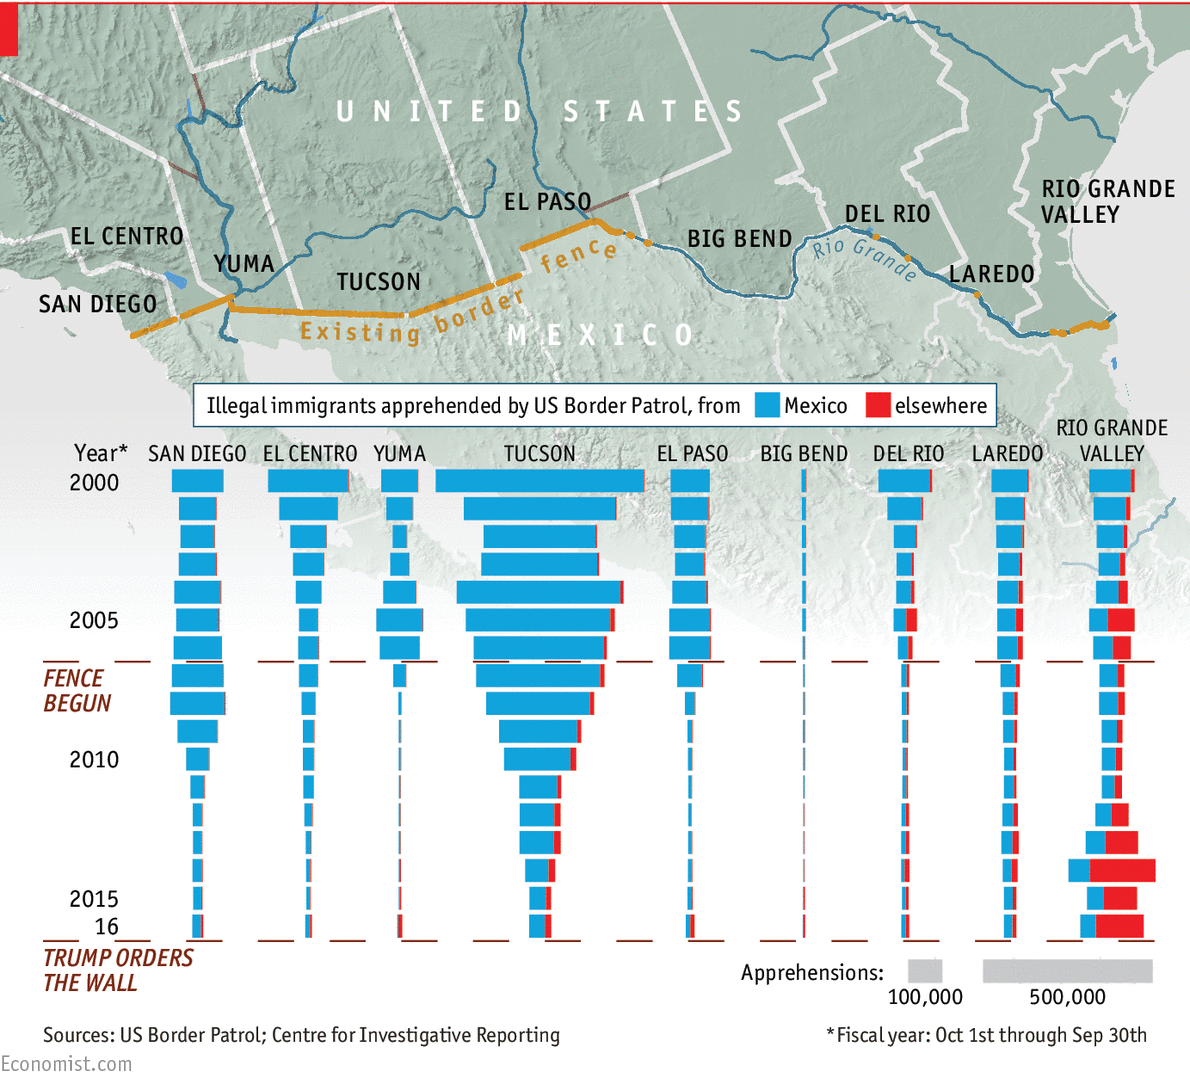
On Thursday the Economist published a graphic that shows the number of illegal immigrants apprehended by the U.S. Border Patrol along the U.S-Mexico border between 2000 and 2016. In 2000 the Border Patrol arrested more than 1.6 million along the border, of which 98% were Mexicans. In 2016 the number of arrests totaled 400,000, of which just 47% were made of Mexican citizens.
A wall that is expected to cost $15 billion to $25 billion (or more) to keep 524,100 illegal immigrants out of the United States for 10 years will cost between about $2,900 and $4,800 per person for the 10-year total of 5.24 million.
And that does not include President Trump’s proposal to boost the Border Patrol’s budget $13 billion by hiring an additional 5,000 workers. The wall and the increase in border agents is an expensive solution to a problem that is getting smaller on its own.
[wallst_email_signup]