Ever since Donald Trump’s presidency began, the United States government has been making a significant push towards removing undocumented immigrants from our borders. ICE raids have been happening across the country — in schools, homes, businesses, and communities. Some groups are fighting back; Alexandria Ocasio-Cortez, a U.S. Representative for New York’s 14th congressional district, was recently criticized by members of Trump’s team for providing a webinar teaching immigrants how to evade ICE. Other groups are cracking down even further; Florida Governor Ron DeSantis, for example, suggested a proposal to implement a mandatory death penalty for undocumented migrants convicted of capital crimes. Regardless of which side you’re on, you probably haven’t been able to escape the pervasive and near-constant discussions of immigration recently. (What would happen if America had open borders with Mexico?)
Even at the state level, several officials have pushed for legislation regarding deportation. For example, Texas has passed a handful of legislative measures aimed at immigrants. Senate Bill 4 made it legal for local officials to arrest any individual for simply being suspected of an illegal border crossing. The state also engaged in a program that offers self-deportation options to immigrants willing to relocate themselves. Iowa also upped the ante on immigration through a series of executive actions. Senate File 2340 made it legal for state courts to issue removal orders to previously deported people. Louisiana also joined the immigration enforcement efforts; Governor Landry introduced an initiative motivating state law enforcement to participate in federal deportation efforts. State agencies were given the go-ahead to verify the legal status of any public service individual.
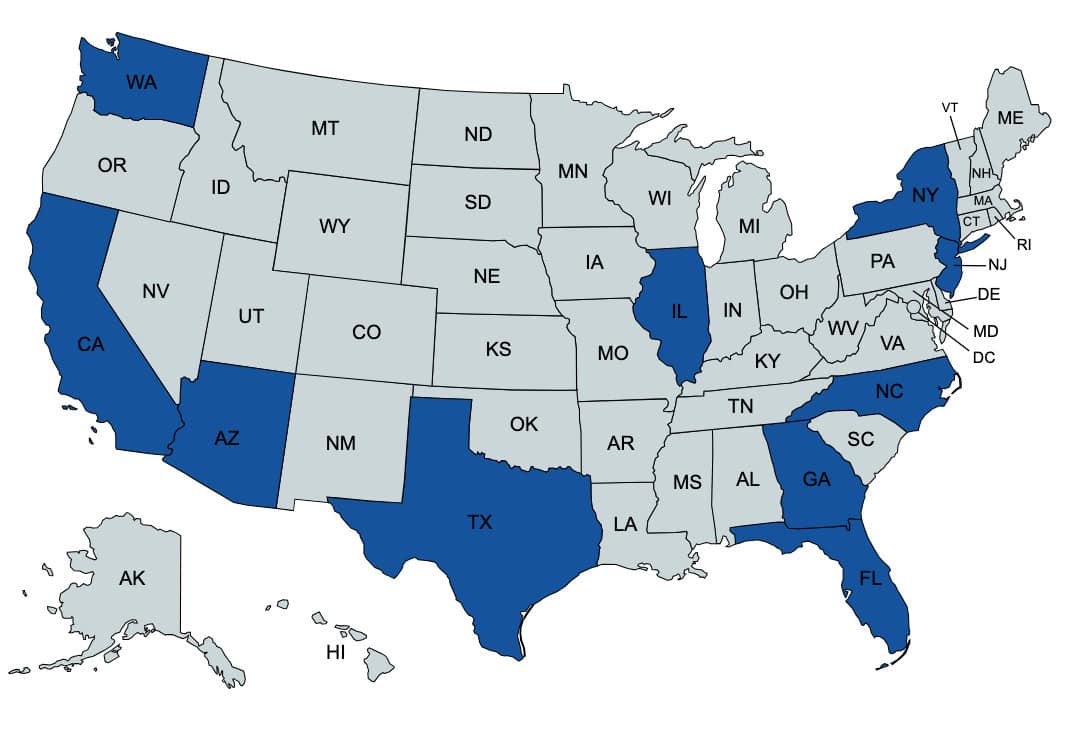
Despite intensified efforts towards deportation, immigrants often heavily contribute to their local areas. Many undocumented immigrants are not living below the poverty line, highlighting how they have found success in America. Here, 24/7 Wall St. set out to determine where the largest undocumented immigrant communities existed across the United States. We identified the 10 states with the largest estimated number of undocumented migrants, based on data from the Migration Policy Institute. Their site has a convenient clickable map with data on every state, so if yours is not listed here, you can find it there. Learning all of the facts regarding undocumented immigrants is key to having informed conversations and identifying solutions for the path forward.
This post was updated on May 28, 2025 to include state-level legislation regarding immigration and deportation.
Surprising Data from the Top 10
Some data points from the top 10 states with the most undocumented migrants may be surprising:
- These states account for about 8 million of the country’s estimated 11 million unauthorized immigrants, or about 73%.
- Although the majority come from Mexico and Central America, Asian countries are the other main source of undocumented immigrants, particularly from China, India, and the Philippines. These are more likely to arrive in airports than to cross the southern border.
- In most states about half of unauthorized migrants have lived in the country 15 or more years and speak English. After this period of time most have children who were born in the country and are American citizens.
- In most states only 20-30% of undocumented people live below the poverty line.
- Most do not work in agriculture, but in construction, professional positions, or the hospitality industry (food service, hotels, the sports and entertainment industry, recreation, etc.).
Occupations of Undocumented Immigrant Workers

Many undocumented immigrants arrive in the country on tourist or student visas and then remain in the country after their visa has expired. This means that at least some of them have sufficient resources to travel, language skills, and a college education, which allows them to figure out jobs that fairly compensate them for their skills. However, in other states, a majority of undocumented immigrants work in fields like construction, housekeeping, food service, janitorial services, or delivery.
Why This Matters

Most Americans have strong opinions about undocumented immigrants, but those opinions don’t always align with actual data. The numbers paint a different picture than you might see portrayed in media depictions. The places where undocumented immigrants actually live, and why they choose these locations, often comes down to access: to employment, to housing, and to existing community connections. States with a large undocumented presence also see economic impacts — some good, and some bad. For example, on the positive side, states with undocumented immigrants might see more small businesses. On the negative side, some areas may suffer from housing access. Either way, learning which states have the largest undocumented communities helps explain different economic and social trends.
The largest undocumented populations can be found in these 10 states:
10. Arizona

- Population: 290,000
- Top countries of origin: Mexico, Guatemala, India, Philippines, China
- U.S. residency: 41% have lived in the country for 15 or more years.
- Language proficiency: 55% speak English
- Industries of employment: Construction; professional/management/administration; hospitality
- Below the poverty line: 32%
- Above the poverty line: 68%
9. Washington

- Population: 246,000
- Top countries of origin: Mexico, India, Philippines, China, Guatemala
- U.S. residency: 20% have lived in the country for 2o or more years.
- Language proficiency: 60% speak English
- Industries of employment: Agriculture; hospitality; professional/management/administration
- Below the poverty line: 23%
- Above the poverty line: 77%
8. Georgia

- Population: 339,000
- Top countries of origin: Mexico, Guatemala, India, El Salvador, Honduras
- U.S. residency: 43% have lived in the country for 2o or more years.
- Language proficiency: 55% speak English
- Industries of employment: Construction; professional/management/administration; manufacturing
- Below the poverty line: 26%
- Above the poverty line: 73%
7. North Carolina

- Population: 296,000
- Top countries of origin: Mexico, Honduras, El Salvador, Guatemala, India
- U.S. residency: 46% have lived in the country for 2o or more years.
- Language proficiency: 54% speak English
- Industries of employment: Construction; hospitality; professional/management/administration
- Below the poverty line: 31%
- Above the poverty line: 69%
6. New York

- Population: 835,000
- Top countries of origin: Mexico, China, Dominican Republic, Ecuador, El Salvador
- U.S. residency: 38% have lived in the country for 2o or more years.
- Language proficiency: 55% speak English
- Industries of employment: Hospitality; construction; professional/management/administration; retail
- Below the poverty line: 24%
- Above the poverty line: 76%
5. Illinois

- Population: 425,000
- Top countries of origin: Mexico, India, Philippines, China, Guatemala
- U.S. residency: 53% have lived in the country for 2o or more years.
- Language proficiency: 58% speak English
- Industries of employment: Manufacturing; hospitality; professional/management/administration
- Below the poverty line: 22%
- Above the poverty line: 78%
4. New Jersey

- Population: 290,000
- Top countries of origin: Mexico, India, Guatemala, El Salvador, Dominican Republic
- U.S. residency: 35% have lived in the country for 2o or more years.
- Language proficiency: 55% speak English
- Industries of employment: Construction; professional/management/administration; hospitality
- Below the poverty line: 23%
- Above the poverty line: 67%
3. Florida

- Population: 772,000
- Top countries of origin: Mexico, Venezuela, Guatemala, Honduras, Colombia
- U.S. residency: 32% have lived in the country for 2o or more years.
- Language proficiency: 55% speak English
- Industries of employment: Construction; professional/management/administration; hospitality; retail
- Below the poverty line: 28%
- Above the poverty line: 72%
2. Texas

- Population: 1,739,000
- Top countries of origin: Mexico, El Salvador, Honduras, Guatemala, India
- U.S. residency: 45% have lived in the country for 2o or more years.
- Language proficiency: 47% speak English
- Industries of employment: Construction; hospitality; professional/management/administration; manufacturing
- Below the poverty line: 29%
- Above the poverty line: 71%
1. California

- Population: 2,739,000
- Top countries of origin: Mexico, El Salvador, Guatemala, Philippines, India
- U.S. residency: 53% have lived in the country for 2o or more years.
- Language proficiency: 51% speak English
- Industries of employment: Hospitality; construction; professional/management/administration; manufacturing
- Below the poverty line: 25%
- Above the poverty line: 75%