The United States is in the midst of a housing affordability crisis. Data from the Bureau of Labor Statistics shows that wages for a typical, full-time worker have climbed by just under 27% since the beginning of 2020. Over the same period, home prices rose more than twice as fast, increasing by over 55% according to the Case-Shiller index. In a congressional hearing earlier this year, the chairman of the National Association of Home Builders testified that nearly 77% of American households cannot afford a new, median priced home.
The surge in home prices is due in large part to a long-standing supply shortage, which now stands at an estimated minimum of 1.5 million housing units. With construction costs continuing to rise, overcoming the shortfall appears to be growing ever more difficult.
The mismatch between supply and demand in the housing market is also being exacerbated by historically high mortgage rates. According to the Federal Home Loan Mortgage Corporation, or Freddie Mac, the average interest on a 30-year fixed rate mortgage has been above 6% since September 2022 — levels not seen since 2008. Today’s borrowing costs are more than double what they were as recently as 2021, and many homeowners locked into lower rates are now hesitant to sell.
Due to these underlying factors, the median list price of a home in the United States is now $425,000, which is 5.2 times higher than the national median household income of $81,604. For context, the median list price in the U.S. was only 3.5 times higher than the median household income as recently as a decade ago. Notably, both real estate prices and income levels vary considerably across the country, and in most states, there are housing markets that remain relatively affordable.
Using data from the U.S. Census Bureau and Realtor.com, 24/7 Wall St. identified the most affordable housing market in each state. We reviewed incomes and list prices for the more than 860 U.S. counties and county equivalents with available data and ranked them on their affordability ratio — or the local median household income divided by the local median home list price. Income data are one-year estimates from the Census Bureau’s 2024 American Community Survey. Median list price data are from Realtor.com and are current as of September 2025. It is important to note that Vermont has only one county with available data. As a result, the listed county ranks as the most affordable by default.
Among the 50 counties and county equivalents on this list, home prices range from 1.8 to 6.5 times higher than the median household income, and in 42 of these counties, homeownership is more affordable than the national average. However, because 2024 income data is not yet available for every U.S. county, there are two states on this list where the highest-ranking county has a less affordable housing market than the state as a whole.
In many of these places, affordable housing is likely due in part to the types of homes being put up for sale. Within any given market, larger homes often command higher prices, and in most counties on this list, the typical listed home is smaller than the typical listed home across the state as a whole.
These are the most affordable housing markets in every state.
Why It Matters

Supply constraints and rising demand have given way to a housing affordability crisis in the United States. Even without considering historically high mortgage rates, the typical American home has a median list price that is over five times what the typical household earns in a year. Notably, however, some parts of the country appear to have been largely spared from the housing crisis. In these places, home prices remain more closely connected to incomes than is common in much of the rest of the country.
Alabama: Jefferson County

- Local list price to income ratio: 3.5-to-1 (statewide: 4.9-to-1)
- Local list price of a typical home: $245,000 (statewide: $329,950 )
- Local median household income: $69,363 (statewide: $66,659 )
- Typical size of a listed home: 1,670 sq. ft. (statewide: 1,937 sq. ft.)
- 1-yr. change in local median list price: -3.5% (statewide: +0.3%)
- Total number of listed homes in September 2025: 3,708 (13.0% of listed homes in state)
- No. of counties considered in state: 21
Alaska: Fairbanks North Star Borough

- Local list price to income ratio: 3.6-to-1 (statewide: 4.7-to-1)
- Local list price of a typical home: $334,975 (statewide: $445,000 )
- Local median household income: $92,121 (statewide: $95,665 )
- Typical size of a listed home: 1,635 sq. ft. (statewide: 1,769 sq. ft.)
- 1-yr. change in local median list price: +4.0% (statewide: +4.7%)
- Total number of listed homes in September 2025: 440 (13.8% of listed homes in state)
- No. of counties considered in state: 3
Arizona: Pinal County

- Local list price to income ratio: 4.8-to-1 (statewide: 5.8-to-1)
- Local list price of a typical home: $394,995 (statewide: $476,625 )
- Local median household income: $81,668 (statewide: $81,486 )
- Typical size of a listed home: 1,896 sq. ft. (statewide: 1,893 sq. ft.)
- 1-yr. change in local median list price: -1.3% (statewide: -4.0%)
- Total number of listed homes in September 2025: 3,647 (9.8% of listed homes in state)
- No. of counties considered in state: 10
Arkansas: Jefferson County

- Local list price to income ratio: 2.6-to-1 (statewide: 4.9-to-1)
- Local list price of a typical home: $132,475 (statewide: $304,950 )
- Local median household income: $50,593 (statewide: $62,106 )
- Typical size of a listed home: 1,636 sq. ft. (statewide: 1,867 sq. ft.)
- 1-yr. change in local median list price: -5.5% (statewide: +2.0%)
- Total number of listed homes in September 2025: 276 (1.6% of listed homes in state)
- No. of counties considered in state: 11
California: Kings County
- Local list price to income ratio: 5.1-to-1 (statewide: 7.5-to-1)
- Local list price of a typical home: $374,900 (statewide: $748,500 )
- Local median household income: $73,954 (statewide: $100,149 )
- Typical size of a listed home: 1,637 sq. ft. (statewide: 1,751 sq. ft.)
- 1-yr. change in local median list price: +3.1% (statewide: -2.5%)
- Total number of listed homes in September 2025: 329 (0.3% of listed homes in state)
- No. of counties considered in state: 42
Colorado: Arapahoe County

- Local list price to income ratio: 4.8-to-1 (statewide: 6.0-to-1)
- Local list price of a typical home: $499,700 (statewide: $587,000 )
- Local median household income: $103,914 (statewide: $97,113 )
- Typical size of a listed home: 2,040 sq. ft. (statewide: 2,080 sq. ft.)
- 1-yr. change in local median list price: -3.6% (statewide: -2.1%)
- Total number of listed homes in September 2025: 3,273 (8.1% of listed homes in state)
- No. of counties considered in state: 12
Connecticut: Capitol Planning Region

- Local list price to income ratio: 4.3-to-1 (statewide: 5.5-to-1)
- Local list price of a typical home: $404,900 (statewide: $525,225 )
- Local median household income: $93,478 (statewide: $96,049 )
- Typical size of a listed home: 1,807 sq. ft. (statewide: 1,949 sq. ft.)
- 1-yr. change in local median list price: +3.2% (statewide: +2.0%)
- Total number of listed homes in September 2025: 2,167 (21.1% of listed homes in state)
- No. of counties considered in state: 9
Delaware: New Castle County
- Local list price to income ratio: 4.6-to-1 (statewide: 5.5-to-1)
- Local list price of a typical home: $417,450 (statewide: $485,445 )
- Local median household income: $89,846 (statewide: $87,534 )
- Typical size of a listed home: 1,950 sq. ft. (statewide: 2,073 sq. ft.)
- 1-yr. change in local median list price: -0.0% (statewide: -0.6%)
- Total number of listed homes in September 2025: 1,524 (30.8% of listed homes in state)
- No. of counties considered in state: 3
Florida: Clay County
- Local list price to income ratio: 4.1-to-1 (statewide: 5.5-to-1)
- Local list price of a typical home: $369,000 (statewide: $425,000 )
- Local median household income: $90,702 (statewide: $77,735 )
- Typical size of a listed home: 1,896 sq. ft. (statewide: 1,623 sq. ft.)
- 1-yr. change in local median list price: -1.6% (statewide: -2.8%)
- Total number of listed homes in September 2025: 1,418 (0.7% of listed homes in state)
- No. of counties considered in state: 41
Georgia: Dougherty County
- Local list price to income ratio: 2.8-to-1 (statewide: 4.9-to-1)
- Local list price of a typical home: $142,142 (statewide: $394,995 )
- Local median household income: $51,508 (statewide: $79,991 )
- Typical size of a listed home: 1,552 sq. ft. (statewide: 2,100 sq. ft.)
- 1-yr. change in local median list price: +2.9% (statewide: +0.0%)
- Total number of listed homes in September 2025: 355 (0.6% of listed homes in state)
- No. of counties considered in state: 39
Hawaii: Honolulu County

- Local list price to income ratio: 6.2-to-1 (statewide: 7.4-to-1)
- Local list price of a typical home: $650,000 (statewide: $749,500 )
- Local median household income: $105,205 (statewide: $100,745 )
- Typical size of a listed home: 995 sq. ft. (statewide: 1,094 sq. ft.)
- 1-yr. change in local median list price: -8.8% (statewide: -6.3%)
- Total number of listed homes in September 2025: 4,429 (57.4% of listed homes in state)
- No. of counties considered in state: 4
Idaho: Bonneville County

- Local list price to income ratio: 5.4-to-1 (statewide: 7.2-to-1)
- Local list price of a typical home: $451,750 (statewide: $585,225 )
- Local median household income: $83,600 (statewide: $81,166 )
- Typical size of a listed home: 2,820 sq. ft. (statewide: 2,176 sq. ft.)
- 1-yr. change in local median list price: -2.2% (statewide: +2.2%)
- Total number of listed homes in September 2025: 685 (5.2% of listed homes in state)
- No. of counties considered in state: 6
Illinois: Vermilion County

- Local list price to income ratio: 2.0-to-1 (statewide: 3.8-to-1)
- Local list price of a typical home: $126,625 (statewide: $316,500 )
- Local median household income: $62,551 (statewide: $83,211 )
- Typical size of a listed home: 1,455 sq. ft. (statewide: 1,700 sq. ft.)
- 1-yr. change in local median list price: -1.8% (statewide: -2.6%)
- Total number of listed homes in September 2025: 156 (0.4% of listed homes in state)
- No. of counties considered in state: 22
Indiana: Howard County

- Local list price to income ratio: 3.0-to-1 (statewide: 4.2-to-1)
- Local list price of a typical home: $194,950 (statewide: $299,450 )
- Local median household income: $65,267 (statewide: $71,959 )
- Typical size of a listed home: 1,591 sq. ft. (statewide: 1,912 sq. ft.)
- 1-yr. change in local median list price: -4.3% (statewide: +1.5%)
- Total number of listed homes in September 2025: 340 (1.3% of listed homes in state)
- No. of counties considered in state: 27
Iowa: Woodbury County

- Local list price to income ratio: 3.0-to-1 (statewide: 3.7-to-1)
- Local list price of a typical home: $236,000 (statewide: $279,000 )
- Local median household income: $78,923 (statewide: $75,501 )
- Typical size of a listed home: 1,756 sq. ft. (statewide: 1,617 sq. ft.)
- 1-yr. change in local median list price: +2.6% (statewide: -3.7%)
- Total number of listed homes in September 2025: 243 (1.5% of listed homes in state)
- No. of counties considered in state: 10
Kansas: Shawnee County

- Local list price to income ratio: 3.5-to-1 (statewide: 3.9-to-1)
- Local list price of a typical home: $249,900 (statewide: $295,000 )
- Local median household income: $71,634 (statewide: $75,514 )
- Typical size of a listed home: 1,845 sq. ft. (statewide: 2,013 sq. ft.)
- 1-yr. change in local median list price: +6.4% (statewide: -1.3%)
- Total number of listed homes in September 2025: 484 (4.0% of listed homes in state)
- No. of counties considered in state: 8
Kentucky: Kenton County

- Local list price to income ratio: 3.6-to-1 (statewide: 4.8-to-1)
- Local list price of a typical home: $296,807 (statewide: $309,900 )
- Local median household income: $81,856 (statewide: $64,526 )
- Typical size of a listed home: 1,521 sq. ft. (statewide: 1,809 sq. ft.)
- 1-yr. change in local median list price: -2.9% (statewide: +3.3%)
- Total number of listed homes in September 2025: 623 (3.5% of listed homes in state)
- No. of counties considered in state: 14
Louisiana: Lafourche Parish

- Local list price to income ratio: 3.3-to-1 (statewide: 4.6-to-1)
- Local list price of a typical home: $222,140 (statewide: $278,500 )
- Local median household income: $66,810 (statewide: $60,986 )
- Typical size of a listed home: 1,770 sq. ft. (statewide: 1,852 sq. ft.)
- 1-yr. change in local median list price: -3.3% (statewide: +1.3%)
- Total number of listed homes in September 2025: 449 (2.1% of listed homes in state)
- No. of counties considered in state: 17
Maine: Aroostook County

- Local list price to income ratio: 3.9-to-1 (statewide: 6.1-to-1)
- Local list price of a typical home: $212,975 (statewide: $467,000 )
- Local median household income: $54,439 (statewide: $76,442 )
- Typical size of a listed home: 1,502 sq. ft. (statewide: 1,701 sq. ft.)
- 1-yr. change in local median list price: +5.2% (statewide: +3.8%)
- Total number of listed homes in September 2025: 414 (6.3% of listed homes in state)
- No. of counties considered in state: 6
Maryland: Allegany County

- Local list price to income ratio: 2.5-to-1 (statewide: 4.3-to-1)
- Local list price of a typical home: $160,950 (statewide: $443,950 )
- Local median household income: $65,498 (statewide: $102,905 )
- Typical size of a listed home: 1,675 sq. ft. (statewide: 1,874 sq. ft.)
- 1-yr. change in local median list price: +7.3% (statewide: +3.9%)
- Total number of listed homes in September 2025: 303 (1.3% of listed homes in state)
- No. of counties considered in state: 16
Massachusetts: Hampden County

- Local list price to income ratio: 5.2-to-1 (statewide: 7.2-to-1)
- Local list price of a typical home: $369,975 (statewide: $753,950 )
- Local median household income: $71,402 (statewide: $104,828 )
- Typical size of a listed home: 1,703 sq. ft. (statewide: 1,847 sq. ft.)
- 1-yr. change in local median list price: +7.3% (statewide: -3.3%)
- Total number of listed homes in September 2025: 592 (4.2% of listed homes in state)
- No. of counties considered in state: 12
Michigan: Wayne County

- Local list price to income ratio: 2.7-to-1 (statewide: 4.1-to-1)
- Local list price of a typical home: $159,950 (statewide: $299,900 )
- Local median household income: $59,294 (statewide: $72,389 )
- Typical size of a listed home: 1,259 sq. ft. (statewide: 1,605 sq. ft.)
- 1-yr. change in local median list price: +1.1% (statewide: +1.0%)
- Total number of listed homes in September 2025: 7,155 (18.3% of listed homes in state)
- No. of counties considered in state: 31
Minnesota: Sherburne County

- Local list price to income ratio: 3.7-to-1 (statewide: 4.5-to-1)
- Local list price of a typical home: $412,475 (statewide: $389,000 )
- Local median household income: $112,251 (statewide: $87,117 )
- Typical size of a listed home: 1,984 sq. ft. (statewide: 1,975 sq. ft.)
- 1-yr. change in local median list price: -2.9% (statewide: -0.9%)
- Total number of listed homes in September 2025: 466 (2.0% of listed homes in state)
- No. of counties considered in state: 16
Mississippi: Lauderdale County

- Local list price to income ratio: 3.1-to-1 (statewide: 5.0-to-1)
- Local list price of a typical home: $185,250 (statewide: $296,500 )
- Local median household income: $60,202 (statewide: $59,127 )
- Typical size of a listed home: 1,976 sq. ft. (statewide: 1,978 sq. ft.)
- 1-yr. change in local median list price: -14.8% (statewide: -0.2%)
- Total number of listed homes in September 2025: 176 (1.5% of listed homes in state)
- No. of counties considered in state: 11
Missouri: St. Louis County

- Local list price to income ratio: 3.0-to-1 (statewide: 4.2-to-1)
- Local list price of a typical home: $250,000 (statewide: $302,450 )
- Local median household income: $83,669 (statewide: $71,589 )
- Typical size of a listed home: 1,537 sq. ft. (statewide: 1,748 sq. ft.)
- 1-yr. change in local median list price: -9.6% (statewide: +0.8%)
- Total number of listed homes in September 2025: 3,552 (12.1% of listed homes in state)
- No. of counties considered in state: 18
Montana: Yellowstone County

- Local list price to income ratio: 5.8-to-1 (statewide: 8.5-to-1)
- Local list price of a typical home: $444,975 (statewide: $637,000 )
- Local median household income: $76,858 (statewide: $75,340 )
- Typical size of a listed home: 2,344 sq. ft. (statewide: 2,146 sq. ft.)
- 1-yr. change in local median list price: +0.6% (statewide: -2.0%)
- Total number of listed homes in September 2025: 900 (11.6% of listed homes in state)
- No. of counties considered in state: 6
Nebraska: Sarpy County
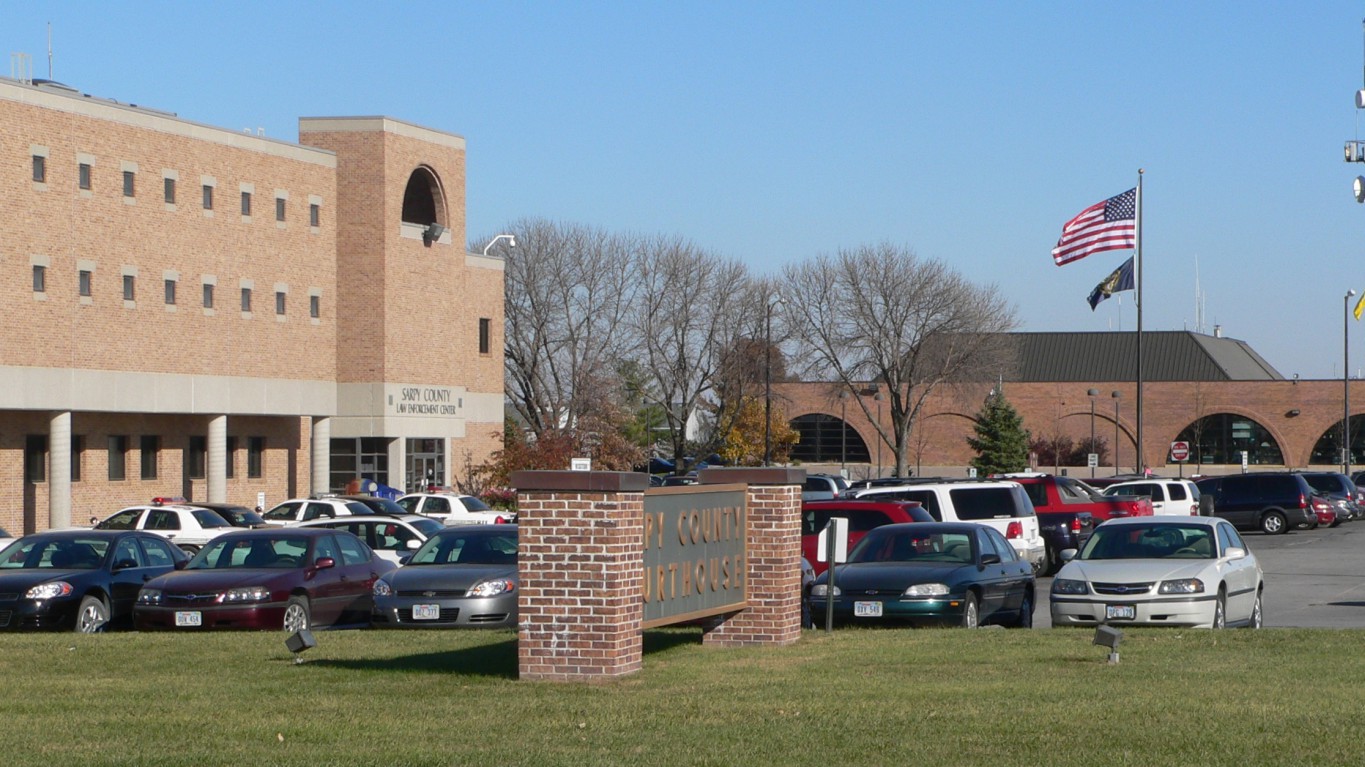
- Local list price to income ratio: 4.2-to-1 (statewide: 4.5-to-1)
- Local list price of a typical home: $422,226 (statewide: $343,400 )
- Local median household income: $101,316 (statewide: $76,376 )
- Typical size of a listed home: 2,407 sq. ft. (statewide: 2,107 sq. ft.)
- 1-yr. change in local median list price: +3.7% (statewide: -0.5%)
- Total number of listed homes in September 2025: 1,271 (14.7% of listed homes in state)
- No. of counties considered in state: 3
Nevada: Clark County

- Local list price to income ratio: 5.9-to-1 (statewide: 6.1-to-1)
- Local list price of a typical home: $475,000 (statewide: $496,889 )
- Local median household income: $80,028 (statewide: $81,134 )
- Typical size of a listed home: 1,796 sq. ft. (statewide: 1,831 sq. ft.)
- 1-yr. change in local median list price: -0.5% (statewide: -0.5%)
- Total number of listed homes in September 2025: 12,941 (75.8% of listed homes in state)
- No. of counties considered in state: 2
New Hampshire: Hillsborough County

- Local list price to income ratio: 5.4-to-1 (statewide: 5.9-to-1)
- Local list price of a typical home: $575,375 (statewide: $592,450 )
- Local median household income: $106,013 (statewide: $99,782 )
- Typical size of a listed home: 2,020 sq. ft. (statewide: 1,940 sq. ft.)
- 1-yr. change in local median list price: +2.1% (statewide: +3.0%)
- Total number of listed homes in September 2025: 1,069 (18.6% of listed homes in state)
- No. of counties considered in state: 7
New Jersey: Salem County

- Local list price to income ratio: 3.5-to-1 (statewide: 5.3-to-1)
- Local list price of a typical home: $294,950 (statewide: $557,000 )
- Local median household income: $83,376 (statewide: $104,294 )
- Typical size of a listed home: 1,620 sq. ft. (statewide: 1,704 sq. ft.)
- 1-yr. change in local median list price: -12.0% (statewide: -4.0%)
- Total number of listed homes in September 2025: 314 (1.1% of listed homes in state)
- No. of counties considered in state: 21
New Mexico: Lea County

- Local list price to income ratio: 4.3-to-1 (statewide: 5.9-to-1)
- Local list price of a typical home: $343,250 (statewide: $400,000 )
- Local median household income: $80,482 (statewide: $67,816 )
- Typical size of a listed home: 2,140 sq. ft. (statewide: 1,967 sq. ft.)
- 1-yr. change in local median list price: +22.8% (statewide: +0.4%)
- Total number of listed homes in September 2025: 128 (1.4% of listed homes in state)
- No. of counties considered in state: 9
New York: Chemung County

- Local list price to income ratio: 2.6-to-1 (statewide: 7.6-to-1)
- Local list price of a typical home: $171,950 (statewide: $649,450 )
- Local median household income: $66,527 (statewide: $85,820 )
- Typical size of a listed home: 1,654 sq. ft. (statewide: 1,584 sq. ft.)
- 1-yr. change in local median list price: +1.5% (statewide: -0.1%)
- Total number of listed homes in September 2025: 438 (0.7% of listed homes in state)
- No. of counties considered in state: 38
North Carolina: Wilson County
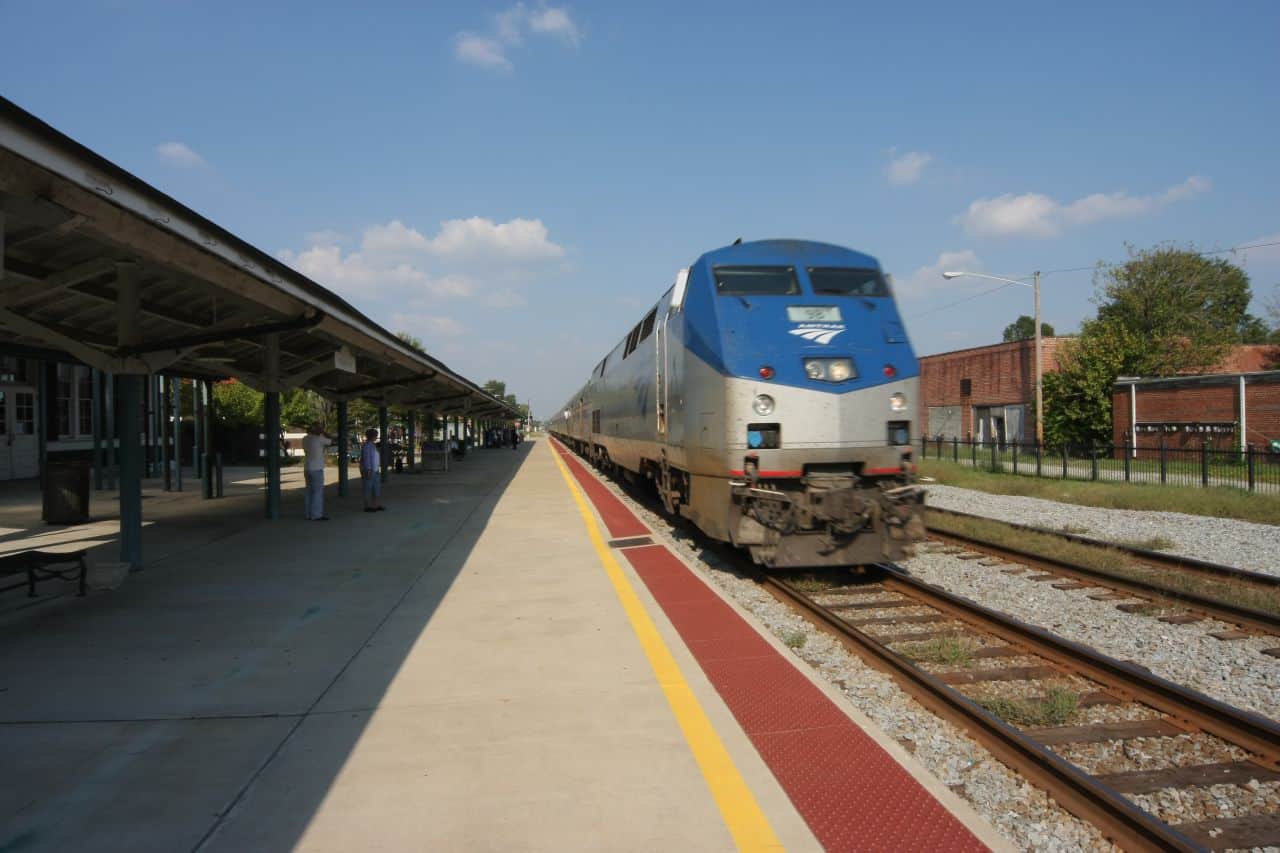
- Local list price to income ratio: 4.2-to-1 (statewide: 5.7-to-1)
- Local list price of a typical home: $269,498 (statewide: $419,450 )
- Local median household income: $64,769 (statewide: $73,958 )
- Typical size of a listed home: 1,648 sq. ft. (statewide: 1,967 sq. ft.)
- 1-yr. change in local median list price: -4.7% (statewide: +1.5%)
- Total number of listed homes in September 2025: 358 (0.6% of listed homes in state)
- No. of counties considered in state: 44
North Dakota: Ward County
- Local list price to income ratio: 4.8-to-1 (statewide: 4.7-to-1)
- Local list price of a typical home: $330,650 (statewide: $364,425 )
- Local median household income: $69,069 (statewide: $77,871 )
- Typical size of a listed home: 2,389 sq. ft. (statewide: 2,186 sq. ft.)
- 1-yr. change in local median list price: +2.9% (statewide: -0.1%)
- Total number of listed homes in September 2025: 253 (7.8% of listed homes in state)
- No. of counties considered in state: 4
Ohio: Allen County

- Local list price to income ratio: 2.7-to-1 (statewide: 4.0-to-1)
- Local list price of a typical home: $179,375 (statewide: $286,500 )
- Local median household income: $67,668 (statewide: $72,212 )
- Typical size of a listed home: 1,548 sq. ft. (statewide: 1,750 sq. ft.)
- 1-yr. change in local median list price: -16.1% (statewide: +4.2%)
- Total number of listed homes in September 2025: 331 (0.9% of listed homes in state)
- No. of counties considered in state: 38
Oklahoma: Comanche County

- Local list price to income ratio: 3.2-to-1 (statewide: 4.5-to-1)
- Local list price of a typical home: $196,750 (statewide: $299,250 )
- Local median household income: $62,228 (statewide: $66,148 )
- Typical size of a listed home: 1,700 sq. ft. (statewide: 1,860 sq. ft.)
- 1-yr. change in local median list price: +6.4% (statewide: +0.9%)
- Total number of listed homes in September 2025: 621 (2.8% of listed homes in state)
- No. of counties considered in state: 11
Oregon: Umatilla County
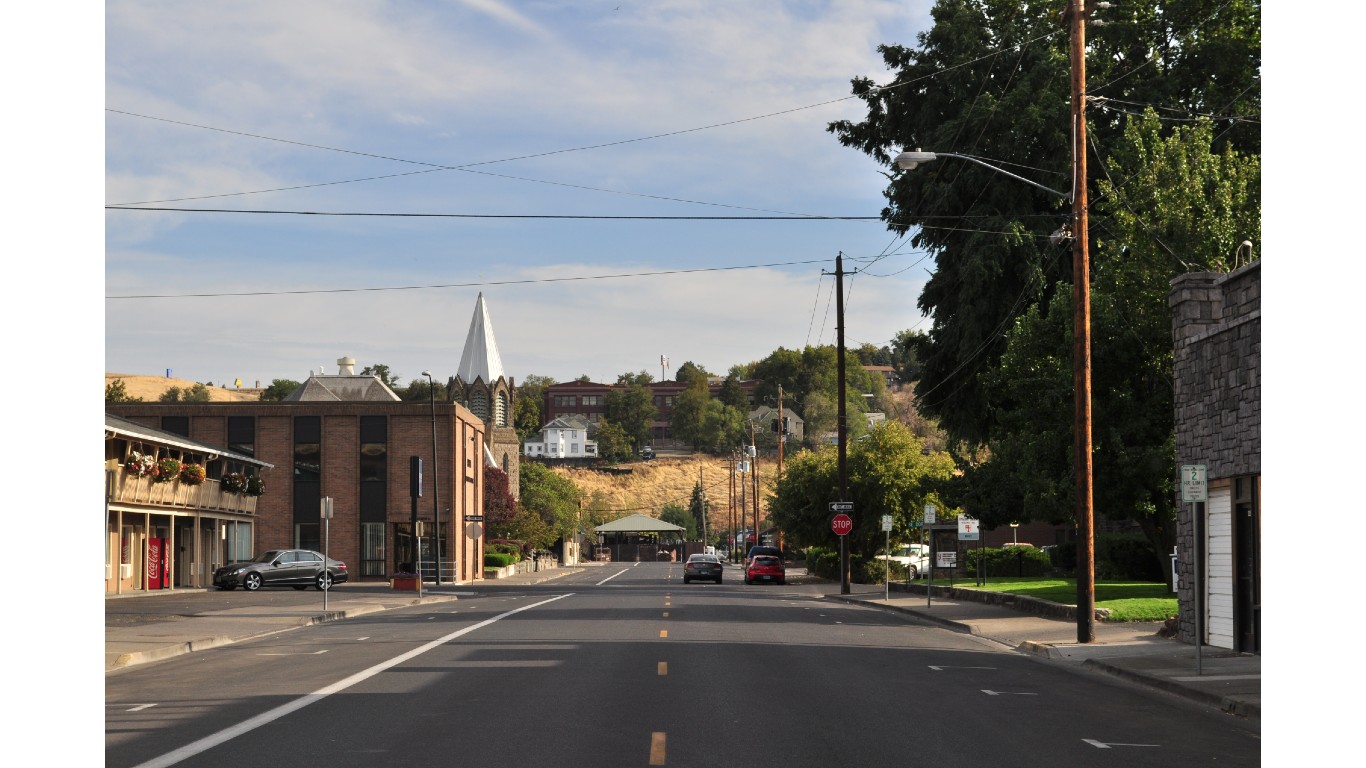
- Local list price to income ratio: 5.4-to-1 (statewide: 6.6-to-1)
- Local list price of a typical home: $361,225 (statewide: $566,000 )
- Local median household income: $67,518 (statewide: $85,220 )
- Typical size of a listed home: 1,677 sq. ft. (statewide: 1,891 sq. ft.)
- 1-yr. change in local median list price: -4.9% (statewide: -1.1%)
- Total number of listed homes in September 2025: 296 (1.3% of listed homes in state)
- No. of counties considered in state: 15
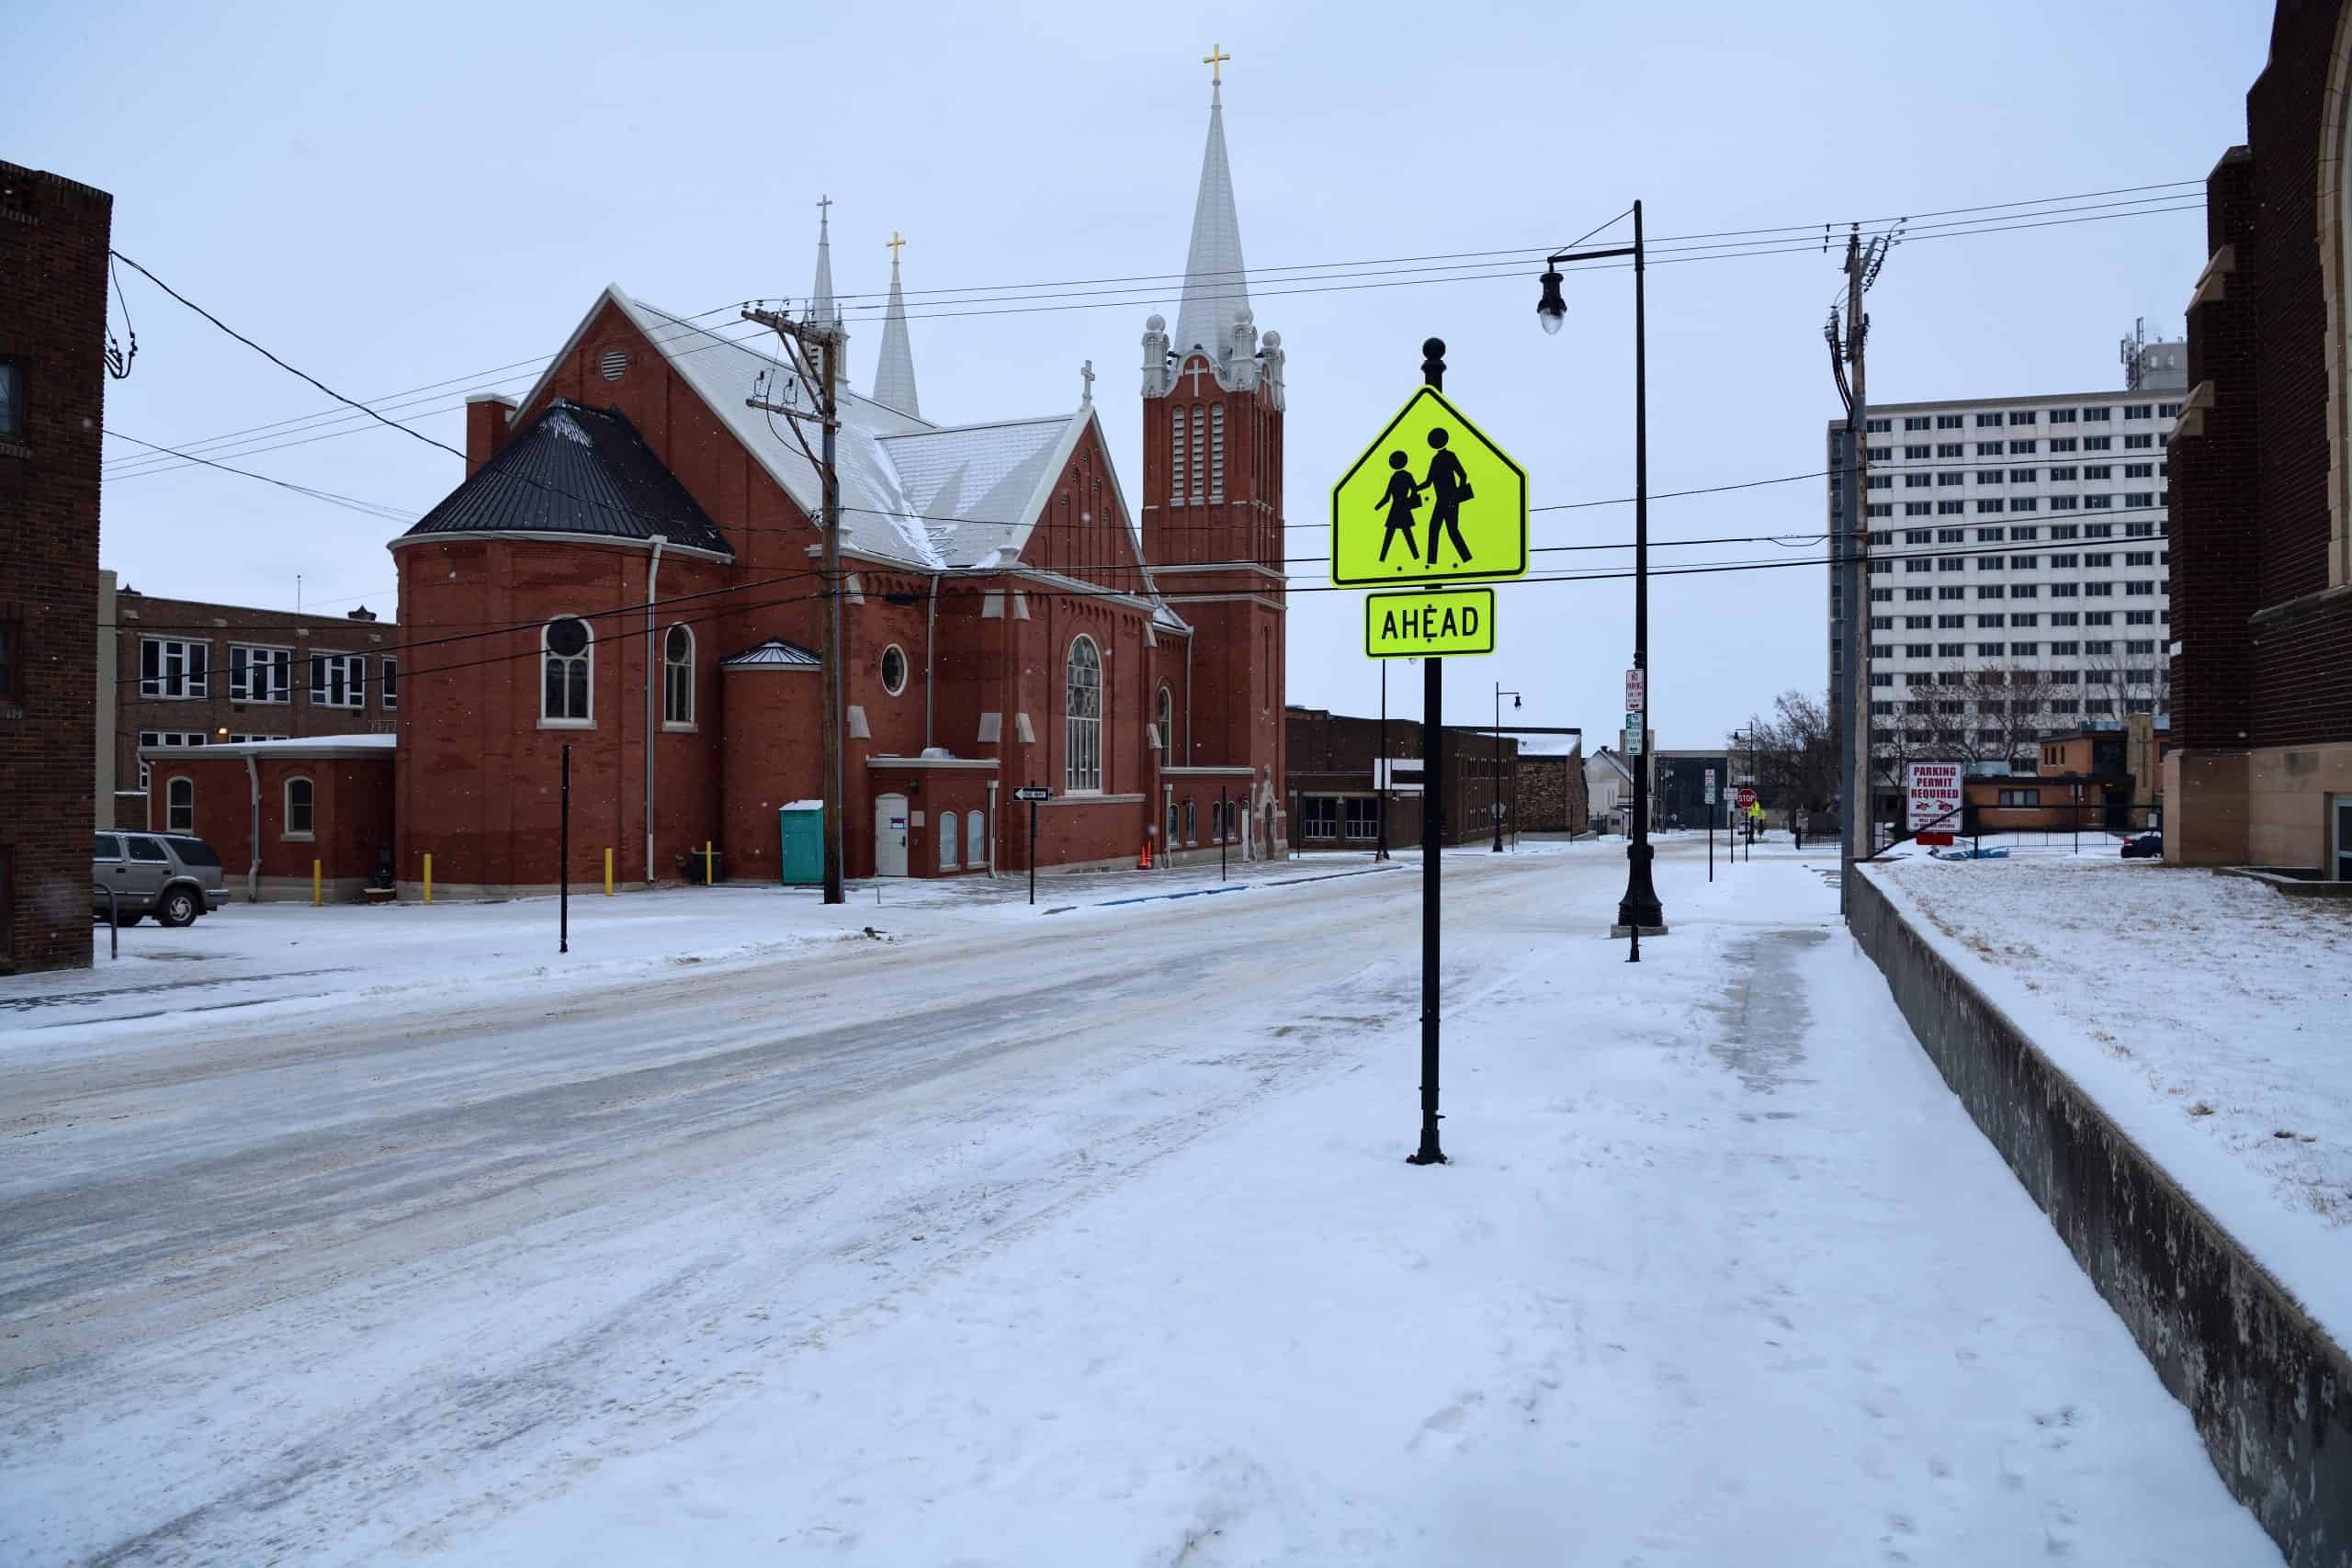
Pennsylvania: Cambria County

- Local list price to income ratio: 1.8-to-1 (statewide: 4.1-to-1)
- Local list price of a typical home: $112,200 (statewide: $320,000 )
- Local median household income: $61,786 (statewide: $77,545 )
- Typical size of a listed home: 1,499 sq. ft. (statewide: 1,711 sq. ft.)
- 1-yr. change in local median list price: -16.8% (statewide: +3.3%)
- Total number of listed homes in September 2025: 343 (0.8% of listed homes in state)
- No. of counties considered in state: 40
Rhode Island: Kent County

- Local list price to income ratio: 5.2-to-1 (statewide: 7.0-to-1)
- Local list price of a typical home: $497,000 (statewide: $584,142 )
- Local median household income: $96,090 (statewide: $83,504 )
- Typical size of a listed home: 1,723 sq. ft. (statewide: 1,906 sq. ft.)
- 1-yr. change in local median list price: +2.4% (statewide: +2.5%)
- Total number of listed homes in September 2025: 601 (19.4% of listed homes in state)
- No. of counties considered in state: 4
South Carolina: Lexington County
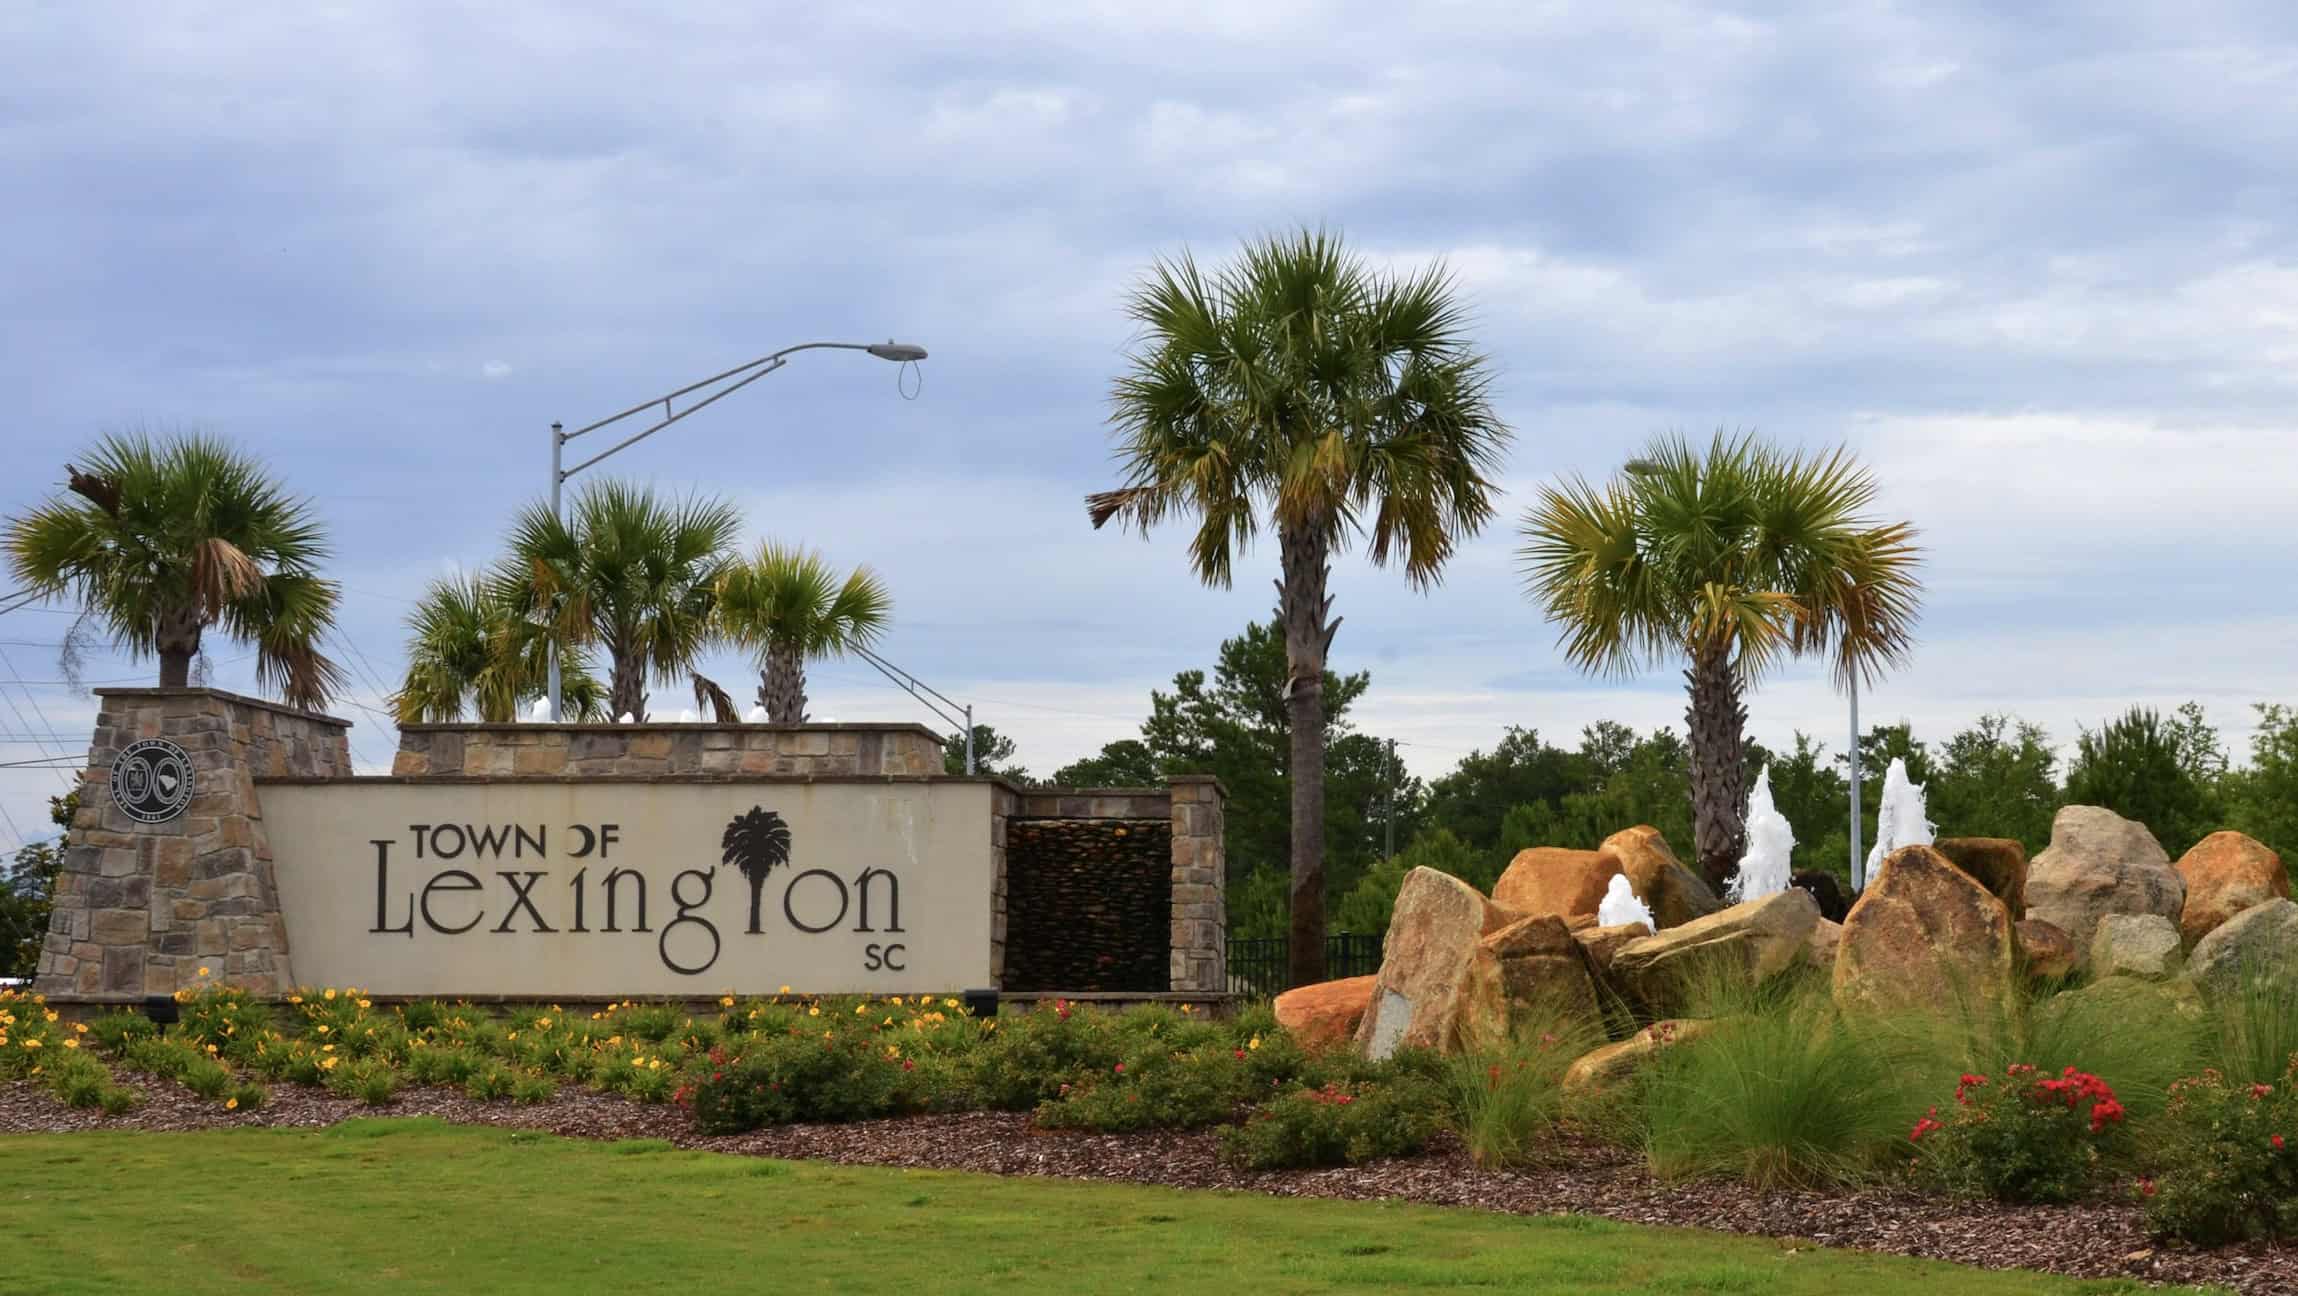
- Local list price to income ratio: 4.1-to-1 (statewide: 5.1-to-1)
- Local list price of a typical home: $321,950 (statewide: $368,500 )
- Local median household income: $78,447 (statewide: $72,350 )
- Typical size of a listed home: 2,096 sq. ft. (statewide: 1,846 sq. ft.)
- 1-yr. change in local median list price: +0.8% (statewide: +3.8%)
- Total number of listed homes in September 2025: 1,691 (4.5% of listed homes in state)
- No. of counties considered in state: 22
South Dakota: Lincoln County

- Local list price to income ratio: 3.9-to-1 (statewide: 4.9-to-1)
- Local list price of a typical home: $386,800 (statewide: $373,350 )
- Local median household income: $98,972 (statewide: $76,881 )
- Typical size of a listed home: 1,711 sq. ft. (statewide: 1,892 sq. ft.)
- 1-yr. change in local median list price: -1.3% (statewide: -1.7%)
- Total number of listed homes in September 2025: 546 (11.8% of listed homes in state)
- No. of counties considered in state: 3
Tennessee: Shelby County

- Local list price to income ratio: 4.4-to-1 (statewide: 6.0-to-1)
- Local list price of a typical home: $283,803 (statewide: $429,900 )
- Local median household income: $64,995 (statewide: $71,997 )
- Typical size of a listed home: 1,680 sq. ft. (statewide: 1,992 sq. ft.)
- 1-yr. change in local median list price: -6.2% (statewide: +0.1%)
- Total number of listed homes in September 2025: 4,464 (9.7% of listed homes in state)
- No. of counties considered in state: 22
Texas: Wichita County

- Local list price to income ratio: 2.9-to-1 (statewide: 4.6-to-1)
- Local list price of a typical home: $192,500 (statewide: $364,950 )
- Local median household income: $66,070 (statewide: $79,721 )
- Typical size of a listed home: 1,602 sq. ft. (statewide: 2,000 sq. ft.)
- 1-yr. change in local median list price: -5.9% (statewide: -2.7%)
- Total number of listed homes in September 2025: 603 (0.4% of listed homes in state)
- No. of counties considered in state: 58
Utah: Tooele County

- Local list price to income ratio: 4.6-to-1 (statewide: 6.1-to-1)
- Local list price of a typical home: $522,873 (statewide: $590,000 )
- Local median household income: $112,942 (statewide: $96,658 )
- Typical size of a listed home: 2,900 sq. ft. (statewide: 2,438 sq. ft.)
- 1-yr. change in local median list price: +0.7% (statewide: -1.7%)
- Total number of listed homes in September 2025: 541 (2.8% of listed homes in state)
- No. of counties considered in state: 8
Vermont: Chittenden County

- Local list price to income ratio: 6.5-to-1 (statewide: 6.1-to-1)
- Local list price of a typical home: $594,300 (statewide: $504,450 )
- Local median household income: $91,144 (statewide: $82,730 )
- Typical size of a listed home: 1,939 sq. ft. (statewide: 2,002 sq. ft.)
- 1-yr. change in local median list price: +2.0% (statewide: +1.1%)
- Total number of listed homes in September 2025: 634 (16.6% of listed homes in state)
- No. of counties considered in state: 1
Virginia: Roanoke County
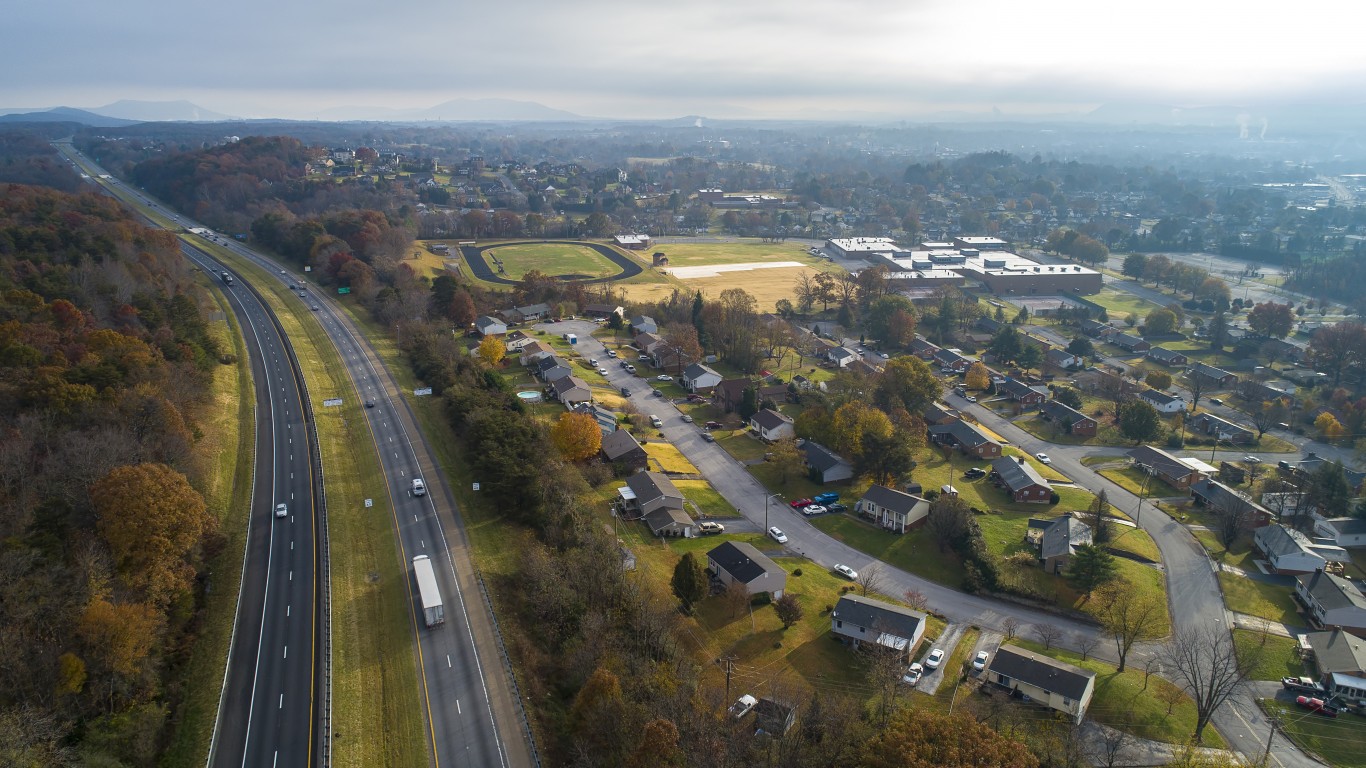
- Local list price to income ratio: 3.9-to-1 (statewide: 4.9-to-1)
- Local list price of a typical home: $235,000 (statewide: $450,000 )
- Local median household income: $60,456 (statewide: $92,090 )
- Typical size of a listed home: 1,521 sq. ft. (statewide: 1,980 sq. ft.)
- 1-yr. change in local median list price: -3.7% (statewide: +2.3%)
- Total number of listed homes in September 2025: 411 (1.3% of listed homes in state)
- No. of counties considered in state: 30
Washington: Benton County

- Local list price to income ratio: 5.6-to-1 (statewide: 6.5-to-1)
- Local list price of a typical home: $514,000 (statewide: $648,900 )
- Local median household income: $91,356 (statewide: $99,389 )
- Typical size of a listed home: 2,064 sq. ft. (statewide: 1,965 sq. ft.)
- 1-yr. change in local median list price: -2.5% (statewide: -0.2%)
- Total number of listed homes in September 2025: 1,054 (3.1% of listed homes in state)
- No. of counties considered in state: 20
West Virginia: Kanawha County

- Local list price to income ratio: 2.6-to-1 (statewide: 4.3-to-1)
- Local list price of a typical home: $159,900 (statewide: $261,500 )
- Local median household income: $62,539 (statewide: $60,798 )
- Typical size of a listed home: 1,647 sq. ft. (statewide: 1,764 sq. ft.)
- 1-yr. change in local median list price: -3.0% (statewide: +9.0%)
- Total number of listed homes in September 2025: 590 (8.8% of listed homes in state)
- No. of counties considered in state: 7
Wisconsin: Manitowoc County

- Local list price to income ratio: 4.0-to-1 (statewide: 5.1-to-1)
- Local list price of a typical home: $274,975 (statewide: $392,325 )
- Local median household income: $68,461 (statewide: $77,488 )
- Typical size of a listed home: 1,680 sq. ft. (statewide: 1,804 sq. ft.)
- 1-yr. change in local median list price: -0.8% (statewide: +2.6%)
- Total number of listed homes in September 2025: 235 (1.2% of listed homes in state)
- No. of counties considered in state: 25
Wyoming: Natrona County
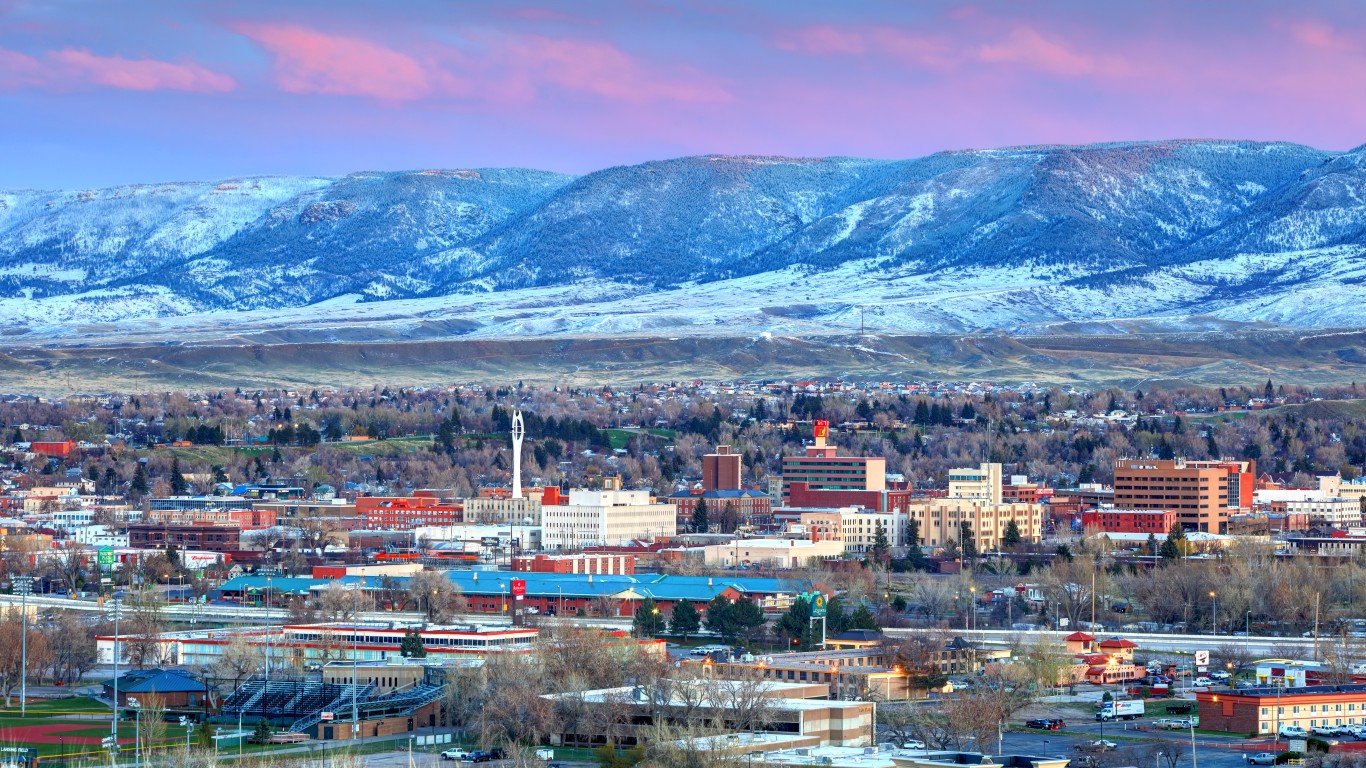
- Local list price to income ratio: 5.1-to-1 (statewide: 6.3-to-1)
- Local list price of a typical home: $361,000 (statewide: $472,500 )
- Local median household income: $71,381 (statewide: $75,532 )
- Typical size of a listed home: 2,188 sq. ft. (statewide: 2,204 sq. ft.)
- 1-yr. change in local median list price: -7.0% (statewide: -1.5%)
- Total number of listed homes in September 2025: 268 (7.9% of listed homes in state)
- No. of counties considered in state: 2