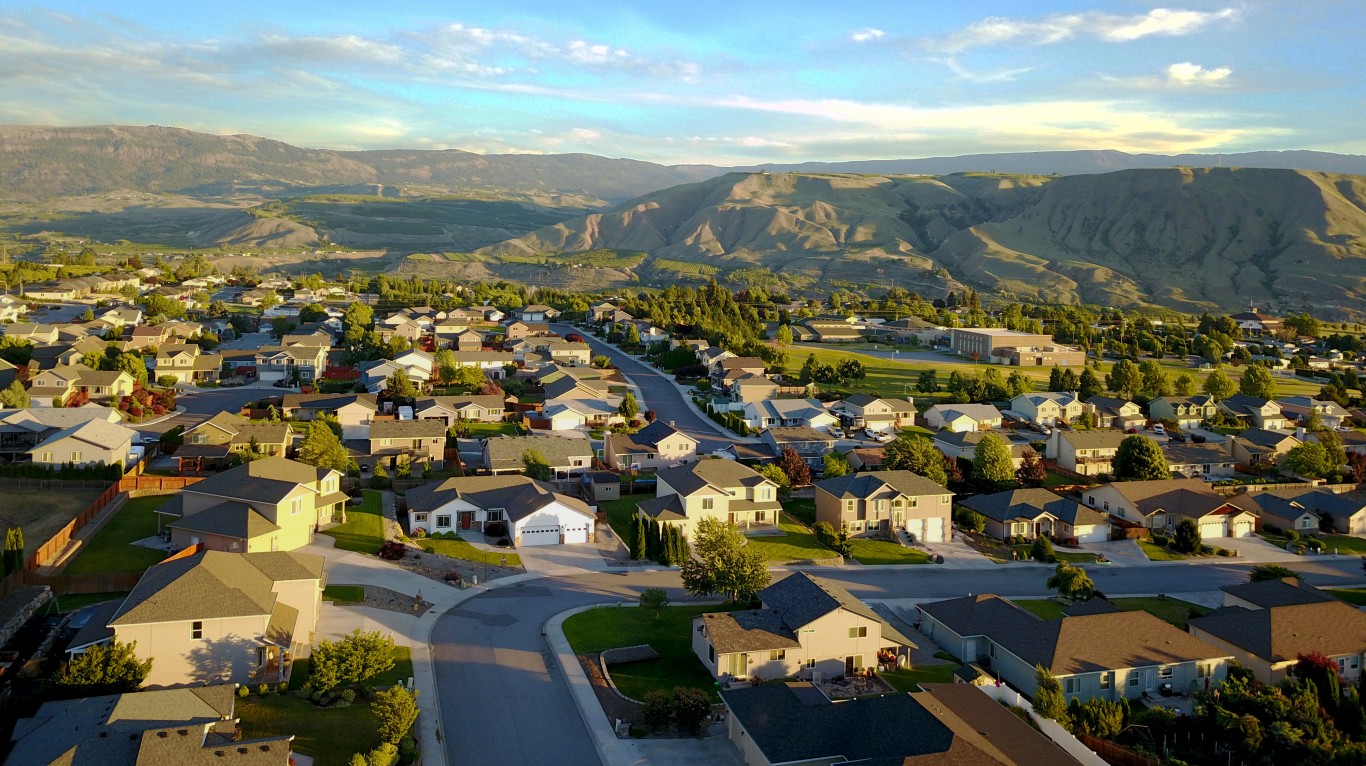
The United States is in the midst of a housing crisis — fueled in large part by historically low inventory. New housing construction stalled in the wake of the 2008 financial crisis and again after the COVID-19 pandemic, due to high materials costs and supply chain constraints. According to some estimates, the U.S. may currently have as many as 4.5 million fewer homes than it needs.
24/7 Wall St. Key Points:
- Supply constraints and growing demand have sent home prices surging in the U.S. in recent years.
- Income growth has not kept pace, and these dynamics have resulted in an affordability crisis — particularly in certain parts of the country.
- Also: 2 Dividend Legends To Hold Forever
More recently, the impact that lags in new home construction have had on housing inventory have been compounded by a decline in existing home sales. Mortgage rates have exceeded 6% for much of the last two years, and high borrowing costs have de-incentivised many Americans from listing their home on the market. According to data from Realtor.com, there have been an average of only 755,200 active listings per month in the U.S. over the last two years, down from 1.2 million per month over the two years immediately preceding the start of the COVID-19 pandemic. (This is how Baby Boomers impacted the housing market for younger buyers.)
For any commodity, scarcity can drive up consumer prices — and housing is no exception. As of February 2025, the typical American home on the market was listed for $412,000, up about 38% from the median list price in January 2020 of $299,250, according to Realtor.com’s housing market database. Wage growth has not kept pace, and now millions of Americans are priced out of the housing market. The problem is especially evident in certain parts of the country.
Using county-level data from Realtor.com, 24/7 Wall St. identified America’s least affordable housing markets. We reviewed the median list price in February 2025 for over 3,000 U.S. counties and county equivalents and calculated the local housing affordability ratio using five year estimates from the U.S. Census Bureau’s American Community Survey. To avoid statistical anomalies, only counties with at least 100 listed homes in February 2025 were considered.
Among the 45 counties on this list, the typical home for sale is listed for anywhere from 10.9 to 46.2 times more than the local median household income. For context, the national affordability ratio stands at 5.3. The majority of counties on this list are in the West, including seven in both California and Colorado. The 11 Southern counties on this list are concentrated in Florida, North Carolina, and Texas. Only two of these counties are in the Midwest, and the Northeast is home to three. (Here is a look at the states with the highest foreclosure rates.)
Low homeownership affordability ratios in most of these places are due, not to low incomes, but rather to high home values. In every county on this list, the typical listed home sells for anywhere from $287 to $2,313 per square foot. Meanwhile, the median price per square foot nationwide is only $227. Additionally, according to the latest five year ACS estimates, the typical household in most of these counties earns more than the national median household income of $78,538.
These are America’s least affordable housing markets.
Why It Matters
Supply constraints and rising demand have given way to a housing affordability crisis in the United States. Not even considering historically high mortgage rates, the typical American home has a median list price that is over five times more than what the typical household earns in a year. Still, location matters when it comes to the housing market, and while housing has become less affordable virtually nationwide in recent years, in some parts of the country, the affordability crisis is especially pronounced.
45. Polk County, North Carolina

- Typical home price relative to income: 10.9 times higher than median income
- Median home list price in February 2025: $667,200 ($309 per square foot)
- Median household income: $61,005
- 1-year change in median list price: -23.8%
- Total number of listed homes in February 2025: 134
44. Chaffee County, Colorado
- Typical home price relative to income: 11.0 times higher than median income
- Median home list price in February 2025: $779,750 ($437 per square foot)
- Median household income: $70,909
- 1-year change in median list price: +7.0%
- Total number of listed homes in February 2025: 174
43. Mono County, California

- Typical home price relative to income: 11.1 times higher than median income
- Median home list price in February 2025: $968,687 ($687 per square foot)
- Median household income: $86,953
- 1-year change in median list price: +29.5%
- Total number of listed homes in February 2025: 131
42. Gallatin County, Montana

- Typical home price relative to income: 11.2 times higher than median income
- Median home list price in February 2025: $981,000 ($434 per square foot)
- Median household income: $87,454
- 1-year change in median list price: -10.8%
- Total number of listed homes in February 2025: 684
41. Grand County, Colorado

- Typical home price relative to income: 11.2 times higher than median income
- Median home list price in February 2025: $949,000 ($570 per square foot)
- Median household income: $84,558
- 1-year change in median list price: -2.9%
- Total number of listed homes in February 2025: 449
40. Ravalli County, Montana

- Typical home price relative to income: 11.3 times higher than median income
- Median home list price in February 2025: $808,250 ($371 per square foot)
- Median household income: $71,323
- 1-year change in median list price: +2.1%
- Total number of listed homes in February 2025: 209
39. Llano County, Texas

- Typical home price relative to income: 11.4 times higher than median income
- Median home list price in February 2025: $749,075 ($375 per square foot)
- Median household income: $65,636
- 1-year change in median list price: +8.6%
- Total number of listed homes in February 2025: 507
38. Walton County, Florida

- Typical home price relative to income: 11.5 times higher than median income
- Median home list price in February 2025: $909,725 ($565 per square foot)
- Median household income: $79,281
- 1-year change in median list price: -8.9%
- Total number of listed homes in February 2025: 2,582
37. Flathead County, Montana
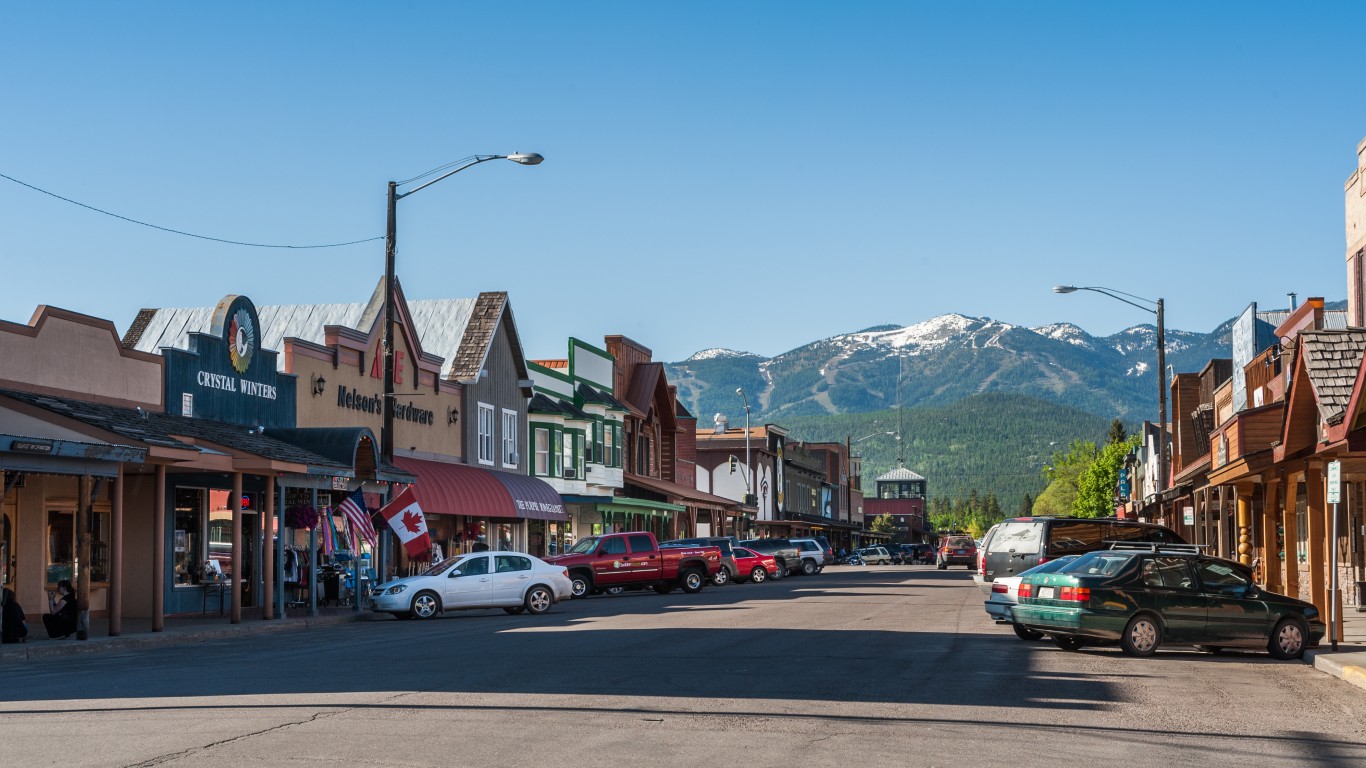
- Typical home price relative to income: 11.5 times higher than median income
- Median home list price in February 2025: $820,250 ($427 per square foot)
- Median household income: $71,327
- 1-year change in median list price: -3.5%
- Total number of listed homes in February 2025: 746
36. Los Angeles County, California

- Typical home price relative to income: 11.5 times higher than median income
- Median home list price in February 2025: $1,012,500 ($662 per square foot)
- Median household income: $87,760
- 1-year change in median list price: -3.5%
- Total number of listed homes in February 2025: 15,284
35. Wasatch County, Utah

- Typical home price relative to income: 11.6 times higher than median income
- Median home list price in February 2025: $1,337,500 ($525 per square foot)
- Median household income: $115,146
- 1-year change in median list price: -5.0%
- Total number of listed homes in February 2025: 887
34. Gillespie County, Texas

- Typical home price relative to income: 11.8 times higher than median income
- Median home list price in February 2025: $799,000 ($400 per square foot)
- Median household income: $67,799
- 1-year change in median list price: +0.1%
- Total number of listed homes in February 2025: 418
33. San Luis Obispo County, California

- Typical home price relative to income: 12.0 times higher than median income
- Median home list price in February 2025: $1,125,000 ($599 per square foot)
- Median household income: $93,398
- 1-year change in median list price: +9.3%
- Total number of listed homes in February 2025: 700
32. Fannin County, Georgia

- Typical home price relative to income: 12.1 times higher than median income
- Median home list price in February 2025: $699,924 ($329 per square foot)
- Median household income: $58,073
- 1-year change in median list price: -10.5%
- Total number of listed homes in February 2025: 631
31. Emmet County, Michigan

- Typical home price relative to income: 12.2 times higher than median income
- Median home list price in February 2025: $897,000 ($390 per square foot)
- Median household income: $73,724
- 1-year change in median list price: +54.7%
- Total number of listed homes in February 2025: 171
30. Winston County, Alabama

- Typical home price relative to income: 12.3 times higher than median income
- Median home list price in February 2025: $591,725 ($292 per square foot)
- Median household income: $48,032
- 1-year change in median list price: -18.4%
- Total number of listed homes in February 2025: 140
29. Lawrence County, South Dakota

- Typical home price relative to income: 12.4 times higher than median income
- Median home list price in February 2025: $825,750 ($315 per square foot)
- Median household income: $66,766
- 1-year change in median list price: +2.7%
- Total number of listed homes in February 2025: 199
28. Orange County, California

- Typical home price relative to income: 12.4 times higher than median income
- Median home list price in February 2025: $1,409,223 ($740 per square foot)
- Median household income: $113,702
- 1-year change in median list price: +4.4%
- Total number of listed homes in February 2025: 4,636
27. Macon County, North Carolina

- Typical home price relative to income: 12.4 times higher than median income
- Median home list price in February 2025: $661,500 ($287 per square foot)
- Median household income: $53,298
- 1-year change in median list price: -9.5%
- Total number of listed homes in February 2025: 274
26. Lake County, Montana

- Typical home price relative to income: 12.4 times higher than median income
- Median home list price in February 2025: $770,000 ($351 per square foot)
- Median household income: $61,965
- 1-year change in median list price: -11.2%
- Total number of listed homes in February 2025: 167
25. Maui County, Hawaii

- Typical home price relative to income: 12.6 times higher than median income
- Median home list price in February 2025: $1,199,000 ($1,093 per square foot)
- Median household income: $95,076
- 1-year change in median list price: -15.1%
- Total number of listed homes in February 2025: 1,390
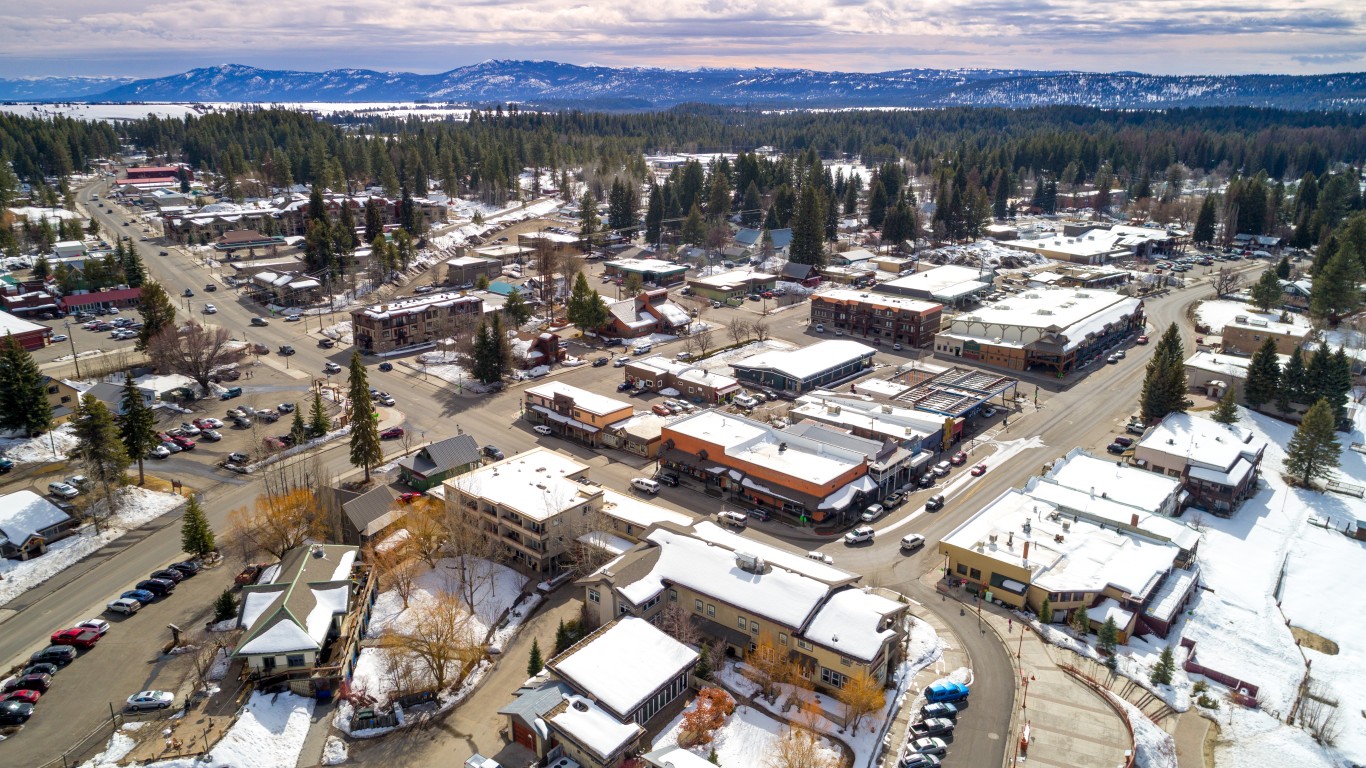
24. Teton County, Idaho

- Typical home price relative to income: 12.7 times higher than median income
- Median home list price in February 2025: $1,150,000 ($516 per square foot)
- Median household income: $90,740
- 1-year change in median list price: +34.0%
- Total number of listed homes in February 2025: 151
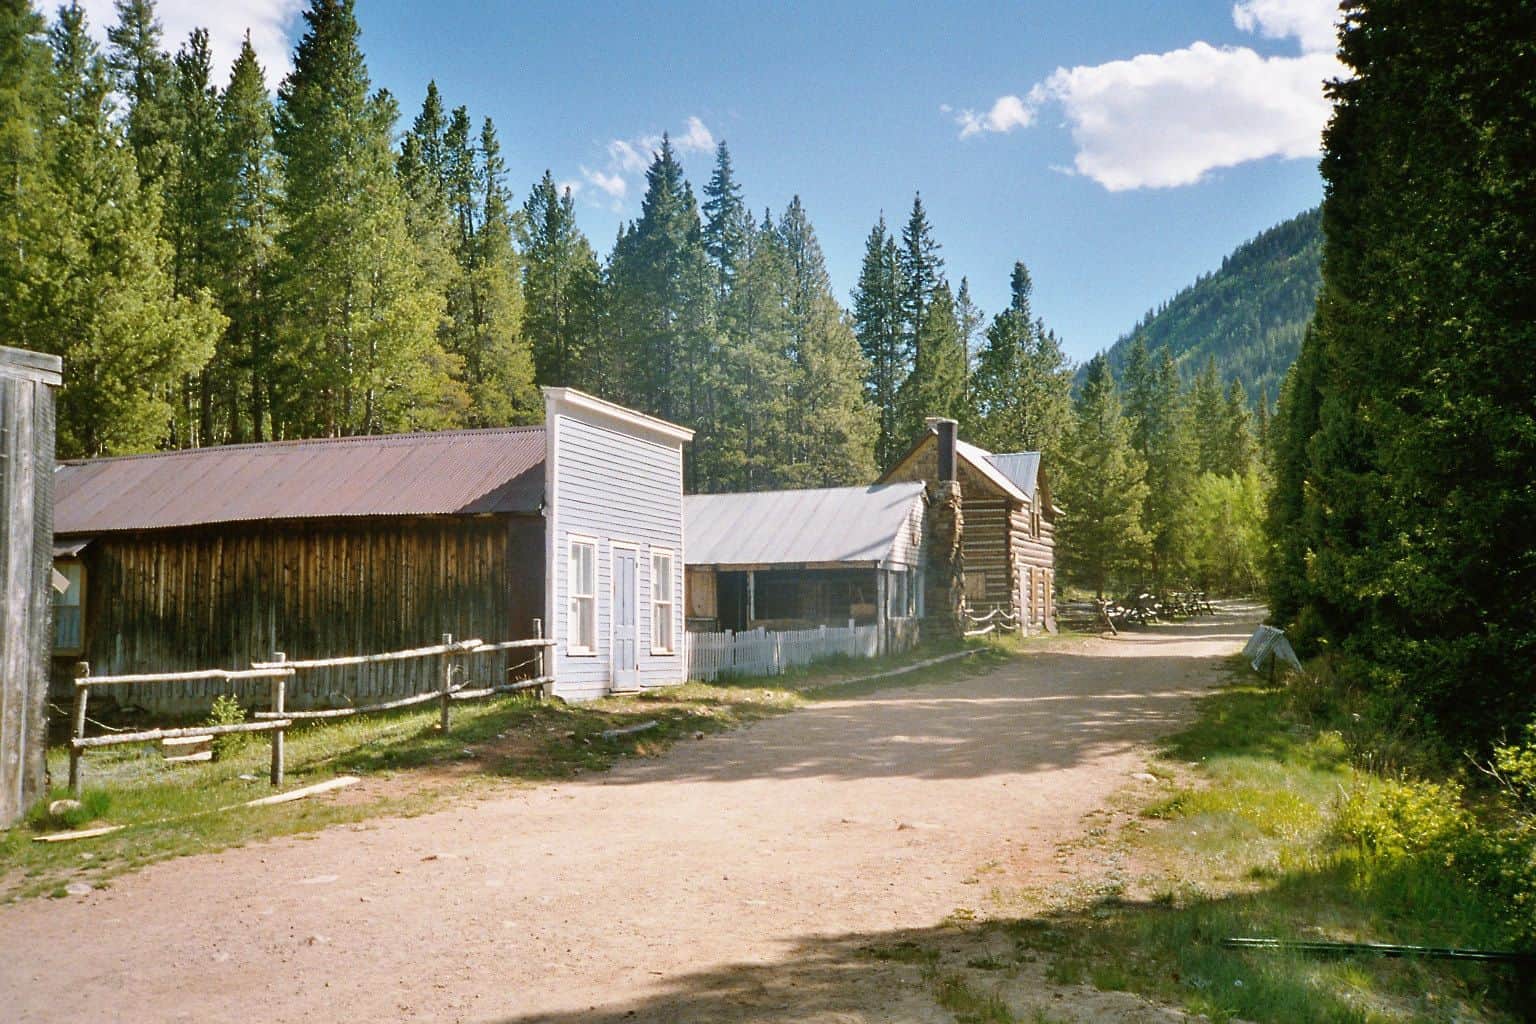
23. Lincoln County, Montana
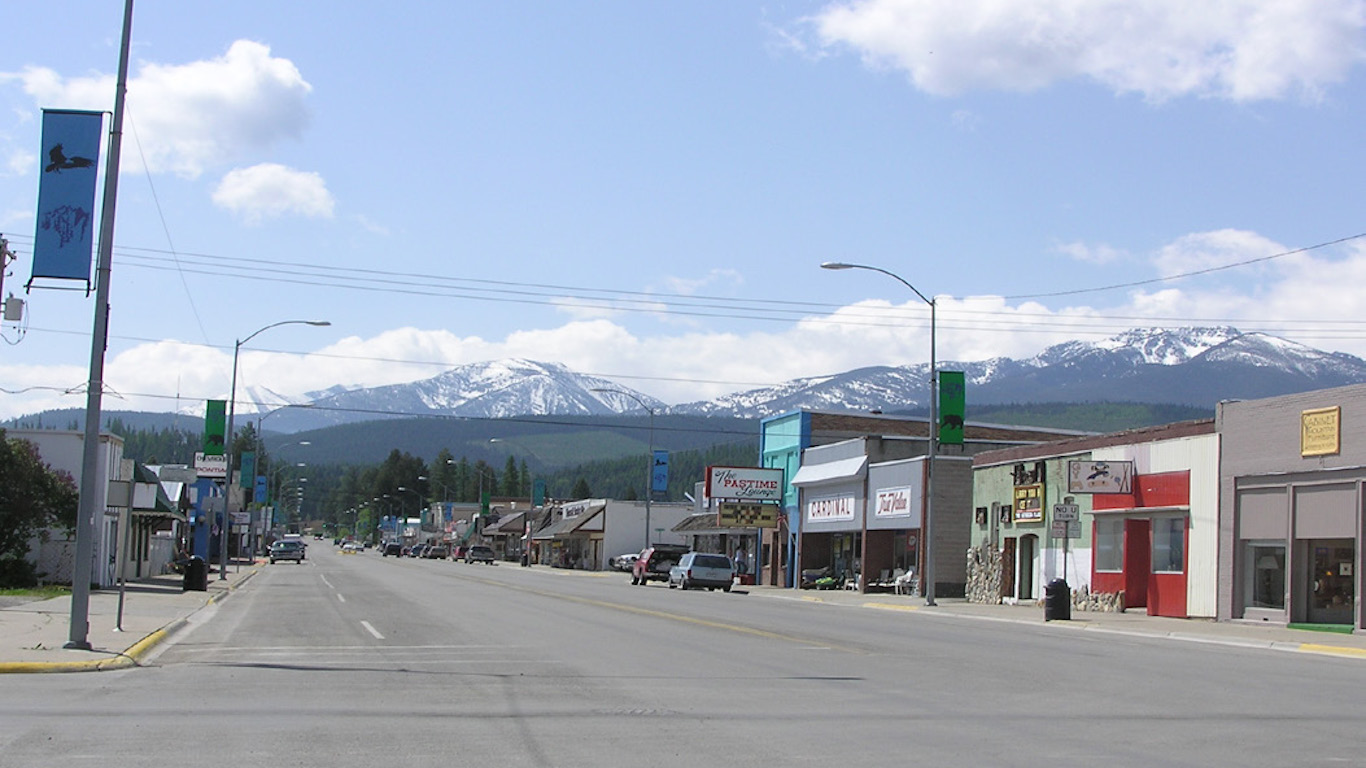
- Typical home price relative to income: 12.7 times higher than median income
- Median home list price in February 2025: $599,000 ($300 per square foot)
- Median household income: $47,018
- 1-year change in median list price: +10.5%
- Total number of listed homes in February 2025: 175
22. Bonner County, Idaho

- Typical home price relative to income: 12.8 times higher than median income
- Median home list price in February 2025: $832,625 ($436 per square foot)
- Median household income: $65,168
- 1-year change in median list price: +4.2%
- Total number of listed homes in February 2025: 396
21. Gunnison County, Colorado

- Typical home price relative to income: 12.8 times higher than median income
- Median home list price in February 2025: $990,000 ($728 per square foot)
- Median household income: $77,358
- 1-year change in median list price: -9.9%
- Total number of listed homes in February 2025: 196
20. McCurtain County, Oklahoma

- Typical home price relative to income: 12.9 times higher than median income
- Median home list price in February 2025: $649,450 ($374 per square foot)
- Median household income: $50,175
- 1-year change in median list price: -5.4%
- Total number of listed homes in February 2025: 623
19. Valley County, Idaho
- Typical home price relative to income: 13.1 times higher than median income
- Median home list price in February 2025: $999,000 ($589 per square foot)
- Median household income: $76,125
- 1-year change in median list price: +1.3%
- Total number of listed homes in February 2025: 246
18. Watauga County, North Carolina

- Typical home price relative to income: 13.6 times higher than median income
- Median home list price in February 2025: $699,000 ($354 per square foot)
- Median household income: $51,367
- 1-year change in median list price: +6.2%
- Total number of listed homes in February 2025: 351
17. Garfield County, Colorado

- Typical home price relative to income: 13.7 times higher than median income
- Median home list price in February 2025: $1,178,748 ($527 per square foot)
- Median household income: $86,172
- 1-year change in median list price: +23.1%
- Total number of listed homes in February 2025: 256
16. Monterey County, California

- Typical home price relative to income: 13.7 times higher than median income
- Median home list price in February 2025: $1,297,000 ($757 per square foot)
- Median household income: $94,486
- 1-year change in median list price: +5.5%
- Total number of listed homes in February 2025: 555
15. Madison County, Montana

- Typical home price relative to income: 13.7 times higher than median income
- Median home list price in February 2025: $926,125 ($746 per square foot)
- Median household income: $67,420
- 1-year change in median list price: -30.9%
- Total number of listed homes in February 2025: 140
14. Napa County, California

- Typical home price relative to income: 13.7 times higher than median income
- Median home list price in February 2025: $1,497,000 ($733 per square foot)
- Median household income: $108,970
- 1-year change in median list price: +3.3%
- Total number of listed homes in February 2025: 371
13. Summit County, Utah

- Typical home price relative to income: 14.8 times higher than median income
- Median home list price in February 2025: $2,033,750 ($894 per square foot)
- Median household income: $137,058
- 1-year change in median list price: +7.3%
- Total number of listed homes in February 2025: 873
12. New York County, New York

- Typical home price relative to income: 14.9 times higher than median income
- Median home list price in February 2025: $1,555,000 ($1,535 per square foot)
- Median household income: $104,553
- 1-year change in median list price: -8.4%
- Total number of listed homes in February 2025: 7,245
11. Kauai County, Hawaii

- Typical home price relative to income: 14.9 times higher than median income
- Median home list price in February 2025: $1,397,000 ($1,014 per square foot)
- Median household income: $93,612
- 1-year change in median list price: -14.4%
- Total number of listed homes in February 2025: 454
10. Routt County, Colorado
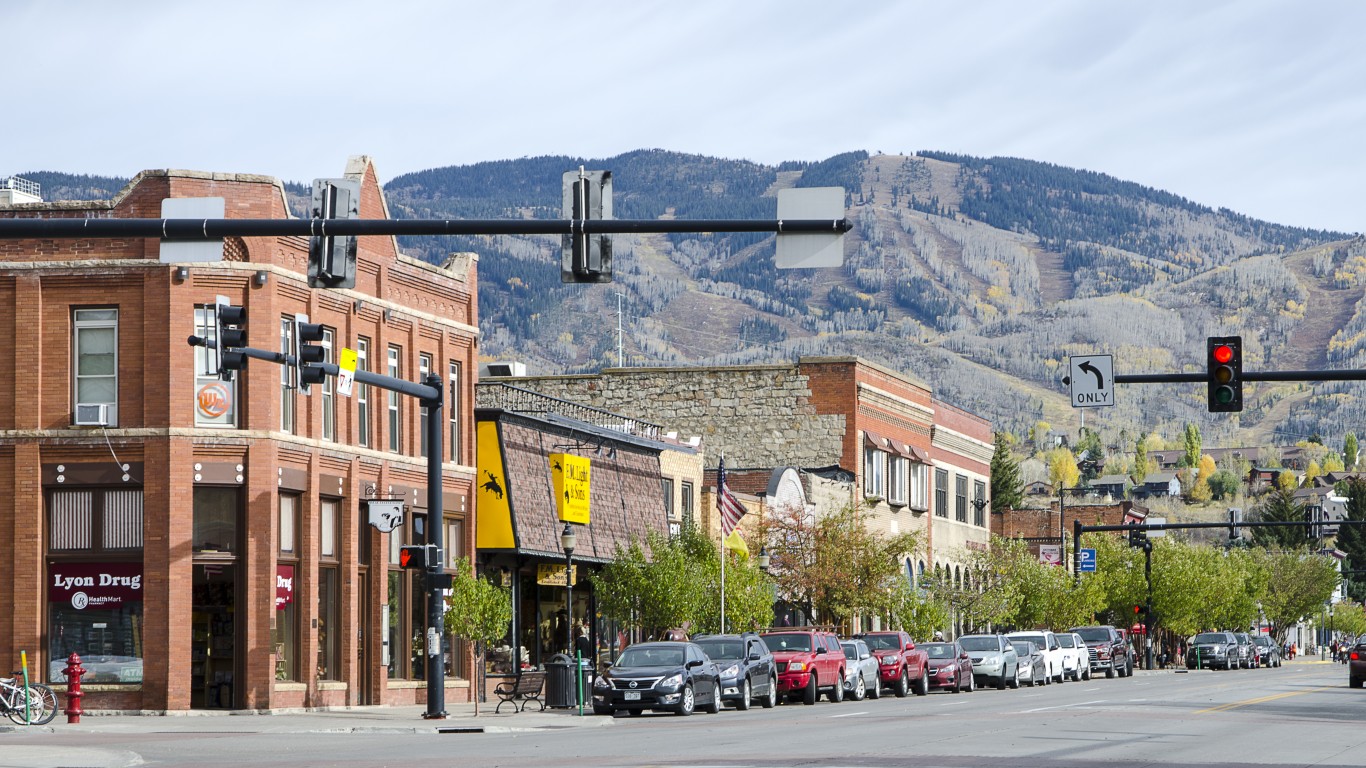
- Typical home price relative to income: 15.0 times higher than median income
- Median home list price in February 2025: $1,574,500 ($919 per square foot)
- Median household income: $104,803
- 1-year change in median list price: -16.0%
- Total number of listed homes in February 2025: 272
9. Jackson County, North Carolina

- Typical home price relative to income: 15.7 times higher than median income
- Median home list price in February 2025: $840,000 ($318 per square foot)
- Median household income: $53,479
- 1-year change in median list price: +8.8%
- Total number of listed homes in February 2025: 290
8. Monroe County, Florida

- Typical home price relative to income: 15.8 times higher than median income
- Median home list price in February 2025: $1,299,000 ($906 per square foot)
- Median household income: $82,430
- 1-year change in median list price: -6.2%
- Total number of listed homes in February 2025: 1,745
7. Santa Barbara County, California

- Typical home price relative to income: 21.9 times higher than median income
- Median home list price in February 2025: $2,101,750 ($1,025 per square foot)
- Median household income: $95,977
- 1-year change in median list price: +18.1%
- Total number of listed homes in February 2025: 653
6. Blaine County, Idaho
- Typical home price relative to income: 23.1 times higher than median income
- Median home list price in February 2025: $1,947,500 ($1,039 per square foot)
- Median household income: $84,470
- 1-year change in median list price: -8.4%
- Total number of listed homes in February 2025: 231
5. Dukes County, Massachusetts

- Typical home price relative to income: 24.9 times higher than median income
- Median home list price in February 2025: $2,550,000 ($1,068 per square foot)
- Median household income: $102,348
- 1-year change in median list price: +4.7%
- Total number of listed homes in February 2025: 140
4. Teton County, Wyoming

- Typical home price relative to income: 29.5 times higher than median income
- Median home list price in February 2025: $3,325,000 ($1,502 per square foot)
- Median household income: $112,681
- 1-year change in median list price: +19.4%
- Total number of listed homes in February 2025: 195
3. Pitkin County, Colorado

- Typical home price relative to income: 37.3 times higher than median income
- Median home list price in February 2025: $3,737,500 ($2,313 per square foot)
- Median household income: $100,318
- 1-year change in median list price: +48.5%
- Total number of listed homes in February 2025: 549
2. Nantucket County, Massachusetts

- Typical home price relative to income: 37.6 times higher than median income
- Median home list price in February 2025: $4,498,750 ($1,707 per square foot)
- Median household income: $119,750
- 1-year change in median list price: +8.1%
- Total number of listed homes in February 2025: 104
1. San Miguel County, Colorado
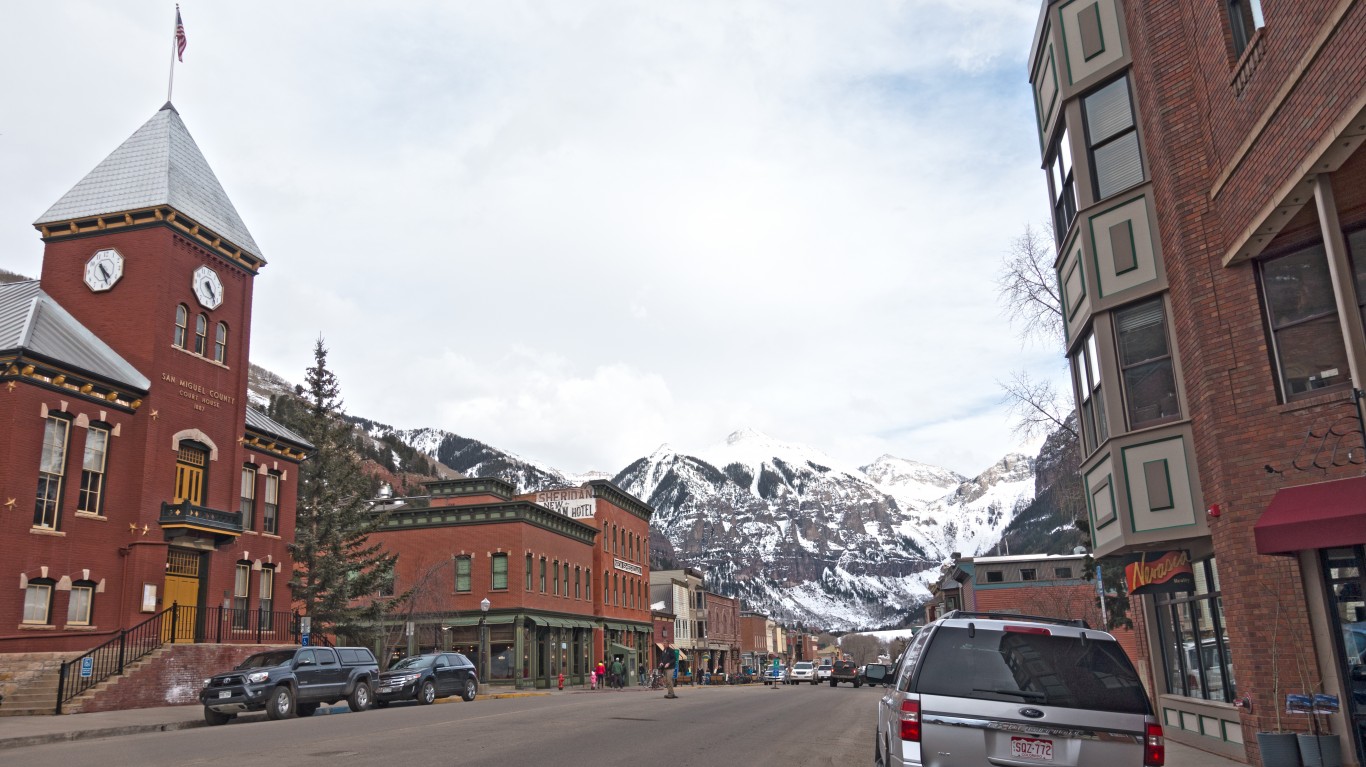
- Typical home price relative to income: 46.2 times higher than median income
- Median home list price in February 2025: $3,700,000 ($1,744 per square foot)
- Median household income: $80,117
- 1-year change in median list price: -9.8%
- Total number of listed homes in February 2025: 220