The U.S. economy has been hit by two major shocks in the last 20 years: the Great Recession and the COVID-19 pandemic. While stock indices and supply chains have largely recovered, these events have had significant implications for the current state of the American housing market.
In the wake of the Great Recession, which lasted from December 2007 to June 2009, home prices fell precipitously, bottoming out in February 2011 at 25% lower than the pre-recession high reported in July 2006, according to the Case-Shiller index. Plunging home values left millions of Americans hesitant to invest in a home and led to a sharp decline in the number of skilled laborers in the homebuilding sector. As a result, there were only 6.8 million new housing construction starts in the 2010s, down from 12.3 million in the 2000s, according to the National Association of Home Builders.
The reduced rate of new home construction created a housing shortage estimated at up to 4.7 million units. When limited housing supply met rising demand precipitated by the COVID-19 pandemic, list prices surged. According to the Case-Shiller index, home prices have risen by more than 55% since early 2020. Over roughly the same period, median wages among full-time workers increased by just 27%, according to the Bureau of Labor Statistics. Now, millions of Americans are priced out of the housing market.
The median list price of a home in the United States is now $425,000, which is 5.2 times higher than the national median household income of $81,604. For context, the median list price in the U.S. was only 3.5 times higher than the median household income just a decade ago. In certain local markets, the mismatch between incomes and home prices is even more pronounced.
Using data from the U.S. Census Bureau and Realtor.com, 24/7 Wall St. identified the least affordable housing market in each state. We reviewed incomes and list prices for more than 860 U.S. counties and county equivalents with available data and ranked them by their affordability ratio—the local median home list price divided by the local median household income. Income data are one-year estimates from the Census Bureau’s 2024 American Community Survey. Median list price data are from Realtor.com and are current as of September 2025. It is important to note that Vermont has only one county with available data. As a result, the listed county is included by default, not necessarily because it is less affordable than others.
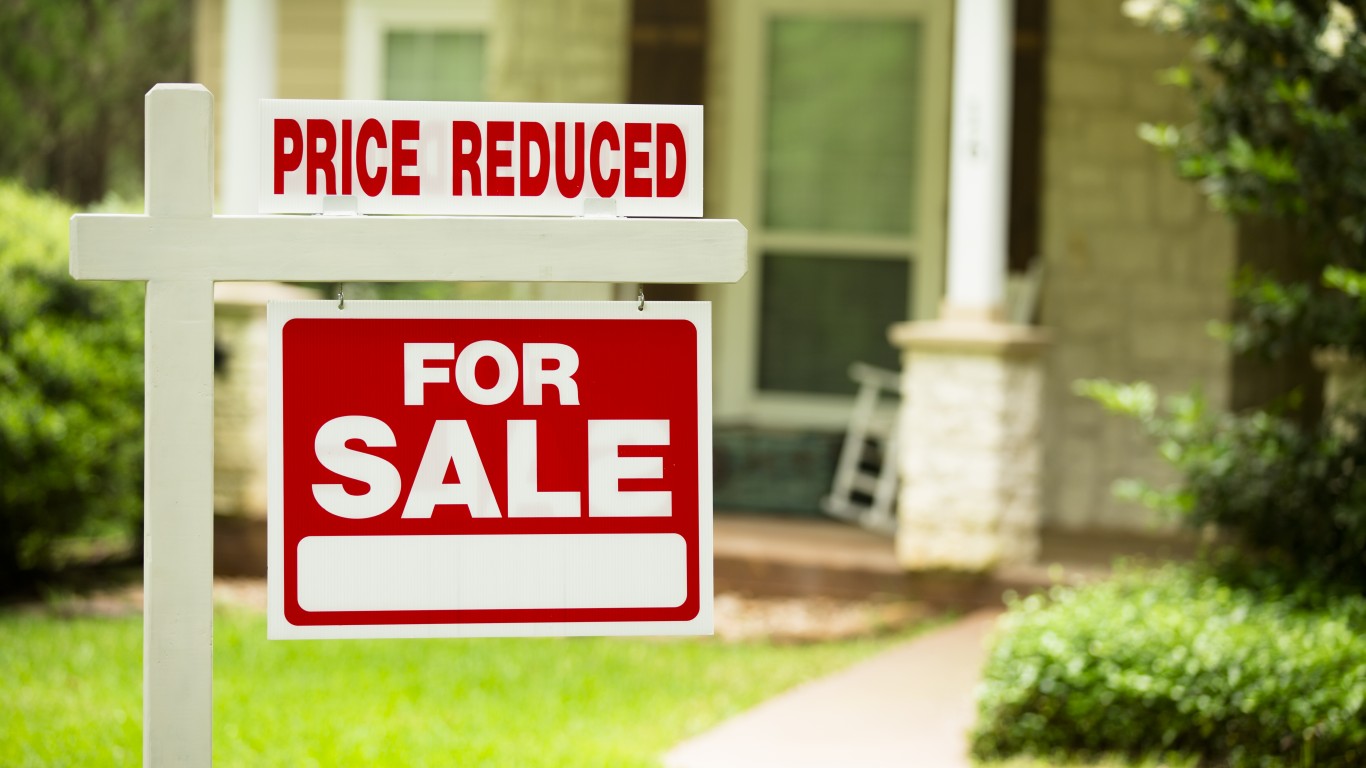
Among the 50 counties and county equivalents on this list, home prices range from 4.7 to 19.8 times the median household income. However, because 2024 income data is not yet available for every U.S. county, there is one state where the county identified as least affordable is actually more affordable than the state overall. Encouragingly, median list prices have fallen year-over-year in 18 counties on this list. Whether this trend will continue remains to be seen.
In many of these places, a lack of affordable housing is likely due in part to the types of homes being put up for sale. Within any given market, larger homes often command higher prices, and in most counties on this list, the typical listed home is larger than the typical listed home statewide.
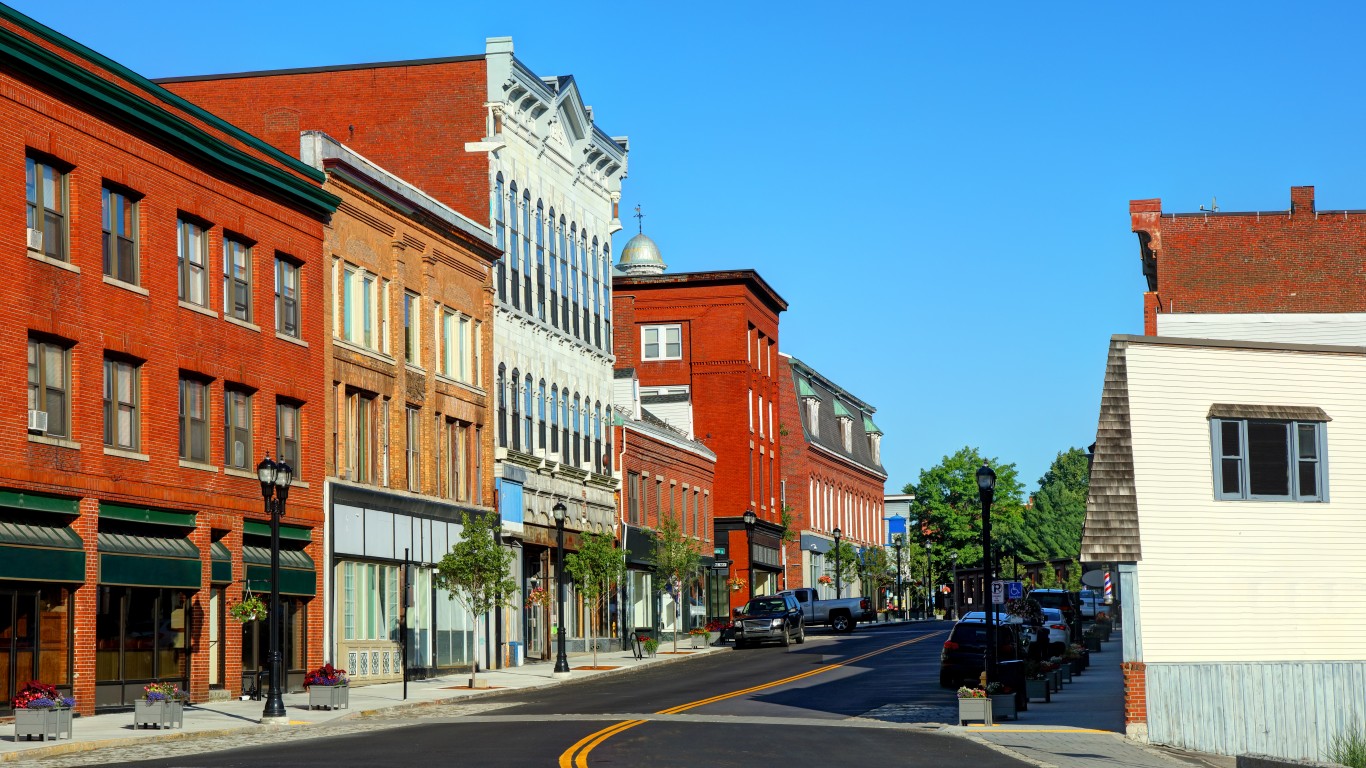
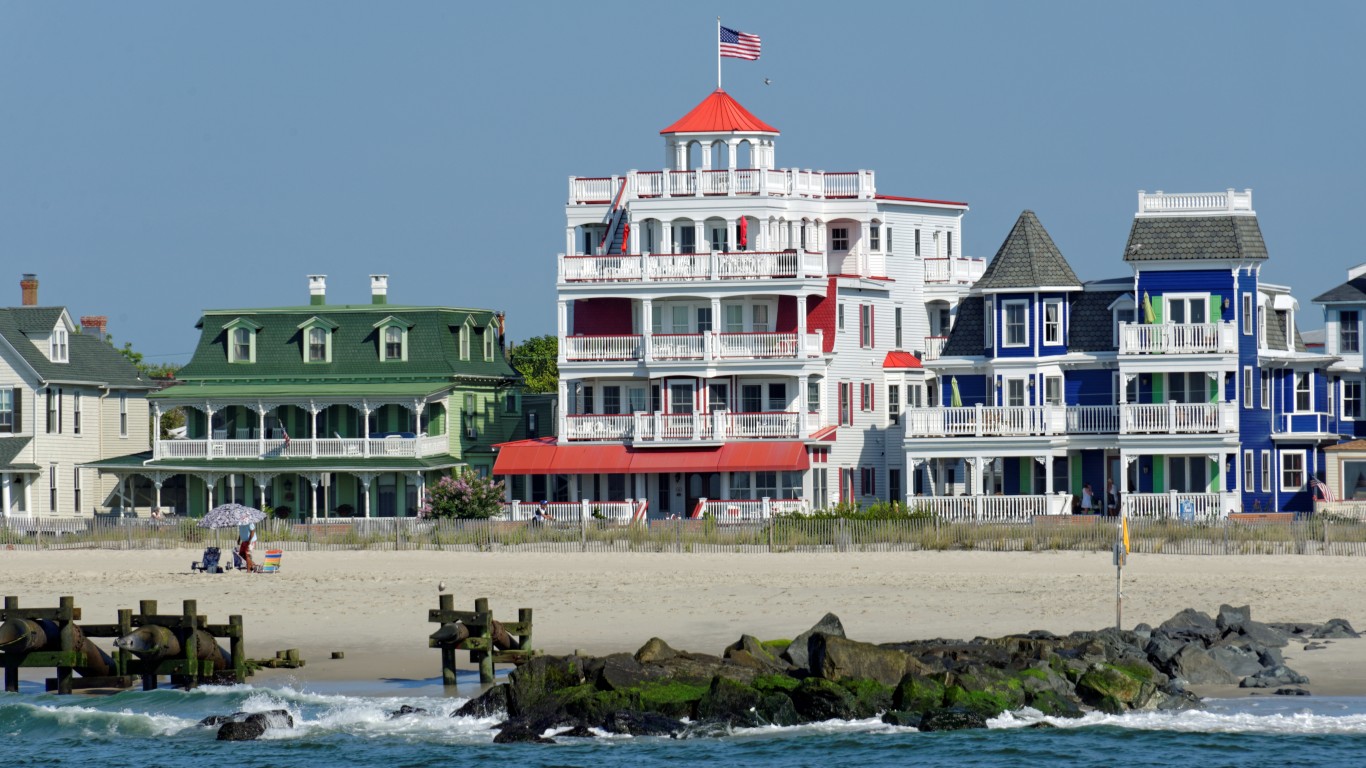
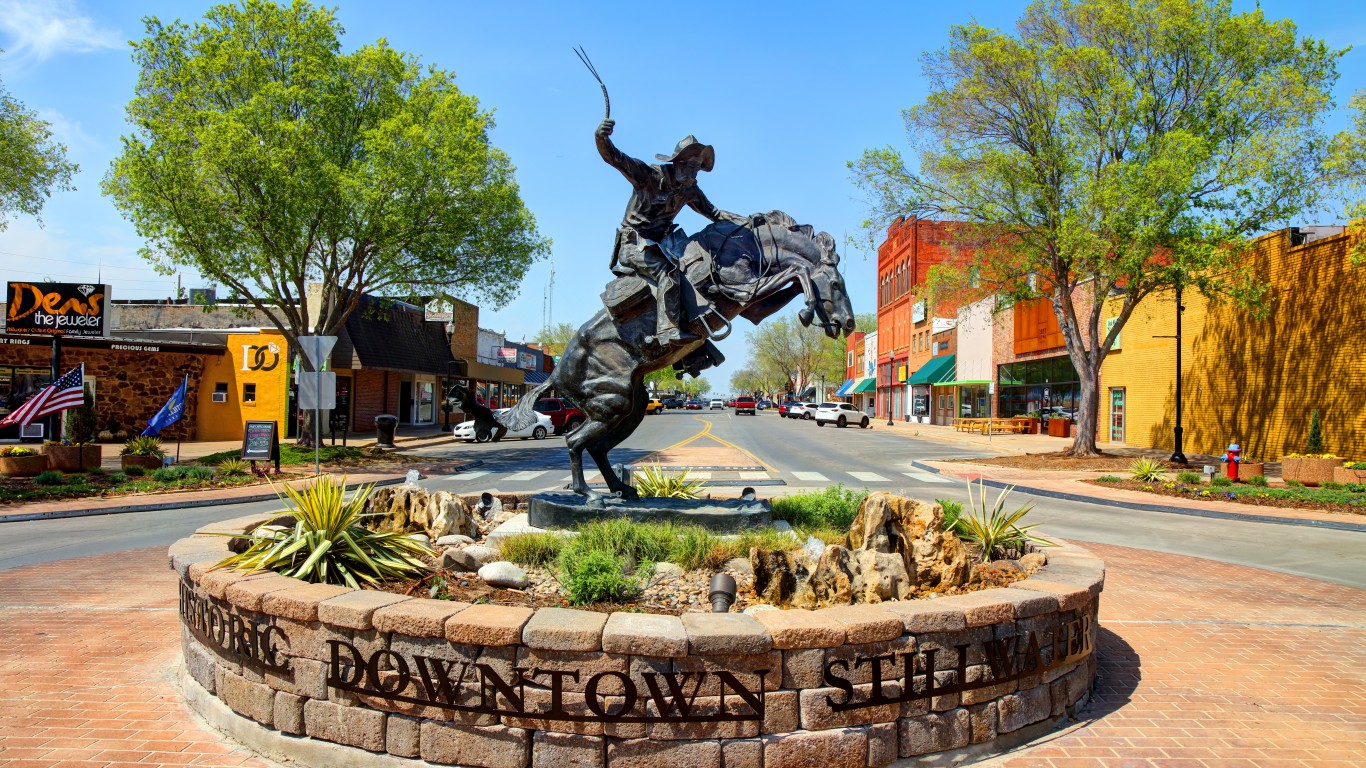
These are the least affordable housing markets in every state.
Why It Matters

Supply constraints and rising demand have given way to a housing affordability crisis in the United States. Even without considering historically high mortgage rates, the typical American home has a median list price that is over five times what the typical household earns in a year. Some parts of the country have been hit especially hard by the affordability crisis. In these places, home prices are much further removed from incomes than is common in most of the rest of the country.
Alabama: Baldwin County
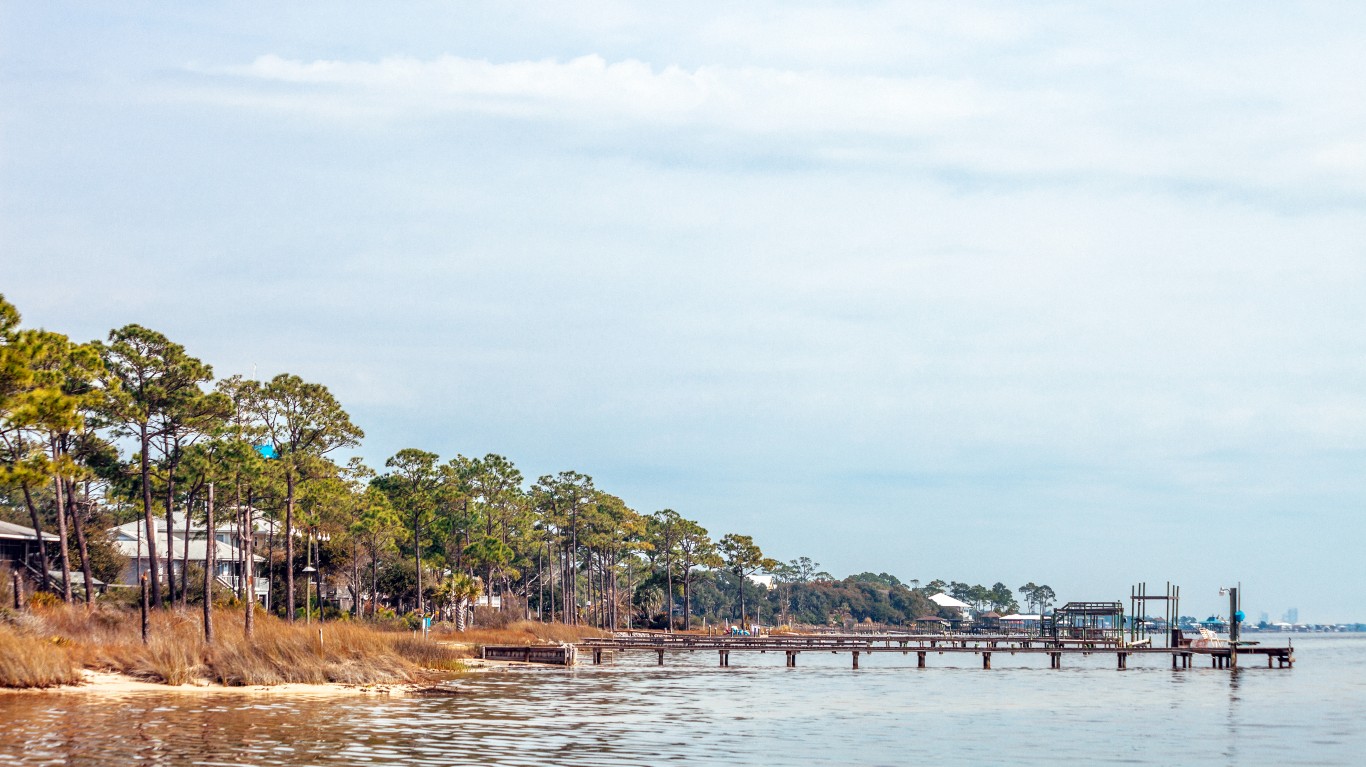
- Local list price to income ratio: 6.1-to-1 (statewide: 4.9-to-1)
- Local list price of a typical home: $500,702 (statewide: $329,950)
- Local median household income: $82,501 (statewide: $66,659)
- Typical size of a listed home: 1,773 sq. ft. (statewide: 1,937 sq. ft.)
- 1-yr. change in local median list price: -0.4% (statewide: +0.3%)
- Total number of listed homes in September 2025: 3,944 (13.8% of listed homes in state)
- No. of counties or county equivalents considered in state: 21
Alaska: Matanuska-Susitna Borough

- Local list price to income ratio: 4.9-to-1 (statewide: 4.7-to-1)
- Local list price of a typical home: $475,000 (statewide: $445,000)
- Local median household income: $96,643 (statewide: $95,665)
- Typical size of a listed home: 1,810 sq. ft. (statewide: 1,769 sq. ft.)
- 1-yr. change in local median list price: +5.6% (statewide: +4.7%)
- Total number of listed homes in September 2025: 829 (25.9% of listed homes in state)
- No. of counties or county equivalents considered in state: 3
Arizona: Apache County

- Local list price to income ratio: 13.2-to-1 (statewide: 5.8-to-1)
- Local list price of a typical home: $475,000 (statewide: $476,625)
- Local median household income: $35,903 (statewide: $81,486)
- Typical size of a listed home: 1,862 sq. ft. (statewide: 1,893 sq. ft.)
- 1-yr. change in local median list price: +15.8% (statewide: -4.0%)
- Total number of listed homes in September 2025: 208 (0.6% of listed homes in state)
- No. of counties or county equivalents considered in state: 10
Arkansas: Garland County

- Local list price to income ratio: 5.4-to-1 (statewide: 4.9-to-1)
- Local list price of a typical home: $325,000 (statewide: $304,950)
- Local median household income: $60,453 (statewide: $62,106)
- Typical size of a listed home: 1,800 sq. ft. (statewide: 1,867 sq. ft.)
- 1-yr. change in local median list price: -7.1% (statewide: +2.0%)
- Total number of listed homes in September 2025: 1,113 (6.4% of listed homes in state)
- No. of counties or county equivalents considered in state: 11
California: Santa Barbara County
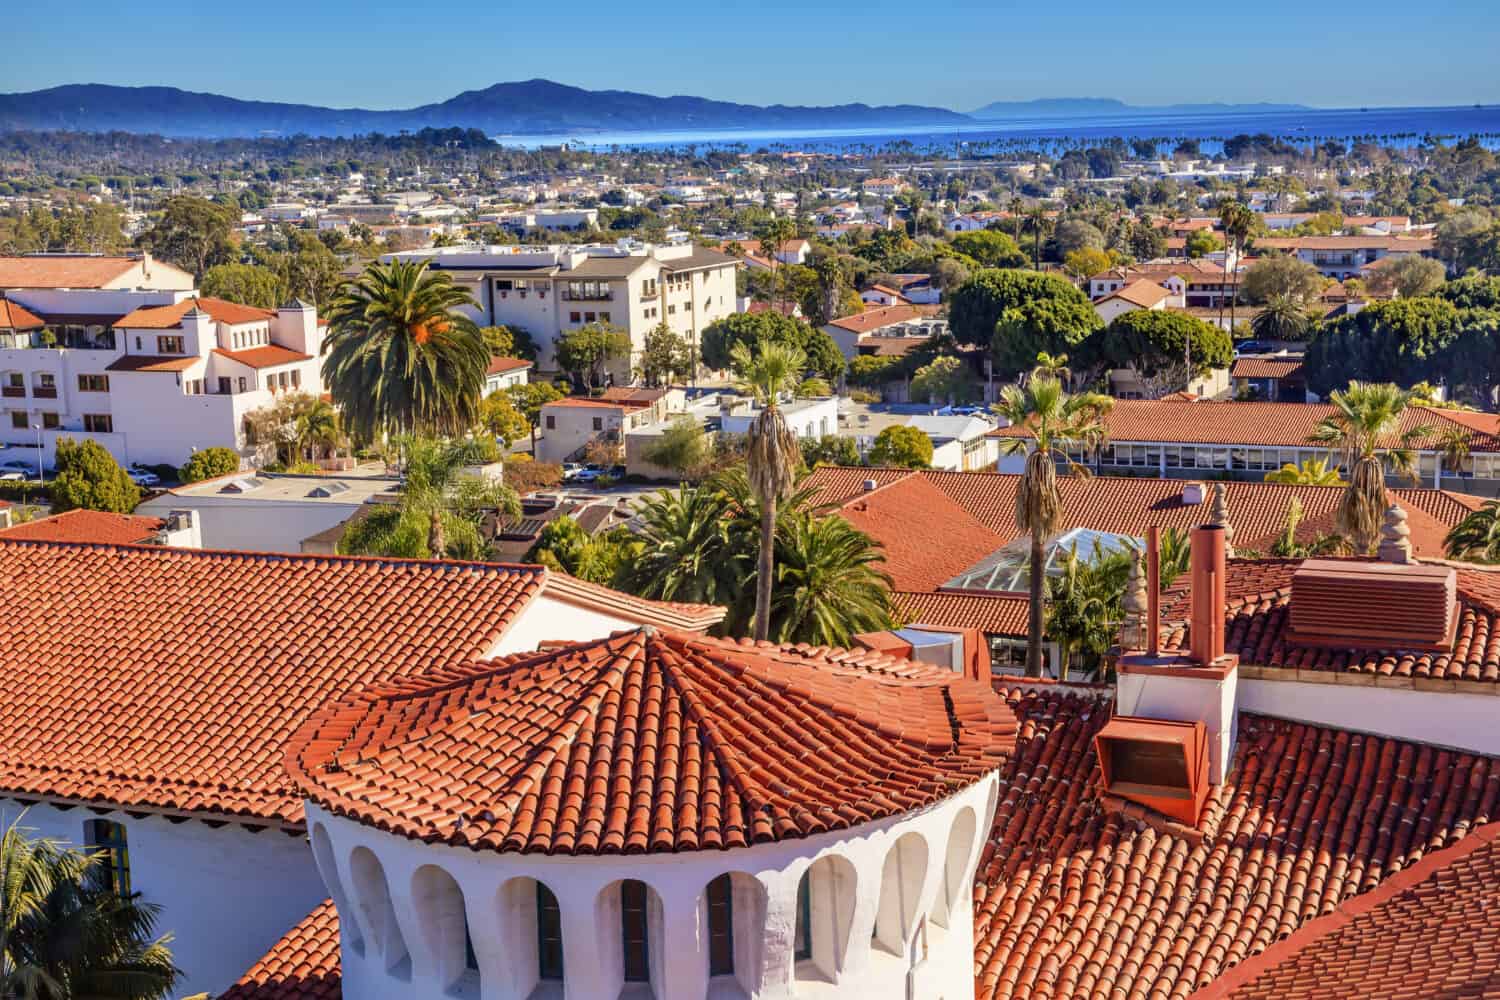
- Local list price to income ratio: 19.8-to-1 (statewide: 7.5-to-1)
- Local list price of a typical home: $1,892,500 (statewide: $748,500)
- Local median household income: $95,637 (statewide: $100,149)
- Typical size of a listed home: 2,077 sq. ft. (statewide: 1,751 sq. ft.)
- 1-yr. change in local median list price: -13.6% (statewide: -2.5%)
- Total number of listed homes in September 2025: 898 (0.9% of listed homes in state)
- No. of counties or county equivalents considered in state: 42
Colorado: Boulder County

- Local list price to income ratio: 7.9-to-1 (statewide: 6.0-to-1)
- Local list price of a typical home: $807,500 (statewide: $587,000)
- Local median household income: $102,697 (statewide: $97,113)
- Typical size of a listed home: 2,365 sq. ft. (statewide: 2,080 sq. ft.)
- 1-yr. change in local median list price: -0.6% (statewide: -2.1%)
- Total number of listed homes in September 2025: 1,805 (4.5% of listed homes in state)
- No. of counties or county equivalents considered in state: 12
Connecticut: Western Connecticut Planning Region

- Local list price to income ratio: 7.3-to-1 (statewide: 5.5-to-1)
- Local list price of a typical home: $962,000 (statewide: $525,225)
- Local median household income: $131,784 (statewide: $96,049)
- Typical size of a listed home: 2,637 sq. ft. (statewide: 1,949 sq. ft.)
- 1-yr. change in local median list price: -6.1% (statewide: +2.0%)
- Total number of listed homes in September 2025: 1,961 (19.1% of listed homes in state)
- No. of counties or county equivalents considered in state: 9
Delaware: Sussex County

- Local list price to income ratio: 6.5-to-1 (statewide: 5.5-to-1)
- Local list price of a typical home: $550,000 (statewide: $485,445)
- Local median household income: $85,258 (statewide: $87,534)
- Typical size of a listed home: 2,170 sq. ft. (statewide: 2,073 sq. ft.)
- 1-yr. change in local median list price: +0.0% (statewide: -0.6%)
- Total number of listed homes in September 2025: 2,594 (52.5% of listed homes in state)
- No. of counties or county equivalents considered in state: 3
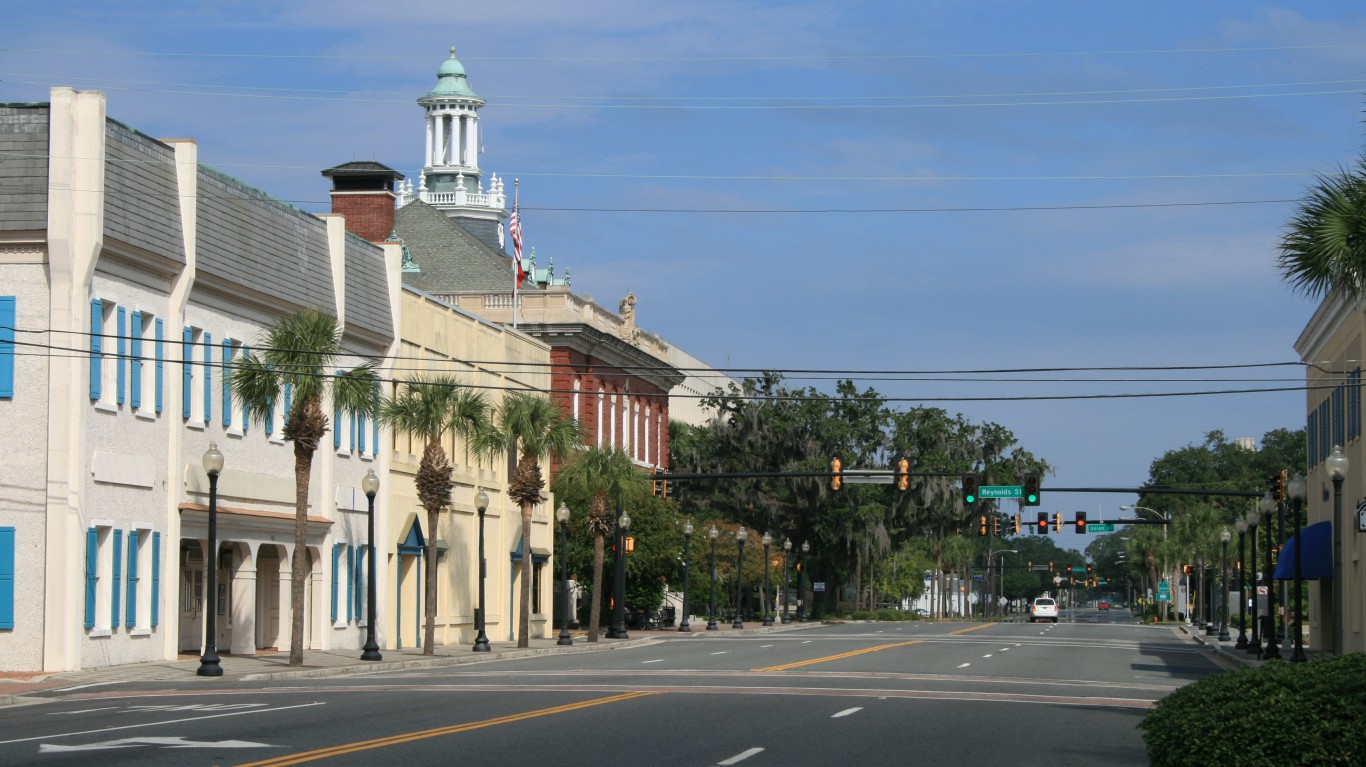
Florida: Monroe County

- Local list price to income ratio: 12.5-to-1 (statewide: 5.5-to-1)
- Local list price of a typical home: $1,250,000 (statewide: $425,000)
- Local median household income: $100,256 (statewide: $77,735)
- Typical size of a listed home: 1,521 sq. ft. (statewide: 1,623 sq. ft.)
- 1-yr. change in local median list price: +0.0% (statewide: -2.8%)
- Total number of listed homes in September 2025: 1,300 (0.6% of listed homes in state)
- No. of counties or county equivalents considered in state: 41
Georgia: Glynn County
- Local list price to income ratio: 7.6-to-1 (statewide: 4.9-to-1)
- Local list price of a typical home: $549,500 (statewide: $394,995)
- Local median household income: $72,269 (statewide: $79,991)
- Typical size of a listed home: 2,061 sq. ft. (statewide: 2,100 sq. ft.)
- 1-yr. change in local median list price: +11.3% (statewide: +0.0%)
- Total number of listed homes in September 2025: 843 (1.3% of listed homes in state)
- No. of counties or county equivalents considered in state: 39
Hawaii: Kauai County

- Local list price to income ratio: 14.2-to-1 (statewide: 7.4-to-1)
- Local list price of a typical home: $1,393,500 (statewide: $749,500)
- Local median household income: $98,128 (statewide: $100,745)
- Typical size of a listed home: 1,303 sq. ft. (statewide: 1,094 sq. ft.)
- 1-yr. change in local median list price: -5.5% (statewide: -6.3%)
- Total number of listed homes in September 2025: 447 (5.8% of listed homes in state)
- No. of counties or county equivalents considered in state: 4
Idaho: Kootenai County

- Local list price to income ratio: 9.4-to-1 (statewide: 7.2-to-1)
- Local list price of a typical home: $780,119 (statewide: $585,225)
- Local median household income: $83,061 (statewide: $81,166)
- Typical size of a listed home: 2,287 sq. ft. (statewide: 2,176 sq. ft.)
- 1-yr. change in local median list price: +4.0% (statewide: +2.2%)
- Total number of listed homes in September 2025: 1,661 (12.5% of listed homes in state)
- No. of counties or county equivalents considered in state: 6
Illinois: Champaign County

- Local list price to income ratio: 4.7-to-1 (statewide: 3.8-to-1)
- Local list price of a typical home: $295,950 (statewide: $316,500)
- Local median household income: $62,431 (statewide: $83,211)
- Typical size of a listed home: 1,736 sq. ft. (statewide: 1,700 sq. ft.)
- 1-yr. change in local median list price: +10.6% (statewide: -2.6%)
- Total number of listed homes in September 2025: 553 (1.5% of listed homes in state)
- No. of counties or county equivalents considered in state: 22
Indiana: Monroe County

- Local list price to income ratio: 5.7-to-1 (statewide: 4.2-to-1)
- Local list price of a typical home: $379,000 (statewide: $299,450)
- Local median household income: $66,965 (statewide: $71,959)
- Typical size of a listed home: 1,922 sq. ft. (statewide: 1,912 sq. ft.)
- 1-yr. change in local median list price: +1.9% (statewide: +1.5%)
- Total number of listed homes in September 2025: 648 (2.4% of listed homes in state)
- No. of counties or county equivalents considered in state: 27
Iowa: Story County

- Local list price to income ratio: 5.3-to-1 (statewide: 3.7-to-1)
- Local list price of a typical home: $350,000 (statewide: $279,000)
- Local median household income: $66,355 (statewide: $75,501)
- Typical size of a listed home: 1,576 sq. ft. (statewide: 1,617 sq. ft.)
- 1-yr. change in local median list price: +0.0% (statewide: -3.7%)
- Total number of listed homes in September 2025: 356 (2.2% of listed homes in state)
- No. of counties or county equivalents considered in state: 10
Kansas: Johnson County
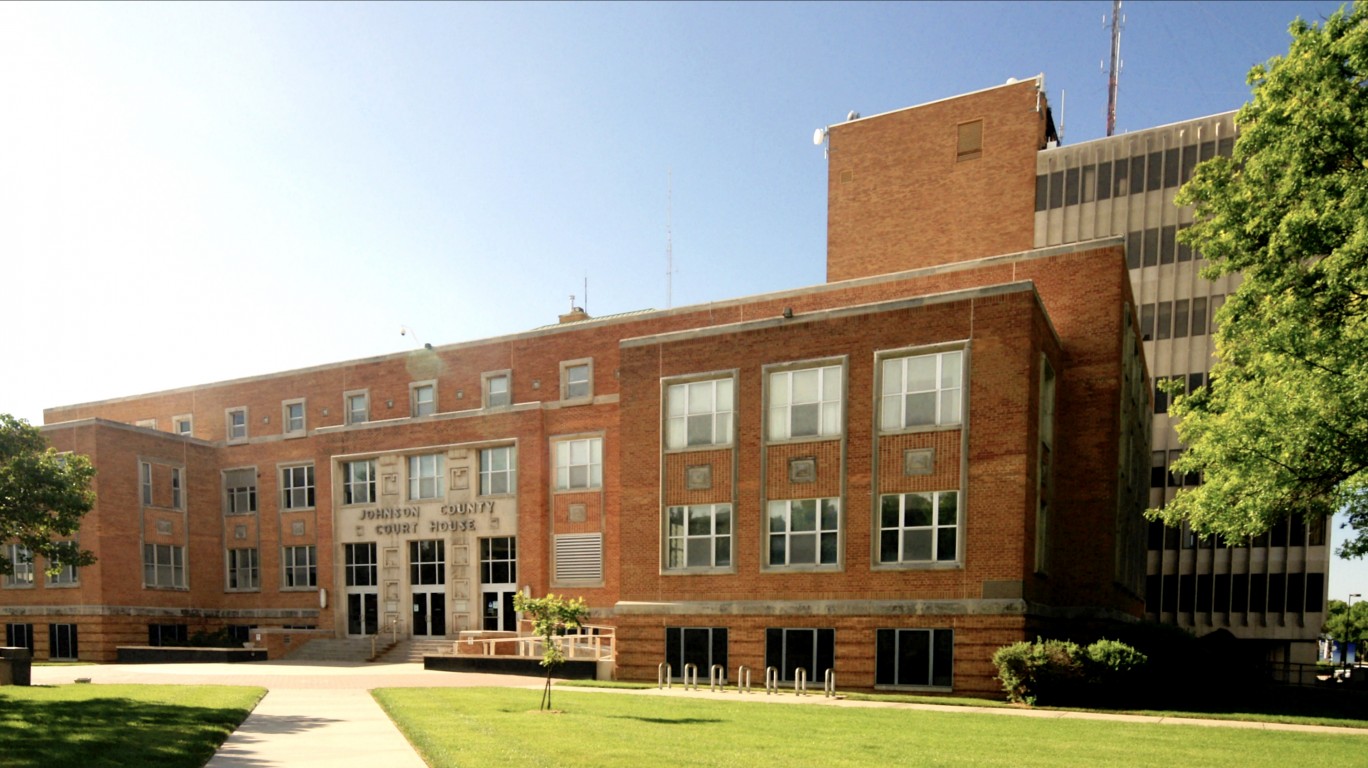
- Local list price to income ratio: 5.7-to-1 (statewide: 3.9-to-1)
- Local list price of a typical home: $619,975 (statewide: $295,000)
- Local median household income: $108,512 (statewide: $75,514)
- Typical size of a listed home: 2,749 sq. ft. (statewide: 2,013 sq. ft.)
- 1-yr. change in local median list price: +3.3% (statewide: -1.3%)
- Total number of listed homes in September 2025: 3,038 (24.9% of listed homes in state)
- No. of counties or county equivalents considered in state: 8
Kentucky: Pulaski County

- Local list price to income ratio: 5.5-to-1 (statewide: 4.8-to-1)
- Local list price of a typical home: $315,000 (statewide: $309,900)
- Local median household income: $56,911 (statewide: $64,526)
- Typical size of a listed home: 1,905 sq. ft. (statewide: 1,809 sq. ft.)
- 1-yr. change in local median list price: +3.5% (statewide: +3.3%)
- Total number of listed homes in September 2025: 421 (2.3% of listed homes in state)
- No. of counties or county equivalents considered in state: 14
Louisiana: Orleans Parish

- Local list price to income ratio: 5.6-to-1 (statewide: 4.6-to-1)
- Local list price of a typical home: $330,438 (statewide: $278,500)
- Local median household income: $58,821 (statewide: $60,986)
- Typical size of a listed home: 1,646 sq. ft. (statewide: 1,852 sq. ft.)
- 1-yr. change in local median list price: -5.4% (statewide: +1.3%)
- Total number of listed homes in September 2025: 2,198 (10.4% of listed homes in state)
- No. of counties or county equivalents considered in state: 17
Maine: York County
- Local list price to income ratio: 7.0-to-1 (statewide: 6.1-to-1)
- Local list price of a typical home: $649,000 (statewide: $467,000)
- Local median household income: $92,607 (statewide: $76,442)
- Typical size of a listed home: 1,696 sq. ft. (statewide: 1,701 sq. ft.)
- 1-yr. change in local median list price: +0.9% (statewide: +3.8%)
- Total number of listed homes in September 2025: 1,004 (15.2% of listed homes in state)
- No. of counties or county equivalents considered in state: 6
Maryland: Cecil County

- Local list price to income ratio: 5.2-to-1 (statewide: 4.3-to-1)
- Local list price of a typical home: $468,495 (statewide: $443,950)
- Local median household income: $90,199 (statewide: $102,905)
- Typical size of a listed home: 2,102 sq. ft. (statewide: 1,874 sq. ft.)
- 1-yr. change in local median list price: -3.8% (statewide: +3.9%)
- Total number of listed homes in September 2025: 336 (1.5% of listed homes in state)
- No. of counties or county equivalents considered in state: 16
Massachusetts: Barnstable County

- Local list price to income ratio: 10.5-to-1 (statewide: 7.2-to-1)
- Local list price of a typical home: $921,975 (statewide: $753,950)
- Local median household income: $87,925 (statewide: $104,828)
- Typical size of a listed home: 1,861 sq. ft. (statewide: 1,847 sq. ft.)
- 1-yr. change in local median list price: +2.5% (statewide: -3.3%)
- Total number of listed homes in September 2025: 1,818 (12.9% of listed homes in state)
- No. of counties or county equivalents considered in state: 12
Michigan: Grand Traverse County

- Local list price to income ratio: 6.3-to-1 (statewide: 4.1-to-1)
- Local list price of a typical home: $523,475 (statewide: $299,900)
- Local median household income: $82,468 (statewide: $72,389)
- Typical size of a listed home: 1,660 sq. ft. (statewide: 1,605 sq. ft.)
- 1-yr. change in local median list price: +12.9% (statewide: +1.0%)
- Total number of listed homes in September 2025: 625 (1.6% of listed homes in state)
- No. of counties or county equivalents considered in state: 31
Minnesota: Crow Wing County

- Local list price to income ratio: 5.9-to-1 (statewide: 4.5-to-1)
- Local list price of a typical home: $432,475 (statewide: $389,000)
- Local median household income: $73,307 (statewide: $87,117)
- Typical size of a listed home: 1,924 sq. ft. (statewide: 1,975 sq. ft.)
- 1-yr. change in local median list price: -4.1% (statewide: -0.9%)
- Total number of listed homes in September 2025: 549 (2.3% of listed homes in state)
- No. of counties or county equivalents considered in state: 16
Mississippi: Lee County

- Local list price to income ratio: 5.6-to-1 (statewide: 5.0-to-1)
- Local list price of a typical home: $316,325 (statewide: $296,500)
- Local median household income: $56,741 (statewide: $59,127)
- Typical size of a listed home: 2,269 sq. ft. (statewide: 1,978 sq. ft.)
- 1-yr. change in local median list price: +9.9% (statewide: -0.2%)
- Total number of listed homes in September 2025: 286 (2.4% of listed homes in state)
- No. of counties or county equivalents considered in state: 11
Missouri: Platte County

- Local list price to income ratio: 6.0-to-1 (statewide: 4.2-to-1)
- Local list price of a typical home: $526,531 (statewide: $302,450)
- Local median household income: $87,749 (statewide: $71,589)
- Typical size of a listed home: 2,680 sq. ft. (statewide: 1,748 sq. ft.)
- 1-yr. change in local median list price: +5.8% (statewide: +0.8%)
- Total number of listed homes in September 2025: 583 (2.0% of listed homes in state)
- No. of counties or county equivalents considered in state: 18
Montana: Flathead County

- Local list price to income ratio: 12.4-to-1 (statewide: 8.5-to-1)
- Local list price of a typical home: $932,875 (statewide: $637,000)
- Local median household income: $75,431 (statewide: $75,340)
- Typical size of a listed home: 2,325 sq. ft. (statewide: 2,146 sq. ft.)
- 1-yr. change in local median list price: +9.2% (statewide: -2.0%)
- Total number of listed homes in September 2025: 1,212 (15.7% of listed homes in state)
- No. of counties or county equivalents considered in state: 6
Nebraska: Lancaster County

- Local list price to income ratio: 5.3-to-1 (statewide: 4.5-to-1)
- Local list price of a typical home: $399,950 (statewide: $343,400)
- Local median household income: $75,165 (statewide: $76,376)
- Typical size of a listed home: 2,278 sq. ft. (statewide: 2,107 sq. ft.)
- 1-yr. change in local median list price: +3.5% (statewide: -0.5%)
- Total number of listed homes in September 2025: 1,421 (16.5% of listed homes in state)
- No. of counties or county equivalents considered in state: 3
Nevada: Washoe County

- Local list price to income ratio: 7.4-to-1 (statewide: 6.1-to-1)
- Local list price of a typical home: $674,250 (statewide: $496,889)
- Local median household income: $91,241 (statewide: $81,134)
- Typical size of a listed home: 2,023 sq. ft. (statewide: 1,831 sq. ft.)
- 1-yr. change in local median list price: +6.6% (statewide: -0.5%)
- Total number of listed homes in September 2025: 2,254 (13.2% of listed homes in state)
- No. of counties or county equivalents considered in state: 2
New Hampshire: Belknap County

- Local list price to income ratio: 7.6-to-1 (statewide: 5.9-to-1)
- Local list price of a typical home: $699,000 (statewide: $592,450)
- Local median household income: $91,559 (statewide: $99,782)
- Typical size of a listed home: 1,996 sq. ft. (statewide: 1,940 sq. ft.)
- 1-yr. change in local median list price: +10.6% (statewide: +3.0%)
- Total number of listed homes in September 2025: 509 (8.8% of listed homes in state)
- No. of counties or county equivalents considered in state: 7
New Jersey: Cape May County
- Local list price to income ratio: 8.4-to-1 (statewide: 5.3-to-1)
- Local list price of a typical home: $820,925 (statewide: $557,000)
- Local median household income: $97,249 (statewide: $104,294)
- Typical size of a listed home: 1,675 sq. ft. (statewide: 1,704 sq. ft.)
- 1-yr. change in local median list price: -8.7% (statewide: -4.0%)
- Total number of listed homes in September 2025: 1,400 (4.8% of listed homes in state)
- No. of counties or county equivalents considered in state: 21
New Mexico: Santa Fe County

- Local list price to income ratio: 9.3-to-1 (statewide: 5.9-to-1)
- Local list price of a typical home: $829,250 (statewide: $400,000)
- Local median household income: $88,719 (statewide: $67,816)
- Typical size of a listed home: 2,257 sq. ft. (statewide: 1,967 sq. ft.)
- 1-yr. change in local median list price: +5.0% (statewide: +0.4%)
- Total number of listed homes in September 2025: 1,089 (11.6% of listed homes in state)
- No. of counties or county equivalents considered in state: 9
New York: New York County

- Local list price to income ratio: 13.4-to-1 (statewide: 7.6-to-1)
- Local list price of a typical home: $1,425,000 (statewide: $649,450)
- Local median household income: $106,403 (statewide: $85,820)
- Typical size of a listed home: 1,252 sq. ft. (statewide: 1,584 sq. ft.)
- 1-yr. change in local median list price: -10.5% (statewide: -0.1%)
- Total number of listed homes in September 2025: 8,033 (11.9% of listed homes in state)
- No. of counties or county equivalents considered in state: 38
North Carolina: Chatham County

- Local list price to income ratio: 8.1-to-1 (statewide: 5.7-to-1)
- Local list price of a typical home: $817,500 (statewide: $419,450)
- Local median household income: $100,641 (statewide: $73,958)
- Typical size of a listed home: 3,162 sq. ft. (statewide: 1,967 sq. ft.)
- 1-yr. change in local median list price: -3.5% (statewide: +1.5%)
- Total number of listed homes in September 2025: 504 (0.8% of listed homes in state)
- No. of counties or county equivalents considered in state: 44
North Dakota: Grand Forks County

- Local list price to income ratio: 5.9-to-1 (statewide: 4.7-to-1)
- Local list price of a typical home: $393,650 (statewide: $364,425)
- Local median household income: $67,290 (statewide: $77,871)
- Typical size of a listed home: 2,210 sq. ft. (statewide: 2,186 sq. ft.)
- 1-yr. change in local median list price: +8.8% (statewide: -0.1%)
- Total number of listed homes in September 2025: 207 (6.4% of listed homes in state)
- No. of counties or county equivalents considered in state: 4
Ohio: Wood County
- Local list price to income ratio: 4.7-to-1 (statewide: 4.0-to-1)
- Local list price of a typical home: $349,950 (statewide: $286,500)
- Local median household income: $75,066 (statewide: $72,212)
- Typical size of a listed home: 1,990 sq. ft. (statewide: 1,750 sq. ft.)
- 1-yr. change in local median list price: +8.5% (statewide: +4.2%)
- Total number of listed homes in September 2025: 374 (1.0% of listed homes in state)
- No. of counties or county equivalents considered in state: 38
Oklahoma: Payne County
- Local list price to income ratio: 5.6-to-1 (statewide: 4.5-to-1)
- Local list price of a typical home: $292,500 (statewide: $299,250)
- Local median household income: $52,099 (statewide: $66,148)
- Typical size of a listed home: 1,858 sq. ft. (statewide: 1,860 sq. ft.)
- 1-yr. change in local median list price: +15.5% (statewide: +0.9%)
- Total number of listed homes in September 2025: 329 (1.5% of listed homes in state)
- No. of counties or county equivalents considered in state: 11
Oregon: Josephine County

- Local list price to income ratio: 8.4-to-1 (statewide: 6.6-to-1)
- Local list price of a typical home: $501,250 (statewide: $566,000)
- Local median household income: $59,711 (statewide: $85,220)
- Typical size of a listed home: 1,896 sq. ft. (statewide: 1,891 sq. ft.)
- 1-yr. change in local median list price: -0.2% (statewide: -1.1%)
- Total number of listed homes in September 2025: 593 (2.7% of listed homes in state)
- No. of counties or county equivalents considered in state: 15
Pennsylvania: Lebanon County

- Local list price to income ratio: 5.8-to-1 (statewide: 4.1-to-1)
- Local list price of a typical home: $422,100 (statewide: $320,000)
- Local median household income: $72,275 (statewide: $77,545)
- Typical size of a listed home: 1,823 sq. ft. (statewide: 1,711 sq. ft.)
- 1-yr. change in local median list price: +3.2% (statewide: +3.3%)
- Total number of listed homes in September 2025: 503 (1.2% of listed homes in state)
- No. of counties or county equivalents considered in state: 40
Rhode Island: Newport County

- Local list price to income ratio: 12.5-to-1 (statewide: 7.0-to-1)
- Local list price of a typical home: $1,250,000 (statewide: $584,142)
- Local median household income: $99,856 (statewide: $83,504)
- Typical size of a listed home: 2,389 sq. ft. (statewide: 1,906 sq. ft.)
- 1-yr. change in local median list price: +25.5% (statewide: +2.5%)
- Total number of listed homes in September 2025: 367 (11.9% of listed homes in state)
- No. of counties or county equivalents considered in state: 4
South Carolina: Charleston County

- Local list price to income ratio: 7.8-to-1 (statewide: 5.1-to-1)
- Local list price of a typical home: $730,000 (statewide: $368,500)
- Local median household income: $93,911 (statewide: $72,350)
- Typical size of a listed home: 1,953 sq. ft. (statewide: 1,846 sq. ft.)
- 1-yr. change in local median list price: -11.5% (statewide: +3.8%)
- Total number of listed homes in September 2025: 2,812 (7.5% of listed homes in state)
- No. of counties or county equivalents considered in state: 22
South Dakota: Pennington County

- Local list price to income ratio: 5.0-to-1 (statewide: 4.9-to-1)
- Local list price of a typical home: $394,975 (statewide: $373,350)
- Local median household income: $79,250 (statewide: $76,881)
- Typical size of a listed home: 1,874 sq. ft. (statewide: 1,892 sq. ft.)
- 1-yr. change in local median list price: -1.2% (statewide: -1.7%)
- Total number of listed homes in September 2025: 711 (15.4% of listed homes in state)
- No. of counties or county equivalents considered in state: 3
Tennessee: Sevier County

- Local list price to income ratio: 10.4-to-1 (statewide: 6.0-to-1)
- Local list price of a typical home: $641,725 (statewide: $429,900)
- Local median household income: $61,683 (statewide: $71,997)
- Typical size of a listed home: 1,919 sq. ft. (statewide: 1,992 sq. ft.)
- 1-yr. change in local median list price: -8.2% (statewide: +0.1%)
- Total number of listed homes in September 2025: 2,350 (5.1% of listed homes in state)
- No. of counties or county equivalents considered in state: 22
Texas: Starr County
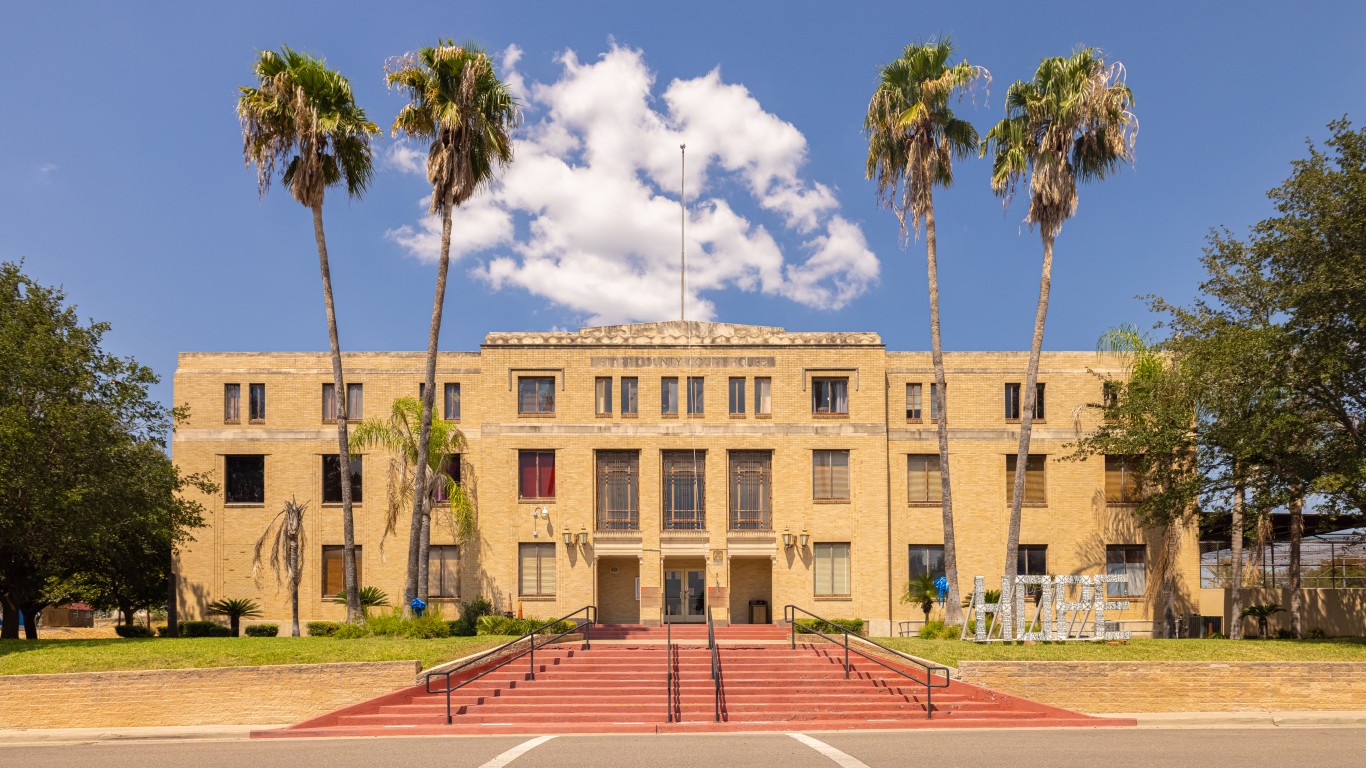
- Local list price to income ratio: 7.8-to-1 (statewide: 4.6-to-1)
- Local list price of a typical home: $250,700 (statewide: $364,950)
- Local median household income: $32,157 (statewide: $79,721)
- Typical size of a listed home: 1,823 sq. ft. (statewide: 2,000 sq. ft.)
- 1-yr. change in local median list price: +11.1% (statewide: -2.7%)
- Total number of listed homes in September 2025: 117 (0.1% of listed homes in state)
- No. of counties or county equivalents considered in state: 58
Utah: Washington County

- Local list price to income ratio: 7.1-to-1 (statewide: 6.1-to-1)
- Local list price of a typical home: $621,198 (statewide: $590,000)
- Local median household income: $86,983 (statewide: $96,658)
- Typical size of a listed home: 2,218 sq. ft. (statewide: 2,438 sq. ft.)
- 1-yr. change in local median list price: -5.9% (statewide: -1.7%)
- Total number of listed homes in September 2025: 2,365 (12.2% of listed homes in state)
- No. of counties or county equivalents considered in state: 8
Vermont: Chittenden County

- Local list price to income ratio: 6.5-to-1 (statewide: 6.1-to-1)
- Local list price of a typical home: $594,300 (statewide: $504,450)
- Local median household income: $91,144 (statewide: $82,730)
- Typical size of a listed home: 1,939 sq. ft. (statewide: 2,002 sq. ft.)
- 1-yr. change in local median list price: +2.0% (statewide: +1.1%)
- Total number of listed homes in September 2025: 634 (16.6% of listed homes in state)
- No. of counties or county equivalents considered in state: 1
Virginia: Albemarle County

- Local list price to income ratio: 7.1-to-1 (statewide: 4.9-to-1)
- Local list price of a typical home: $729,950 (statewide: $450,000)
- Local median household income: $102,262 (statewide: $92,090)
- Typical size of a listed home: 2,518 sq. ft. (statewide: 1,980 sq. ft.)
- 1-yr. change in local median list price: +7.6% (statewide: +2.3%)
- Total number of listed homes in September 2025: 693 (2.2% of listed homes in state)
- No. of counties or county equivalents considered in state: 30
Washington: Island County

- Local list price to income ratio: 8.6-to-1 (statewide: 6.5-to-1)
- Local list price of a typical home: $752,375 (statewide: $648,900)
- Local median household income: $87,695 (statewide: $99,389)
- Typical size of a listed home: 2,024 sq. ft. (statewide: 1,965 sq. ft.)
- 1-yr. change in local median list price: -8.2% (statewide: -0.2%)
- Total number of listed homes in September 2025: 549 (1.6% of listed homes in state)
- No. of counties or county equivalents considered in state: 20
West Virginia: Monongalia County
- Local list price to income ratio: 5.1-to-1 (statewide: 4.3-to-1)
- Local list price of a typical home: $342,475 (statewide: $261,500)
- Local median household income: $66,873 (statewide: $60,798)
- Typical size of a listed home: 2,047 sq. ft. (statewide: 1,764 sq. ft.)
- 1-yr. change in local median list price: +3.5% (statewide: +9.0%)
- Total number of listed homes in September 2025: 346 (5.2% of listed homes in state)
- No. of counties or county equivalents considered in state: 7
Wisconsin: Brown County

- Local list price to income ratio: 6.4-to-1 (statewide: 5.1-to-1)
- Local list price of a typical home: $515,925 (statewide: $392,325)
- Local median household income: $80,463 (statewide: $77,488)
- Typical size of a listed home: 2,224 sq. ft. (statewide: 1,804 sq. ft.)
- 1-yr. change in local median list price: +10.0% (statewide: +2.6%)
- Total number of listed homes in September 2025: 813 (4.3% of listed homes in state)
- No. of counties or county equivalents considered in state: 25
Wyoming: Laramie County
.jpg "CheyenneWyoming by Vasiliymeshko")
- Local list price to income ratio: 6.0-to-1 (statewide: 6.3-to-1)
- Local list price of a typical home: $499,450 (statewide: $472,500)
- Local median household income: $83,258 (statewide: $75,532)
- Typical size of a listed home: 2,668 sq. ft. (statewide: 2,204 sq. ft.)
- 1-yr. change in local median list price: +9.1% (statewide: -1.5%)
- Total number of listed homes in September 2025: 558 (16.3% of listed homes in state)
- No. of counties or county equivalents considered in state: 2