24/7 Wall St. Insights
- Roughly 1.4 million Michiganders fall below the poverty line.
- Among the 35 places on this list, poverty rates range from 18.8% to 44.2%.
- Also, Discover “The Next NVIDIA”
The United States is known for its wealth, ranking at the top globally in terms of economy size. Owning a car and a home in America is commonplace, and luxurious like travel and dinners out on the town are part of everyday life for many. The average U.S. citizen’s income was $59,428 in 2023, with However, there is a wide range of income across states, with some regions seeing more poverty than others. While Massachusetts has the highest average income of $76,600. Mississippi has the lowest at $45,180. In addition to MS, the poorest earning states are Arkansas and West Virginia. Nationally, the poverty rate was at 11.5% in 2022.
In most of the country, including Michigan, the U.S. Department of Health and Human Services sets the poverty line at an annual income of $15,060 for individuals and $31,200 for a family of four. Out of the 50 U.S states, Michigan ranks 34th in terms of earnings. Roughly 1.4 million Michiganders fall below the poverty line. As a whole, the state had an unemployment rate of 4.1% in June 2024, which is up from the 3.7% in June 2023. Oscoda County struggles the most with unemployment-related poverty, with 7.9% of residents without a job.
The effects of poverty extend far beyond economics, with many low-income individuals experiencing mental health issues. According to the latest Pulse Survey from the U.S. Census Bureau, 38% of American adults earning less than $25,000 reported feeling depressed or hopeless on most days, compared to just 17% of all adults. Additionally, 27% of adults in the lowest income bracket reported not having enough to eat within the last week, three times the food insufficiency rate among all adults.
Using five-year estimates from the Census’ 2022 American Community Survey, 24/7 Wall St. identified the towns in Michigan with the highest poverty rates. We considered all places — including cities, towns, and unincorporated communities — with populations between 5,000 and 50,000. Because the presence of colleges and universities can distort economic realities in a given area, places where 20% or more of the population are enrolled in a post-secondary institution were excluded from analysis.
Among the 35 places on this list, poverty rates range from 18.8% to 44.2%, and in each of these places, the typical household earns less than the statewide median household income of $68,505.
Widespread financial hardship in these areas is partially attributable to a lack of economic opportunity. In most places on this list, the five-year average unemployment rate is higher than the comparable 6.0% jobless rate across Michigan.
Incomes and job security tend to rise with educational attainment. According to the Bureau of Labor Statistics, the typical worker with a bachelor’s degree earns 66% more than those with no more than a high school diploma. Additionally, workers with only a high school education are far more likely to be unemployed than college graduates. In every town on this list, the share of adults with a bachelor’s degree is below the 31.1% statewide bachelor’s degree attainment rate.
Why It Matters

The United States is, in many ways, the center of gravity of the global economy. The U.S. dollar has been the world’s leading reserve currency since the end of World War II, and American gross domestic product accounts for over a quarter of economic activity worldwide. Despite these advantages, more than one in every 10 Americans have been living below the poverty line for decades. For those facing serious financial hardship, the effects are far reaching. Poverty can negatively impact mental health, social relationships, and life expectancy.
35. Sturgis
- Poverty rate: 18.8%
- Median household income: $56,337
- 5-yr. avg. unemployment rate: 6.5%
- Adults with a bachelor’s degree or higher: 14.9%
- Population: 11,050
34. Escanaba
- Poverty rate: 19.0%
- Median household income: $38,457
- 5-yr. avg. unemployment rate: 7.2%
- Adults with a bachelor’s degree or higher: 19.3%
- Population: 12,403
33. Cadillac

- Poverty rate: 19.7%
- Median household income: $45,123
- 5-yr. avg. unemployment rate: 7.0%
- Adults with a bachelor’s degree or higher: 18.6%
- Population: 10,400
32. Lincoln Park

- Poverty rate: 19.8%
- Median household income: $55,777
- 5-yr. avg. unemployment rate: 6.9%
- Adults with a bachelor’s degree or higher: 11.1%
- Population: 39,807
31. Harper Woods

- Poverty rate: 20.0%
- Median household income: $60,030
- 5-yr. avg. unemployment rate: 7.6%
- Adults with a bachelor’s degree or higher: 26.4%
- Population: 15,296
30. Ludington
- Poverty rate: 20.2%
- Median household income: $49,503
- 5-yr. avg. unemployment rate: 4.1%
- Adults with a bachelor’s degree or higher: 27.2%
- Population: 7,691
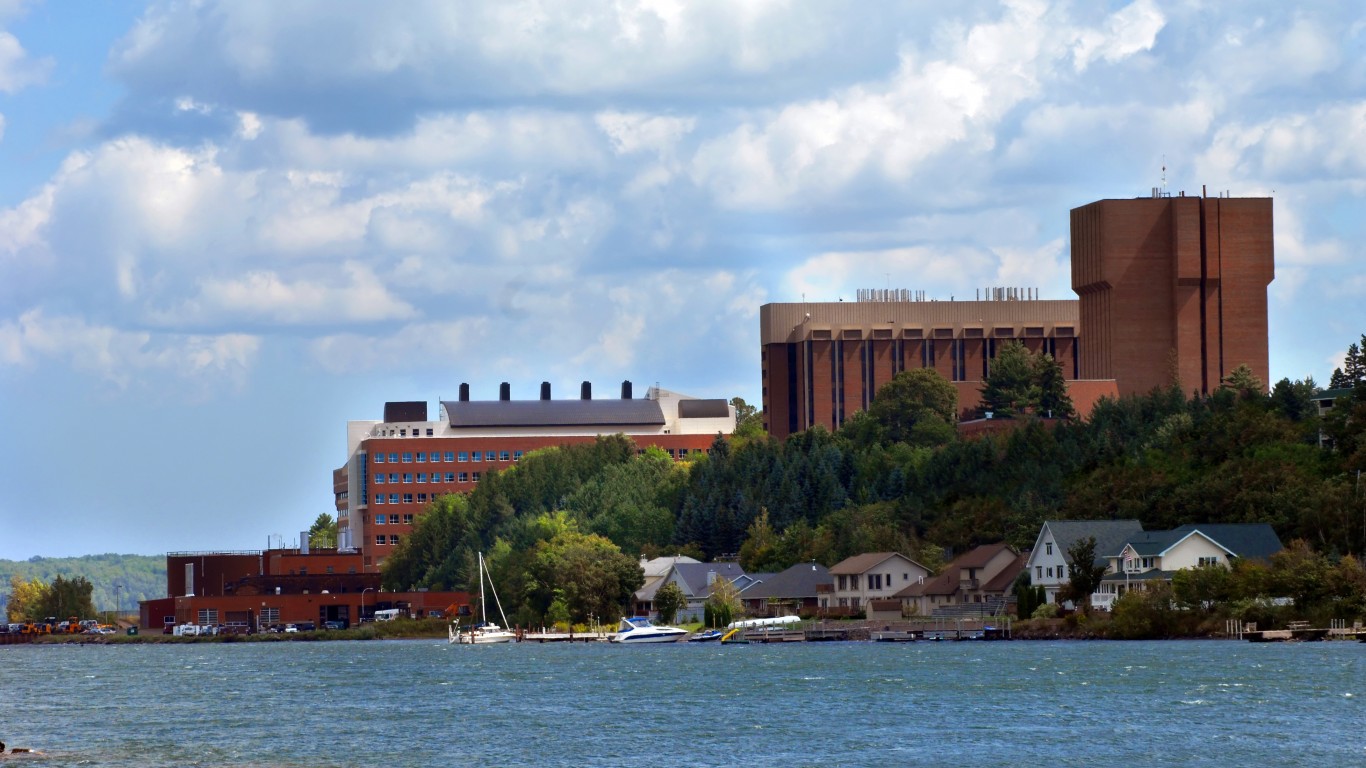
29. Sault Ste. Marie
- Poverty rate: 20.8%
- Median household income: $50,284
- 5-yr. avg. unemployment rate: 7.4%
- Adults with a bachelor’s degree or higher: 25.9%
- Population: 13,409
28. Alpena

- Poverty rate: 20.9%
- Median household income: $43,613
- 5-yr. avg. unemployment rate: 8.8%
- Adults with a bachelor’s degree or higher: 13.5%
- Population: 10,200
27. Hillsdale

- Poverty rate: 21.2%
- Median household income: $47,205
- 5-yr. avg. unemployment rate: 3.6%
- Adults with a bachelor’s degree or higher: 23.2%
- Population: 8,005
26. New Haven
- Poverty rate: 21.6%
- Median household income: $63,424
- 5-yr. avg. unemployment rate: 7.6%
- Adults with a bachelor’s degree or higher: 22.0%
- Population: 6,200
25. Coldwater
- Poverty rate: 21.7%
- Median household income: $48,531
- 5-yr. avg. unemployment rate: 3.8%
- Adults with a bachelor’s degree or higher: 12.2%
- Population: 13,704
24. Niles

- Poverty rate: 21.7%
- Median household income: $42,181
- 5-yr. avg. unemployment rate: 12.0%
- Adults with a bachelor’s degree or higher: 17.0%
- Population: 11,871
23. Alma
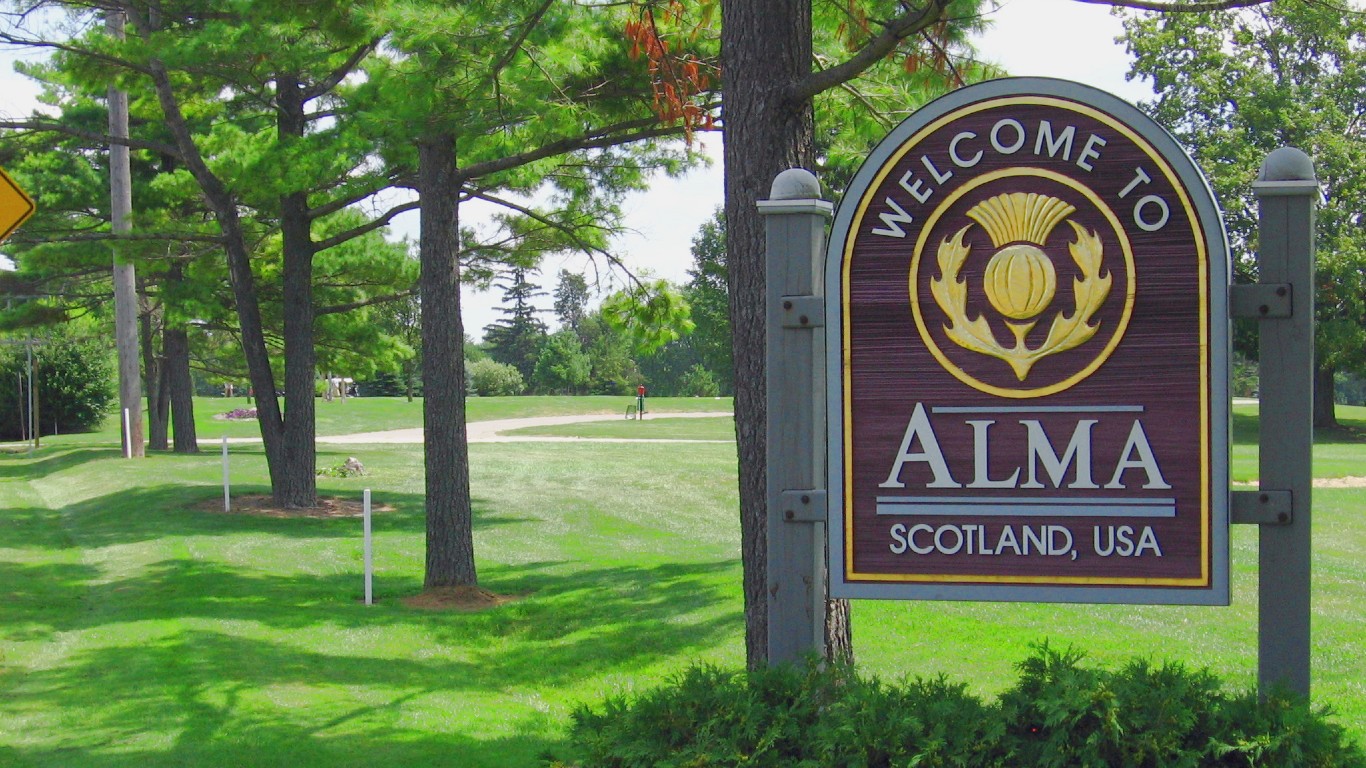
- Poverty rate: 21.8%
- Median household income: $44,375
- 5-yr. avg. unemployment rate: 7.1%
- Adults with a bachelor’s degree or higher: 24.7%
- Population: 9,436
22. Port Huron
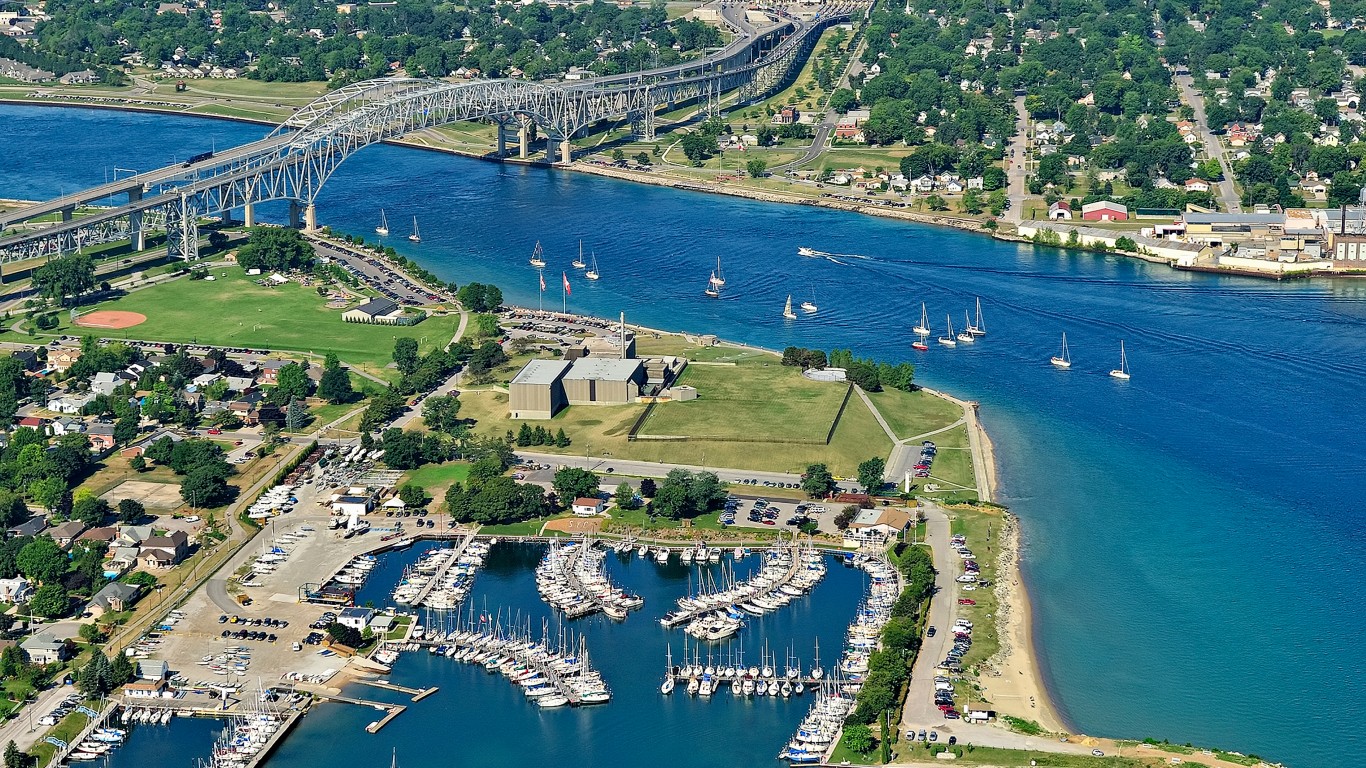
- Poverty rate: 22.2%
- Median household income: $47,906
- 5-yr. avg. unemployment rate: 9.3%
- Adults with a bachelor’s degree or higher: 18.5%
- Population: 28,881
21. Bridgeport

- Poverty rate: 22.5%
- Median household income: $42,719
- 5-yr. avg. unemployment rate: 5.3%
- Adults with a bachelor’s degree or higher: 11.1%
- Population: 6,495
20. Muskegon
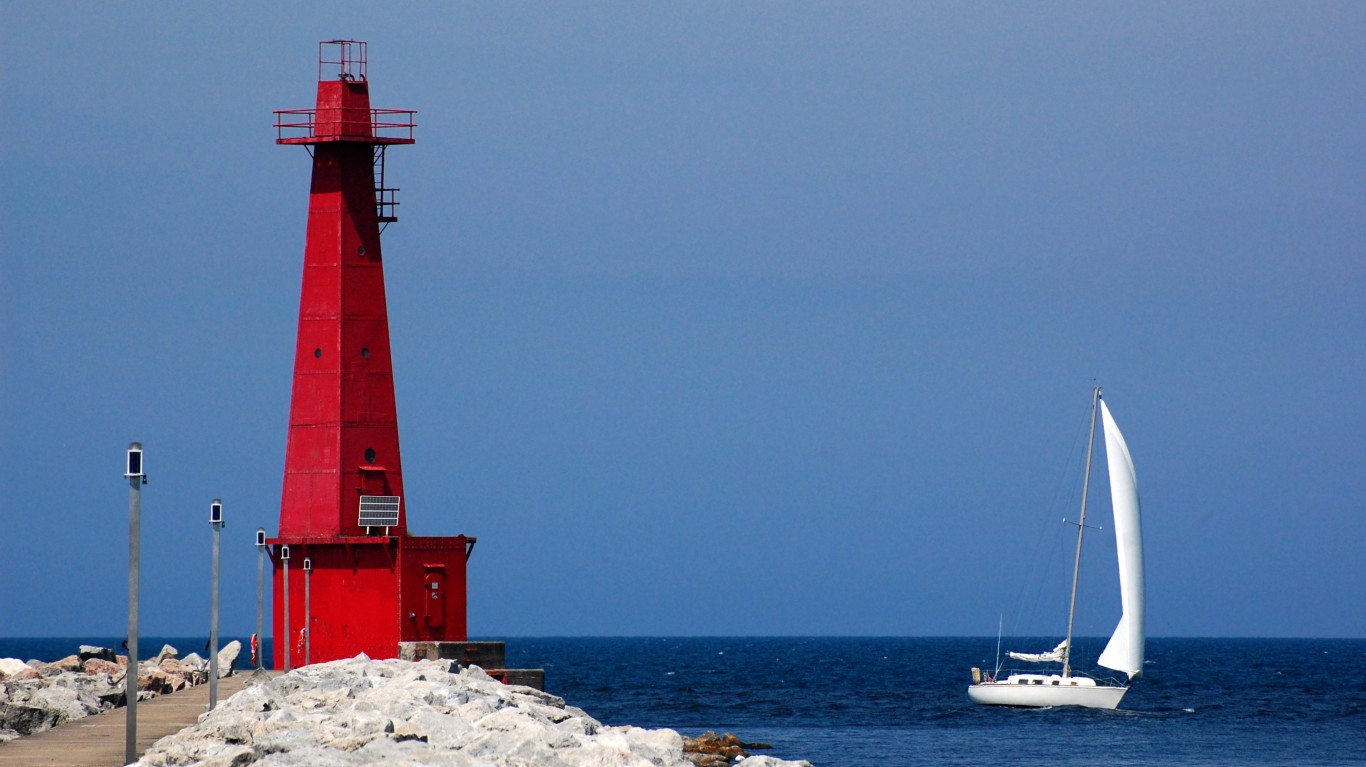
- Poverty rate: 22.9%
- Median household income: $40,900
- 5-yr. avg. unemployment rate: 10.4%
- Adults with a bachelor’s degree or higher: 14.4%
- Population: 38,286
19. Adrian
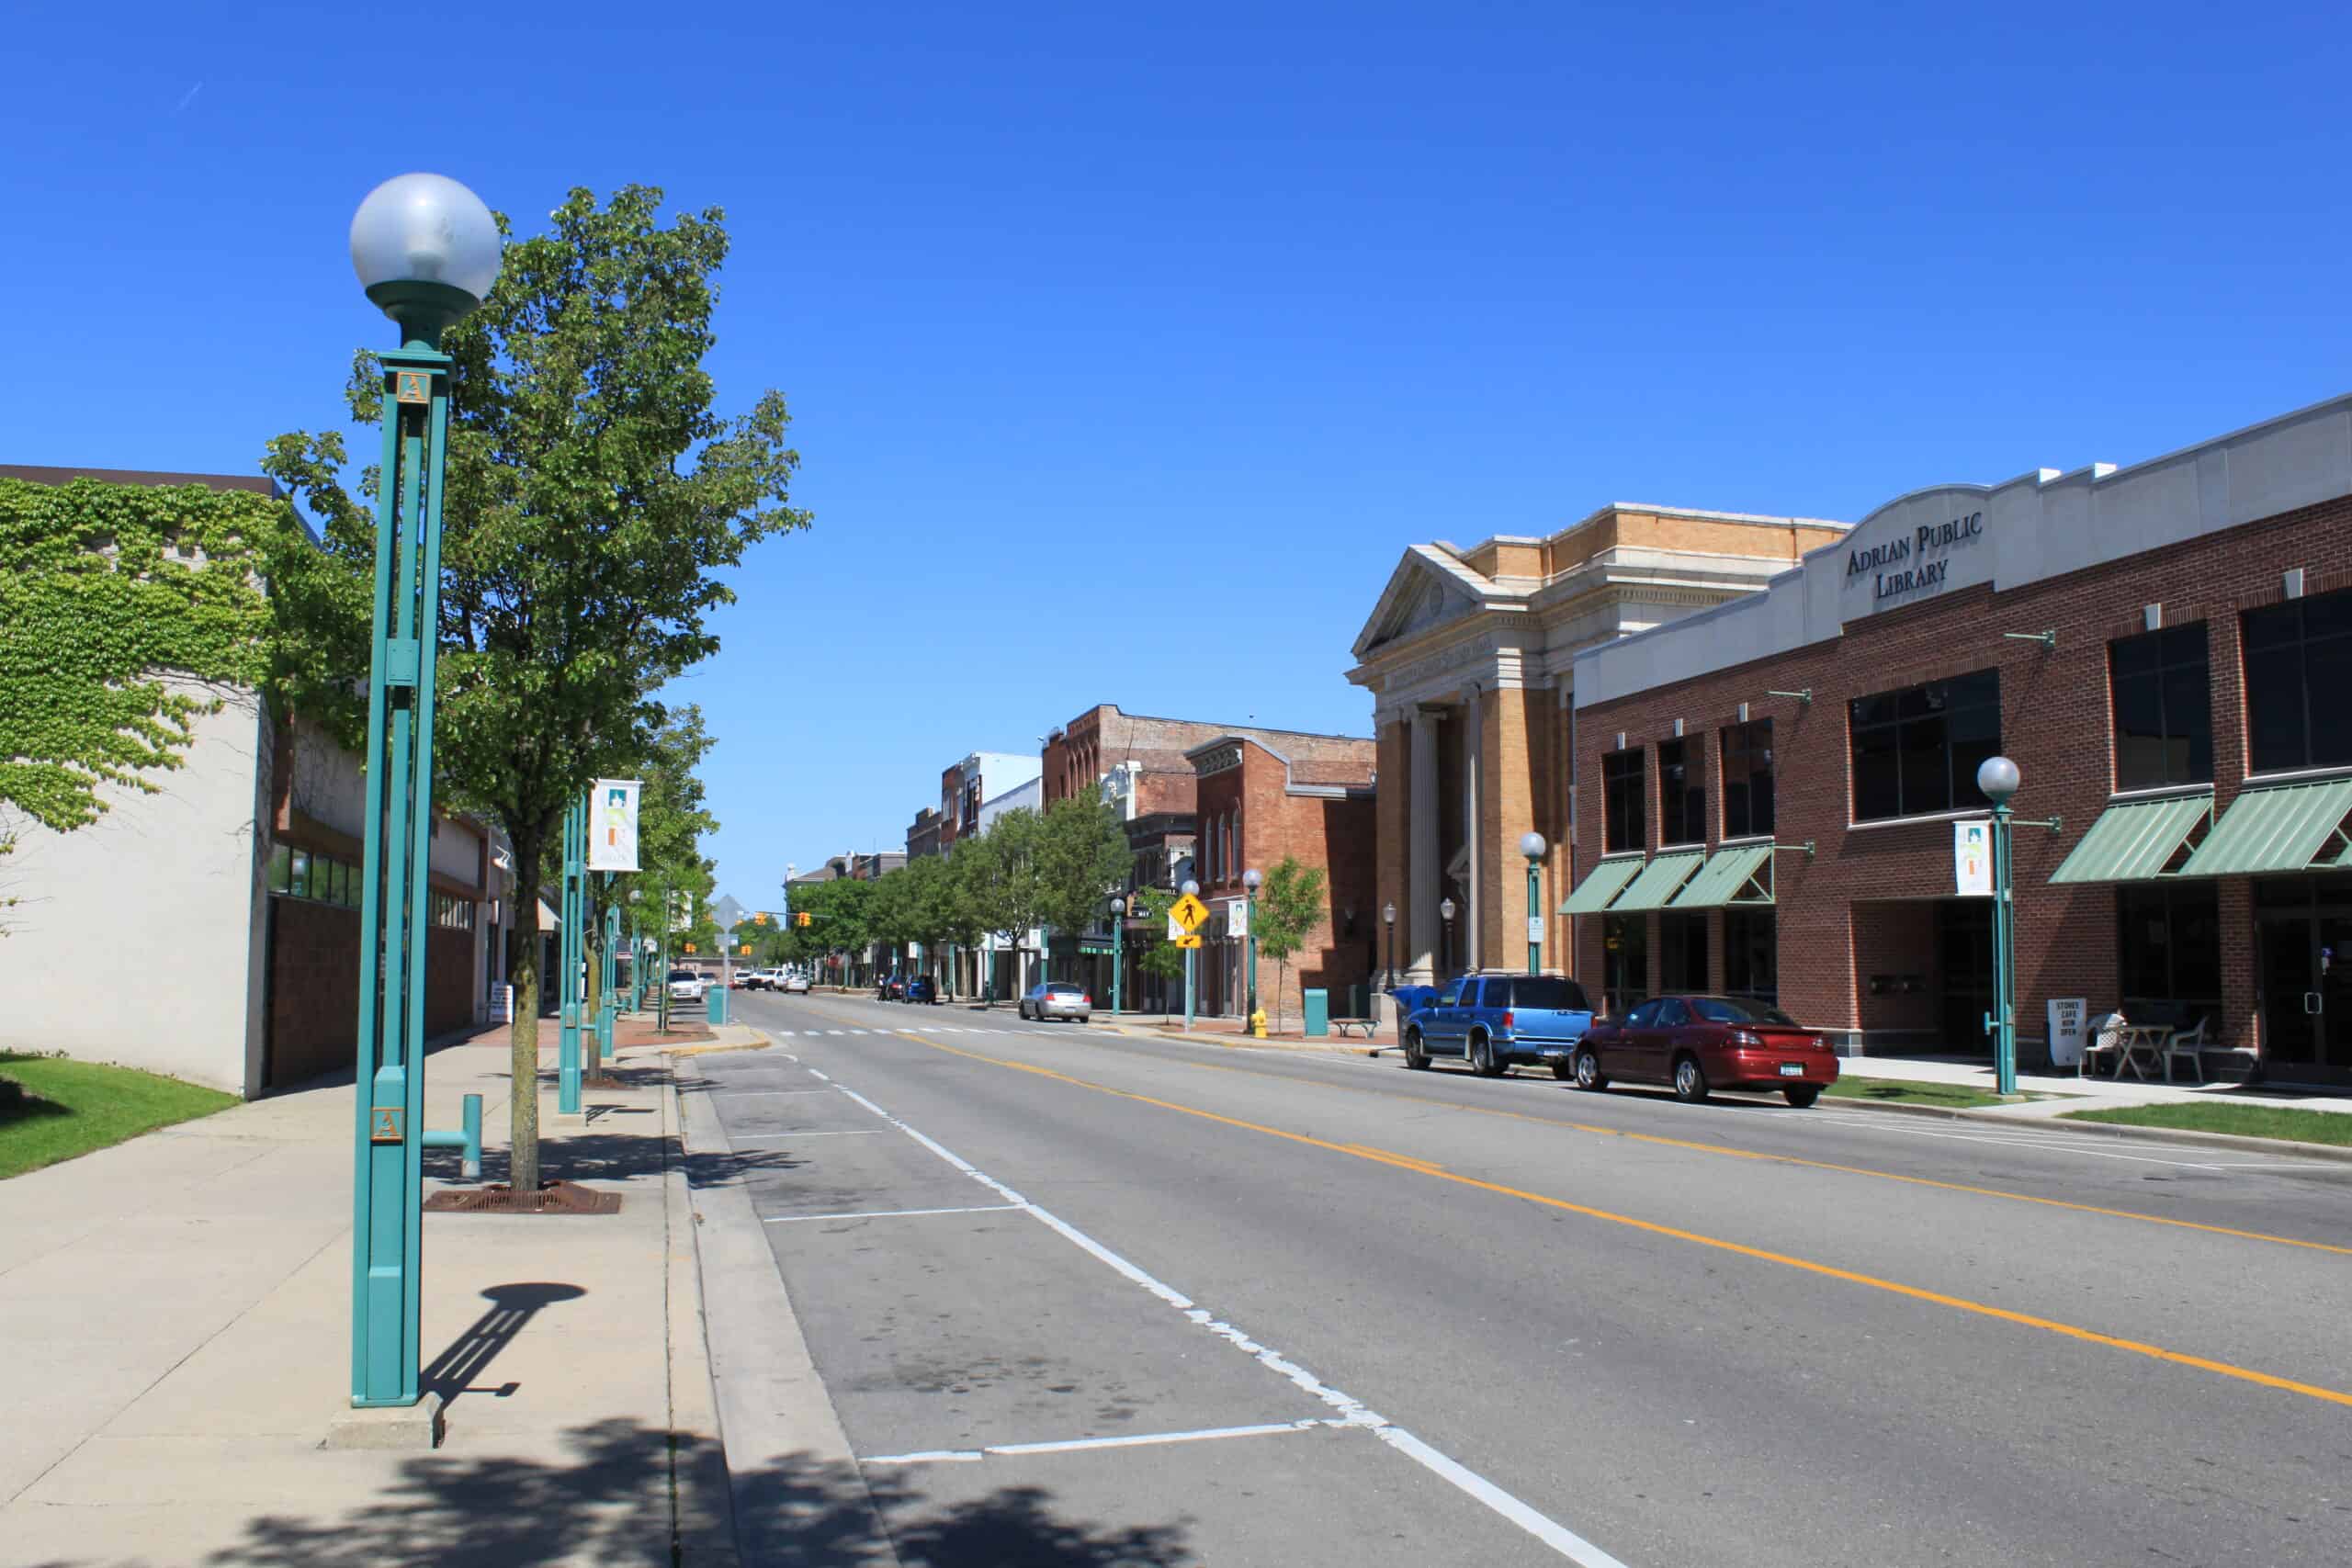
- Poverty rate: 23.4%
- Median household income: $40,797
- 5-yr. avg. unemployment rate: 4.8%
- Adults with a bachelor’s degree or higher: 20.3%
- Population: 20,607
18. Lapeer

- Poverty rate: 24.0%
- Median household income: $50,510
- 5-yr. avg. unemployment rate: 4.3%
- Adults with a bachelor’s degree or higher: 14.3%
- Population: 9,034
17. Jackson
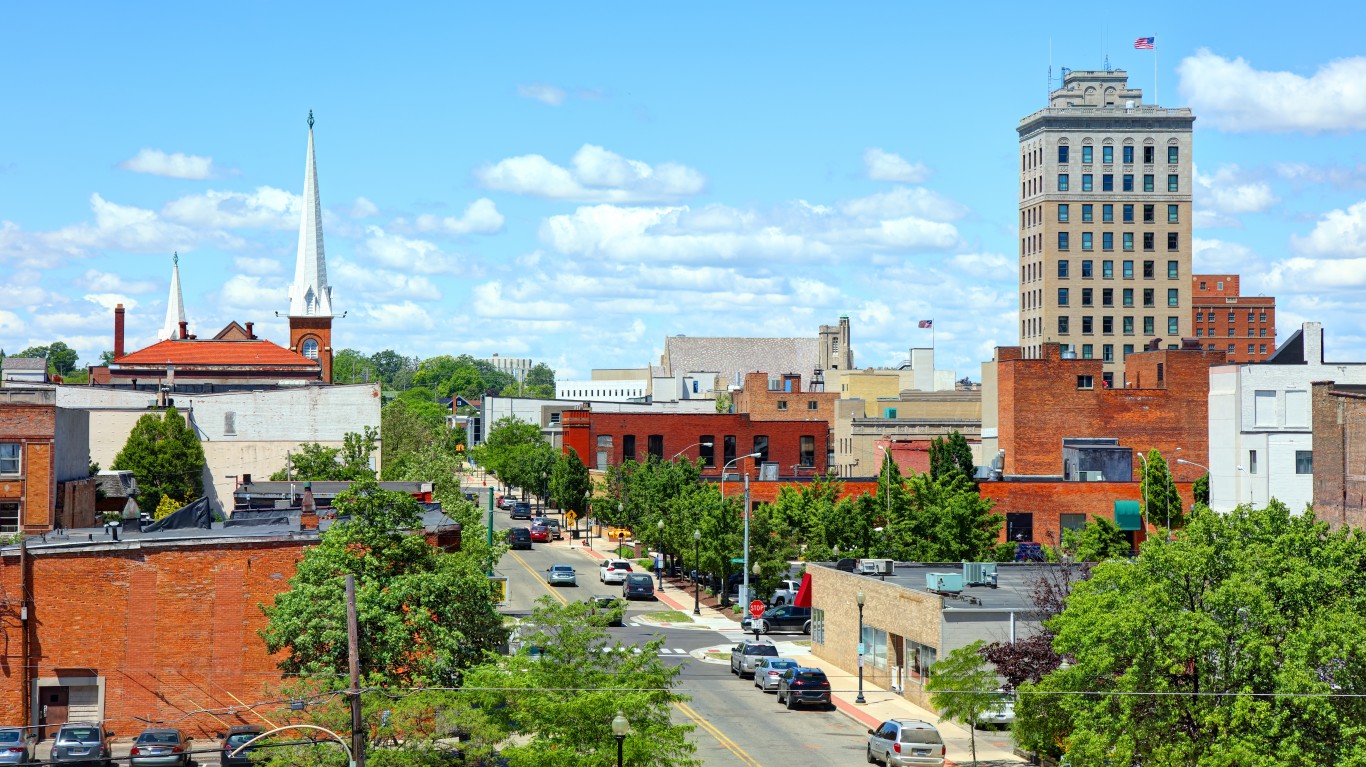
- Poverty rate: 24.0%
- Median household income: $41,988
- 5-yr. avg. unemployment rate: 10.8%
- Adults with a bachelor’s degree or higher: 15.3%
- Population: 31,420
16. Bay City

- Poverty rate: 24.8%
- Median household income: $45,026
- 5-yr. avg. unemployment rate: 6.2%
- Adults with a bachelor’s degree or higher: 16.3%
- Population: 32,664
15. Buena Vista

- Poverty rate: 25.0%
- Median household income: $39,373
- 5-yr. avg. unemployment rate: 13.9%
- Adults with a bachelor’s degree or higher: 7.3%
- Population: 6,013
14. Ecorse

- Poverty rate: 25.0%
- Median household income: $45,473
- 5-yr. avg. unemployment rate: 9.5%
- Adults with a bachelor’s degree or higher: 7.1%
- Population: 9,292
13. Houghton Lake
- Poverty rate: 26.1%
- Median household income: $44,432
- 5-yr. avg. unemployment rate: 5.1%
- Adults with a bachelor’s degree or higher: 14.3%
- Population: 5,601
12. Springfield
- Poverty rate: 26.2%
- Median household income: $40,091
- 5-yr. avg. unemployment rate: 11.3%
- Adults with a bachelor’s degree or higher: 5.6%
- Population: 5,268
11. Fair Plain
- Poverty rate: 26.5%
- Median household income: $50,170
- 5-yr. avg. unemployment rate: 20.5%
- Adults with a bachelor’s degree or higher: 22.6%
- Population: 6,882
10. Beecher

- Poverty rate: 32.5%
- Median household income: $35,618
- 5-yr. avg. unemployment rate: 22.4%
- Adults with a bachelor’s degree or higher: 4.5%
- Population: 9,085
9. Dowagiac
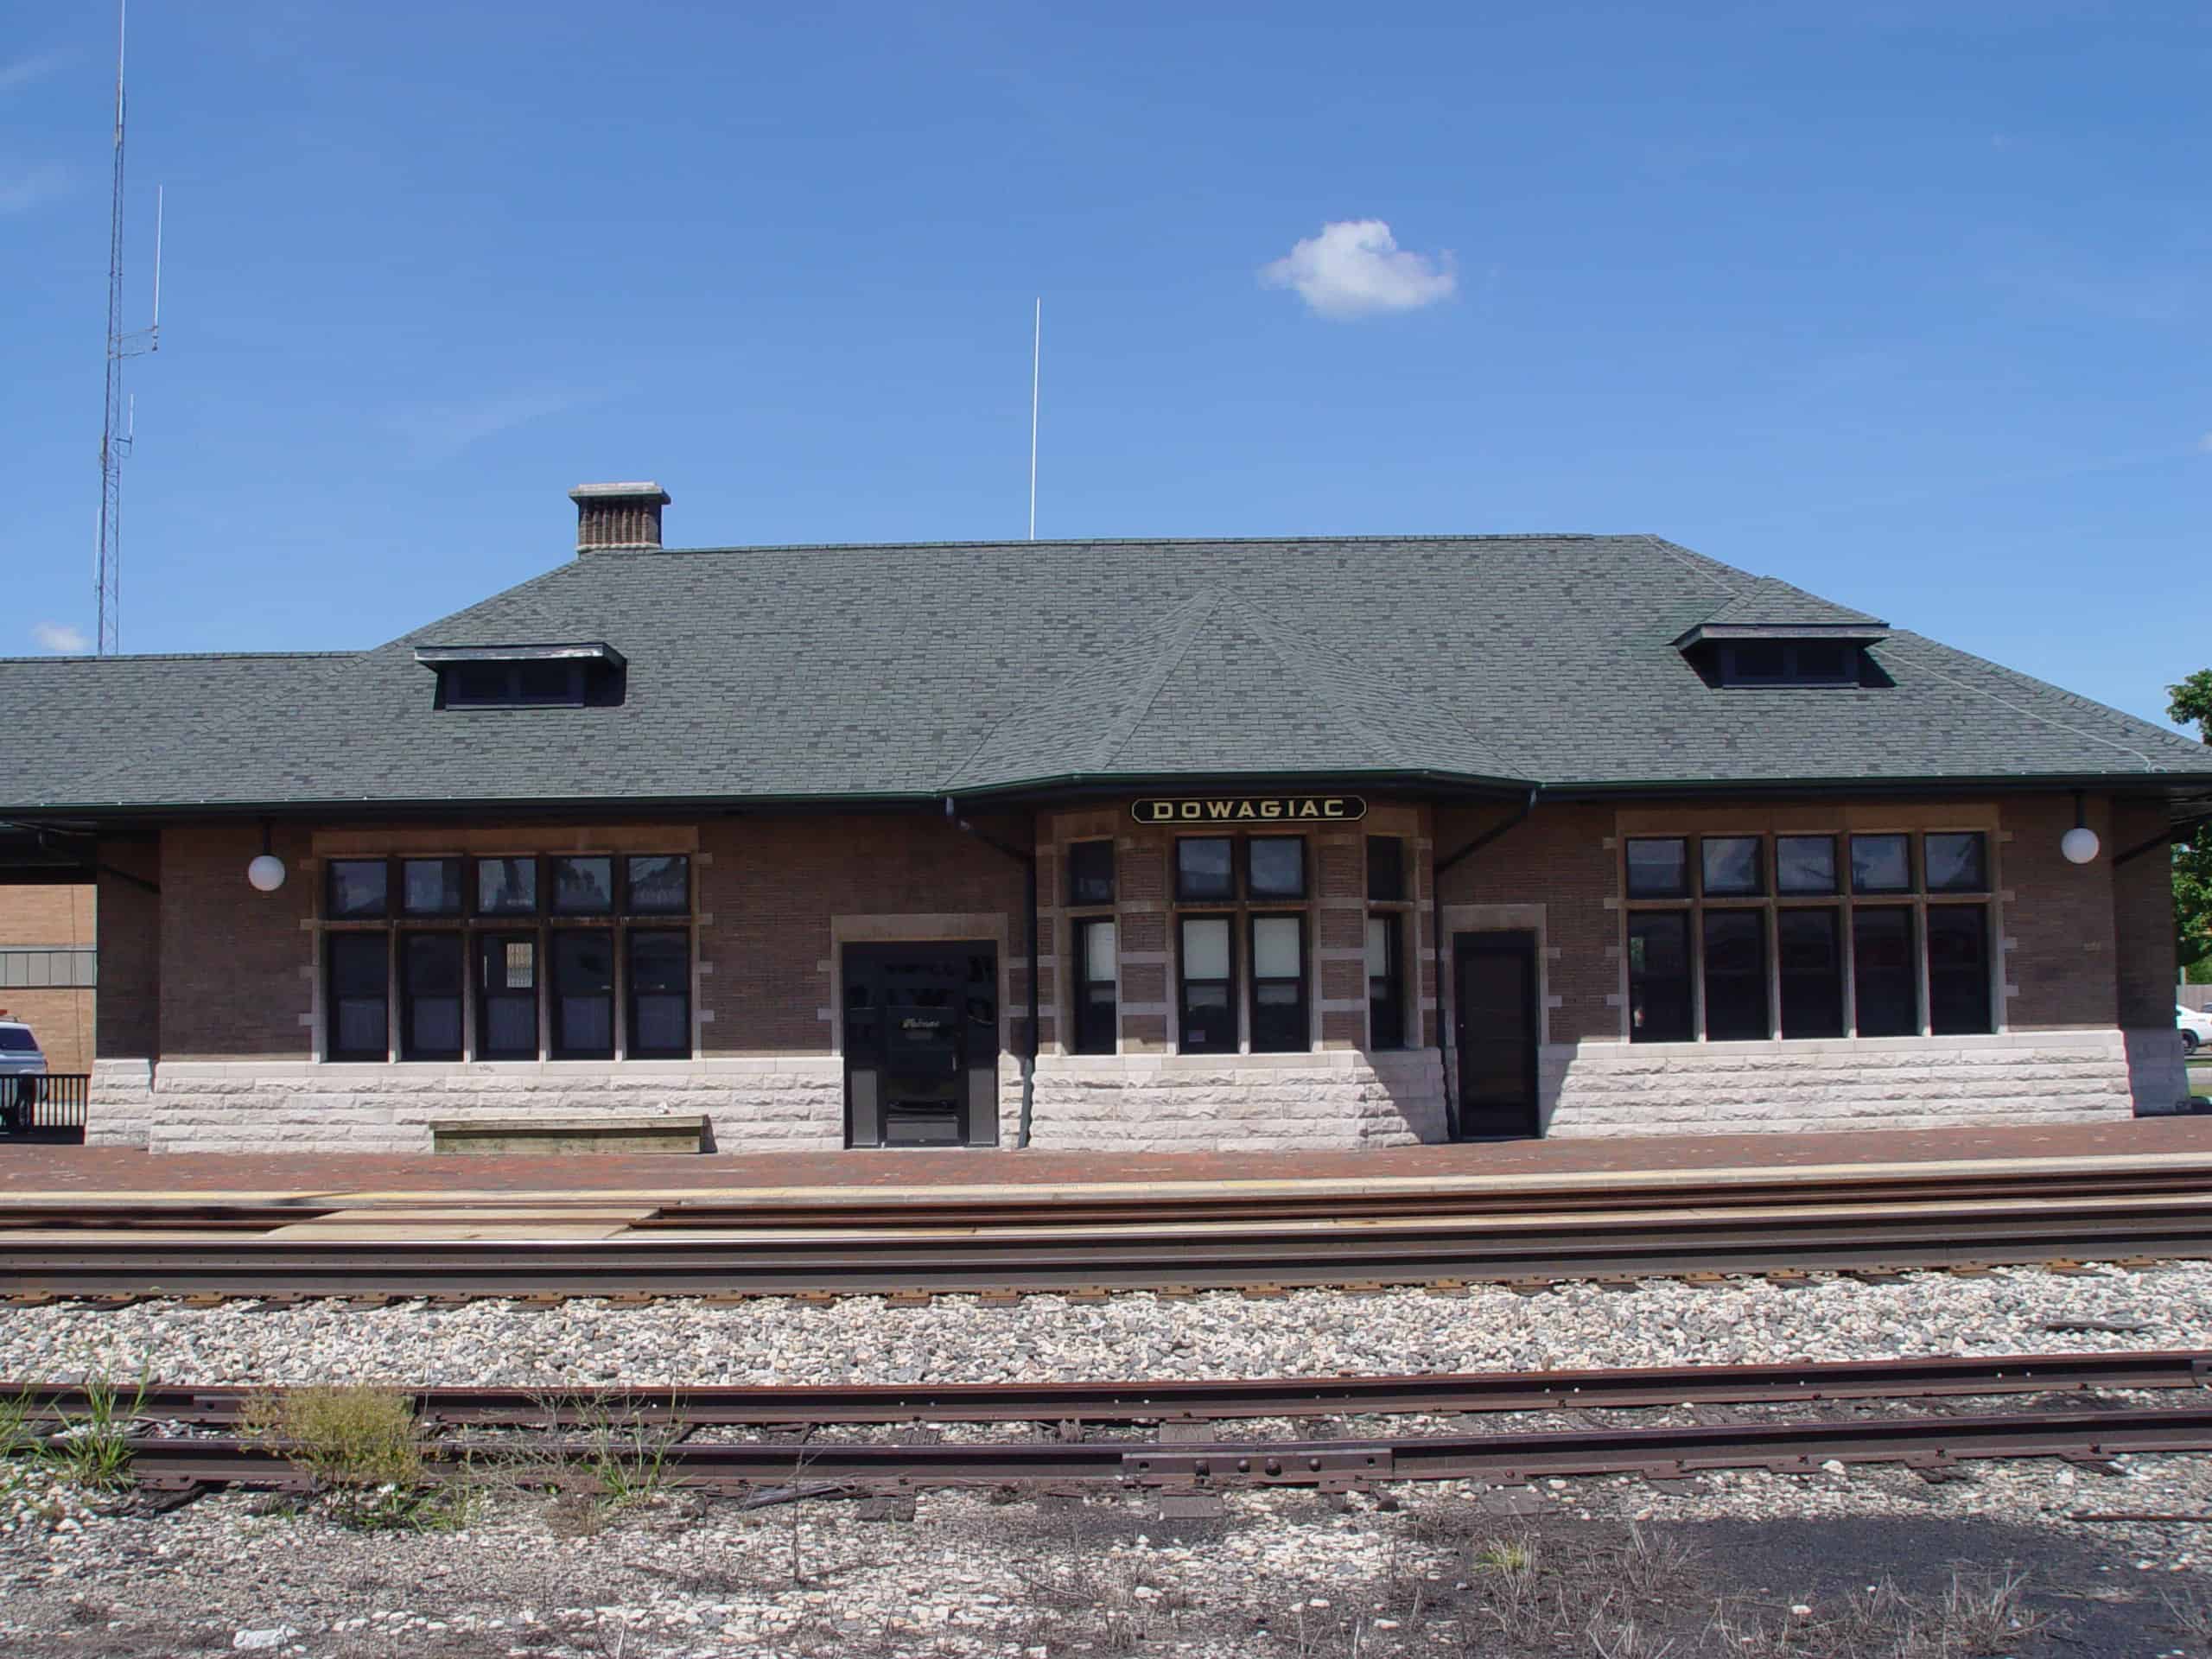
- Poverty rate: 32.8%
- Median household income: $41,864
- 5-yr. avg. unemployment rate: 11.1%
- Adults with a bachelor’s degree or higher: 15.1%
- Population: 5,680
8. Melvindale
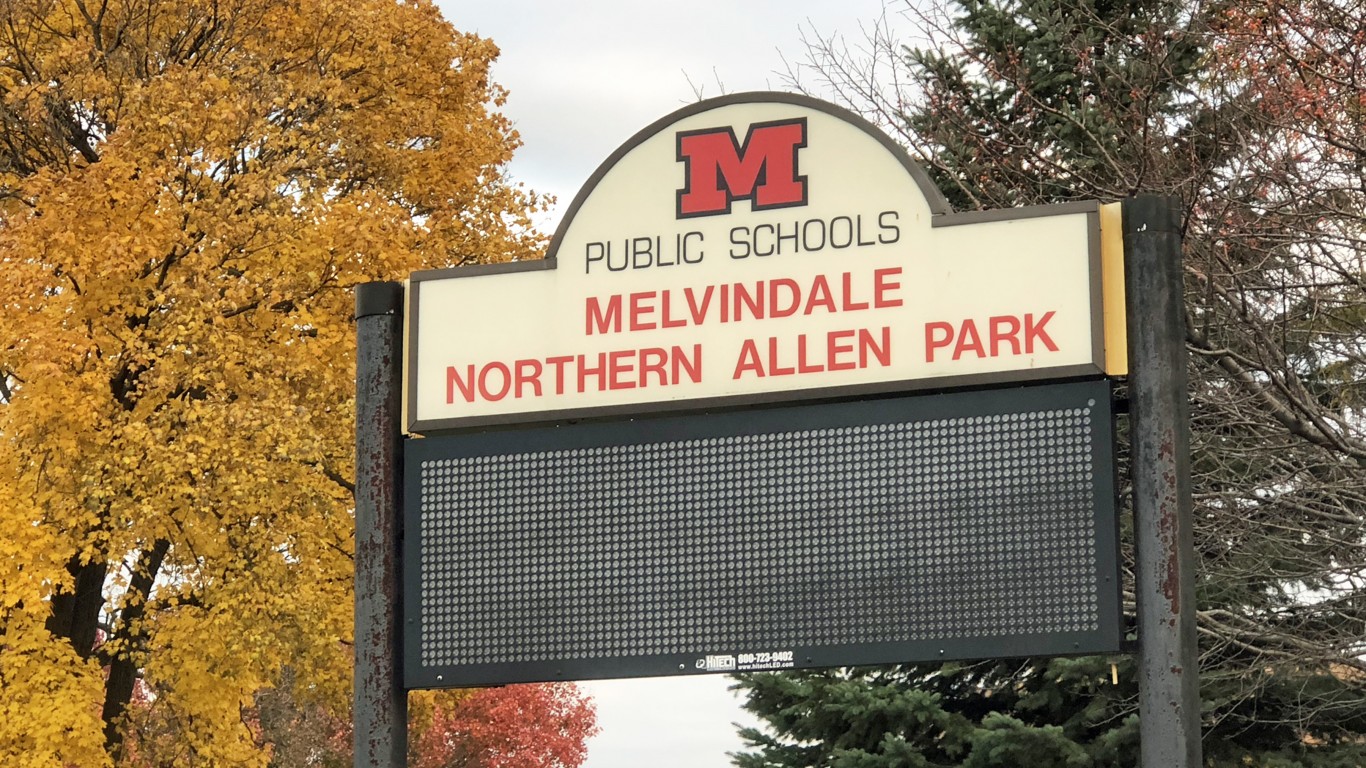
- Poverty rate: 33.2%
- Median household income: $38,918
- 5-yr. avg. unemployment rate: 11.2%
- Adults with a bachelor’s degree or higher: 13.0%
- Population: 12,639
7. Saginaw

- Poverty rate: 34.5%
- Median household income: $35,521
- 5-yr. avg. unemployment rate: 11.7%
- Adults with a bachelor’s degree or higher: 12.8%
- Population: 44,316
6. Inkster

- Poverty rate: 35.1%
- Median household income: $38,381
- 5-yr. avg. unemployment rate: 11.7%
- Adults with a bachelor’s degree or higher: 12.1%
- Population: 25,839
5. Muskegon Heights
- Poverty rate: 36.5%
- Median household income: $35,216
- 5-yr. avg. unemployment rate: 20.5%
- Adults with a bachelor’s degree or higher: 8.9%
- Population: 9,954
4. Highland Park
- Poverty rate: 37.6%
- Median household income: $30,341
- 5-yr. avg. unemployment rate: 18.2%
- Adults with a bachelor’s degree or higher: 16.2%
- Population: 9,032
3. Hamtramck

- Poverty rate: 37.7%
- Median household income: $39,648
- 5-yr. avg. unemployment rate: 11.7%
- Adults with a bachelor’s degree or higher: 18.1%
- Population: 27,842
2. River Rouge
- Poverty rate: 43.8%
- Median household income: $26,343
- 5-yr. avg. unemployment rate: 12.9%
- Adults with a bachelor’s degree or higher: 8.1%
- Population: 7,200
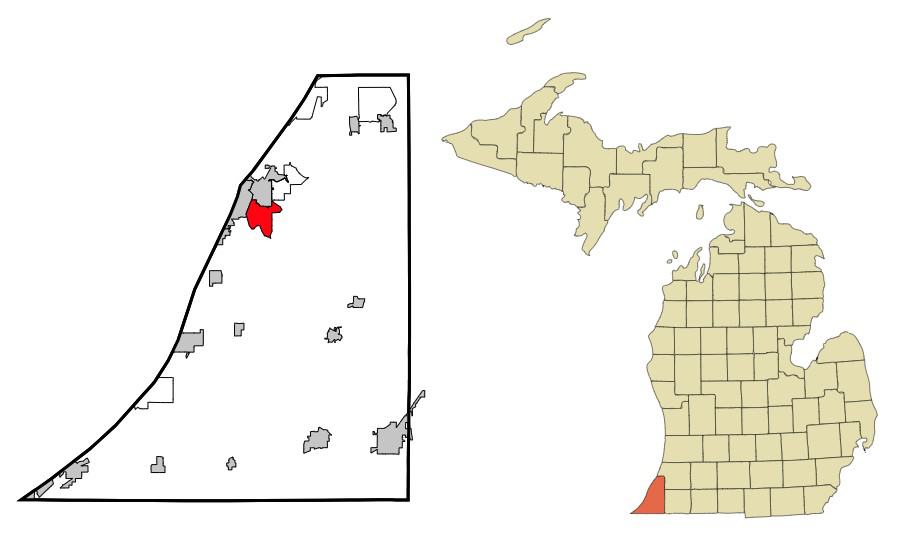
1. Benton Harbor
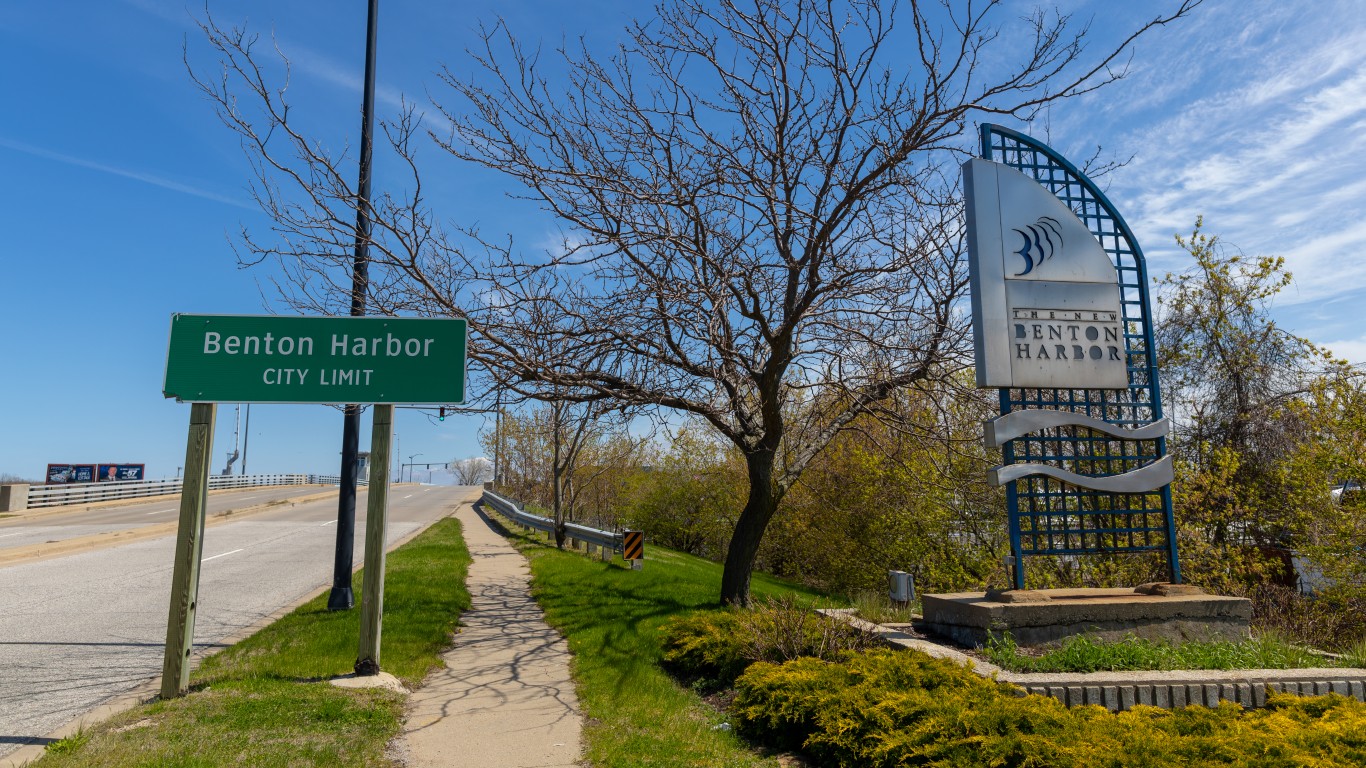
- Poverty rate: 44.2%
- Median household income: $26,592
- 5-yr. avg. unemployment rate: 20.2%
- Adults with a bachelor’s degree or higher: 8.4%
- Population: 9,101
| Rank | Place | Poverty rate (%) | Median household income ($) | Unemployment rate (%) | Adults with a bachelor’s degree or higher (%) | Total population |
|---|---|---|---|---|---|---|
| 1 | Benton Harbor, Michigan | 44.2 | 26,592 | 20.2 | 8.4 | 9,101 |
| 2 | River Rouge, Michigan | 43.8 | 26,343 | 12.9 | 8.1 | 7,200 |
| 3 | Hamtramck, Michigan | 37.7 | 39,648 | 11.7 | 18.1 | 27,842 |
| 4 | Highland Park, Michigan | 37.6 | 30,341 | 18.2 | 16.2 | 9,032 |
| 5 | Muskegon Heights, Michigan | 36.5 | 35,216 | 20.5 | 8.9 | 9,954 |
| 6 | Inkster, Michigan | 35.1 | 38,381 | 11.7 | 12.1 | 25,839 |
| 7 | Saginaw, Michigan | 34.5 | 35,521 | 11.7 | 12.8 | 44,316 |
| 8 | Melvindale, Michigan | 33.2 | 38,918 | 11.2 | 13.0 | 12,639 |
| 9 | Dowagiac, Michigan | 32.8 | 41,864 | 11.1 | 15.1 | 5,680 |
| 10 | Beecher, Michigan | 32.5 | 35,618 | 22.4 | 4.5 | 9,085 |
| 11 | Fair Plain, Michigan | 26.5 | 50,170 | 20.5 | 22.6 | 6,882 |
| 12 | Springfield, Michigan | 26.2 | 40,091 | 11.3 | 5.6 | 5,268 |
| 13 | Houghton Lake, Michigan | 26.1 | 44,432 | 5.1 | 14.3 | 5,601 |
| 14 | Ecorse, Michigan | 25.0 | 45,473 | 9.5 | 7.1 | 9,292 |
| 15 | Buena Vista, Michigan | 25.0 | 39,373 | 13.9 | 7.3 | 6,013 |
| 16 | Bay City, Michigan | 24.8 | 45,026 | 6.2 | 16.3 | 32,664 |
| 17 | Jackson, Michigan | 24.0 | 41,988 | 10.8 | 15.3 | 31,420 |
| 18 | Lapeer, Michigan | 24.0 | 50,510 | 4.3 | 14.3 | 9,034 |
| 19 | Adrian, Michigan | 23.4 | 40,797 | 4.8 | 20.3 | 20,607 |
| 20 | Muskegon, Michigan | 22.9 | 40,900 | 10.4 | 14.4 | 38,286 |
| 21 | Bridgeport, Michigan | 22.5 | 42,719 | 5.3 | 11.1 | 6,495 |
| 22 | Port Huron, Michigan | 22.2 | 47,906 | 9.3 | 18.5 | 28,881 |
| 23 | Alma, Michigan | 21.8 | 44,375 | 7.1 | 24.7 | 9,436 |
| 24 | Niles, Michigan | 21.7 | 42,181 | 12.0 | 17.0 | 11,871 |
| 25 | Coldwater, Michigan | 21.7 | 48,531 | 3.8 | 12.2 | 13,704 |
| 26 | New Haven, Michigan | 21.6 | 63,424 | 7.6 | 22.0 | 6,200 |
| 27 | Hillsdale, Michigan | 21.2 | 47,205 | 3.6 | 23.2 | 8,005 |
| 28 | Alpena, Michigan | 20.9 | 43,613 | 8.8 | 13.5 | 10,200 |
| 29 | Sault Ste. Marie, Michigan | 20.8 | 50,284 | 7.4 | 25.9 | 13,409 |
| 30 | Ludington, Michigan | 20.2 | 49,503 | 4.1 | 27.2 | 7,691 |
| 31 | Harper Woods, Michigan | 20.0 | 60,030 | 7.6 | 26.4 | 15,296 |
| 32 | Lincoln Park, Michigan | 19.8 | 55,777 | 6.9 | 11.1 | 39,807 |
| 33 | Cadillac, Michigan | 19.7 | 45,123 | 7.0 | 18.6 | 10,400 |
| 34 | Escanaba, Michigan | 19.0 | 38,457 | 7.2 | 19.3 | 12,403 |
| 35 | Sturgis, Michigan | 18.8 | 56,337 | 6.5 | 14.9 | 11,050 |