Despite social and economic changes over the years, and policies designed to support American families, poverty rates continue to rise nationwide. Inflation and widespread global conflict, have also significantly heightened the cost of living. In 2022, the official poverty rate in the U.S. was 11.5%, or 37.9 million people. As of 2024, the federal poverty level (FPL) in the United States is $14,891 for an individual. The poverty line for a family of four is $29,960. In 48 of 50 U.S. states, at least one county or county equivalent has a higher poverty rate than the national average. Using five-year estimates from the USCB’s 2022 American Community Survey, 24/7 Wall St. identified the county or county equivalent in each state with the highest poverty rate. We also provided data on unemployment rates and education levels. Income and job security tend to rise with greater education attained. The lack of work in a given area is linked to financial hardships. In the majority of these counties, the average unemployment rate was higher than the comparable average across the state in the last five years. (Homelessness increased by over 155% in this Northeast state.)
Why Are We Writing About Poverty?

According to the most recent Household Pulse Survey from the USCB, nearly 88% of Americans in households earning less than $25,000 annually report at least some difficulty paying for usual expenses, compared to 63% of all Americans. Americans in the lowest income bracket were also more likely to be behind on rent or mortgage payments and nearly three times as likely as the typical American to regularly not have enough to eat. These circumstances contribute to higher rates of mental health problems. In fact, Americans in households earning less than $25,000 a year are more likely than any other income group to report anxiety or uncontrollable worry nearly every day.
Simply living in an already impoverished area, such as one lacking in jobs and social infrastructure, directly impacts the financial status of a person or family. Should a person or family wish to improve their standings, these circumstances set them at a disadvantage from the beginning. When one compounds this disadvantage with a lack of education or mental health struggles, attempts to get out of the situation can be difficult and feel impossible. Understanding the impact of poverty will help one better understand the community’s needs and how to help, should they wish.
It’s time to learn which county in each state has the worst poverty rate:
Alabama: Greene County

- Poverty rate: 32.9% (Alabama: 15.7%)
- Median household income: $32,796 (Alabama: $59,609)
- Adults with a bachelor’s degree or higher: 16.7% (Alabama: 27.2%)
- 2022 unemployment rate: 4.4% (Alabama: 2.6%)
- Total population: 7,706
- No. of counties considered in ranking: 67
Alaska: Kusilvak Census Area

- Poverty rate: 34.3% (Alaska: 10.5%)
- Median household income: $42,663 (Alaska: $86,370)
- Adults with a bachelor’s degree or higher: 4.6% (Alaska: 30.7%)
- 2022 unemployment rate: 12.9% (Alaska: 4.0%)
- Total population: 8,372
- No. of boroughs considered in ranking: 27
Arizona: Apache County

- Poverty rate: 32.5% (Arizona: 13.1%)
- Median household income: $37,483 (Arizona: $72,581)
- Adults with a bachelor’s degree or higher: 13.8% (Arizona: 31.8%)
- 2022 unemployment rate: 7.7% (Arizona: 3.8%)
- Total population: 66,054
- No. of counties considered in ranking: 15
Arkansas: Phillips County

- Poverty rate: 30.5% (Arkansas: 16.2%)
- Median household income: $37,458 (Arkansas: $56,335)
- Adults with a bachelor’s degree or higher: 15.2% (Arkansas: 24.7%)
- 2022 unemployment rate: 6.3% (Arkansas: 3.3%)
- Total population: 16,373
- No. of counties considered in ranking: 75
California: Trinity County

- Poverty rate: 22.0% (California: 12.1%)
- Median household income: $47,317 (California: $91,905)
- Adults with a bachelor’s degree or higher: 19.2% (California: 35.9%)
- 2022 unemployment rate: 4.6% (California: 4.2%)
- Total population: 15,889
- No. of counties considered in ranking: 58
Colorado: Bent County

- Poverty rate: 27.1% (Colorado: 9.6%)
- Median household income: $45,776 (Colorado: $87,598)
- Adults with a bachelor’s degree or higher: 15.5% (Colorado: 43.7%)
- 2022 unemployment rate: 3.6% (Colorado: 3.0%)
- Total population: 5,561
- No. of counties considered in ranking: 61
Connecticut: Greater Bridgeport Planning Region

- Poverty rate: 13.3% (Connecticut: 10.1%)
- Median household income: $83,147 (Connecticut: $90,213)
- Adults with a bachelor’s degree or higher: 41.7% (Connecticut: 41.4%)
- 2022 unemployment rate: N/A (Connecticut: 4.2%)
- Total population: 326,381
- No. of county equivalents considered in ranking: 9
Delaware: Kent County

- Poverty rate: 12.3% (Delaware: 11.1%)
- Median household income: $69,278 (Delaware: $79,325)
- Adults with a bachelor’s degree or higher: 26.3% (Delaware: 34.5%)
- 2022 unemployment rate: 5.2% (Delaware: 4.5%)
- Total population: 182,400
- No. of counties considered in ranking: 3
Florida: Hardee County

- Poverty rate: 28.5% (Florida: 12.9%)
- Median household income: $44,665 (Florida: $67,917)
- Adults with a bachelor’s degree or higher: 10.4% (Florida: 32.3%)
- 2022 unemployment rate: 3.9% (Florida: 2.9%)
- Total population: 25,528
- No. of counties considered in ranking: 67
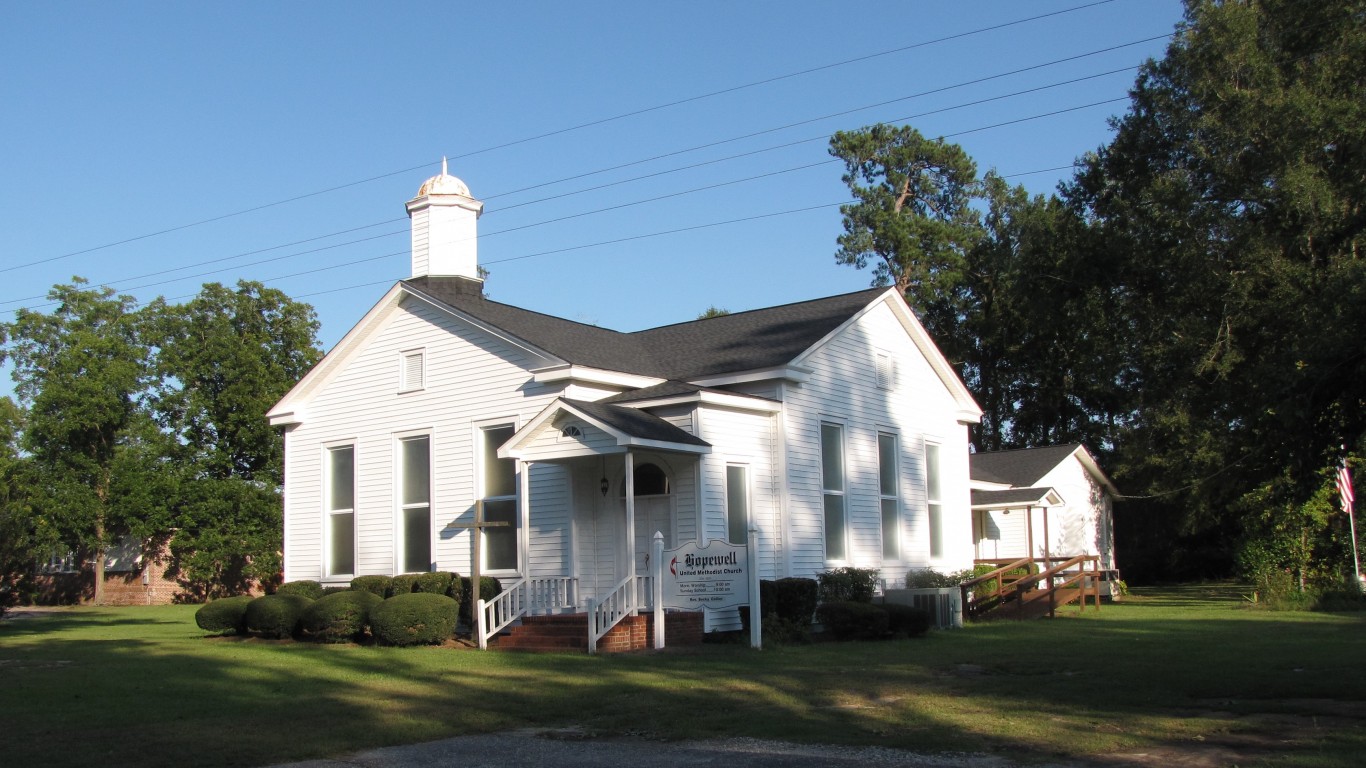
Georgia: Clinch County

- Poverty rate: 32.5% (Georgia: 13.5%)
- Median household income: $53,350 (Georgia: $71,355)
- Adults with a bachelor’s degree or higher: 12.9% (Georgia: 33.6%)
- 2022 unemployment rate: 2.8% (Georgia: 3.0%)
- Total population: 6,713
- No. of counties considered in ranking: 159
Hawaii: Hawaii County

- Poverty rate: 14.1% (Hawaii: 9.6%)
- Median household income: $74,238 (Hawaii: $94,814)
- Adults with a bachelor’s degree or higher: 30.7% (Hawaii: 34.7%)
- 2022 unemployment rate: 3.6% (Hawaii: 3.5%)
- Total population: 202,163
- No. of counties considered in ranking: 4
Idaho: Madison County
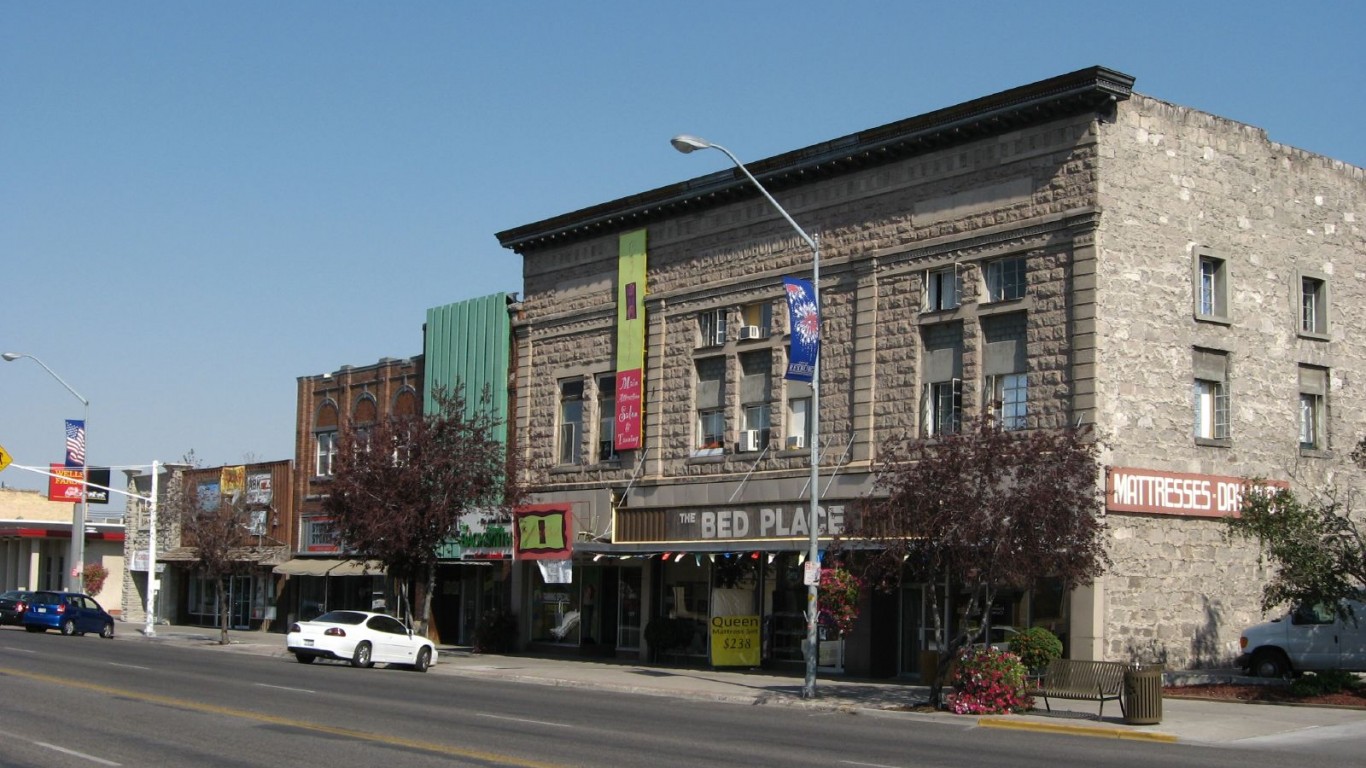
- Poverty rate: 30.1% (Idaho: 11.0%)
- Median household income: $53,025 (Idaho: $70,214)
- Adults with a bachelor’s degree or higher: 39.1% (Idaho: 30.2%)
- 2022 unemployment rate: 1.8% (Idaho: 2.7%)
- Total population: 52,487
- No. of counties considered in ranking: 43
Illinois: Pulaski County
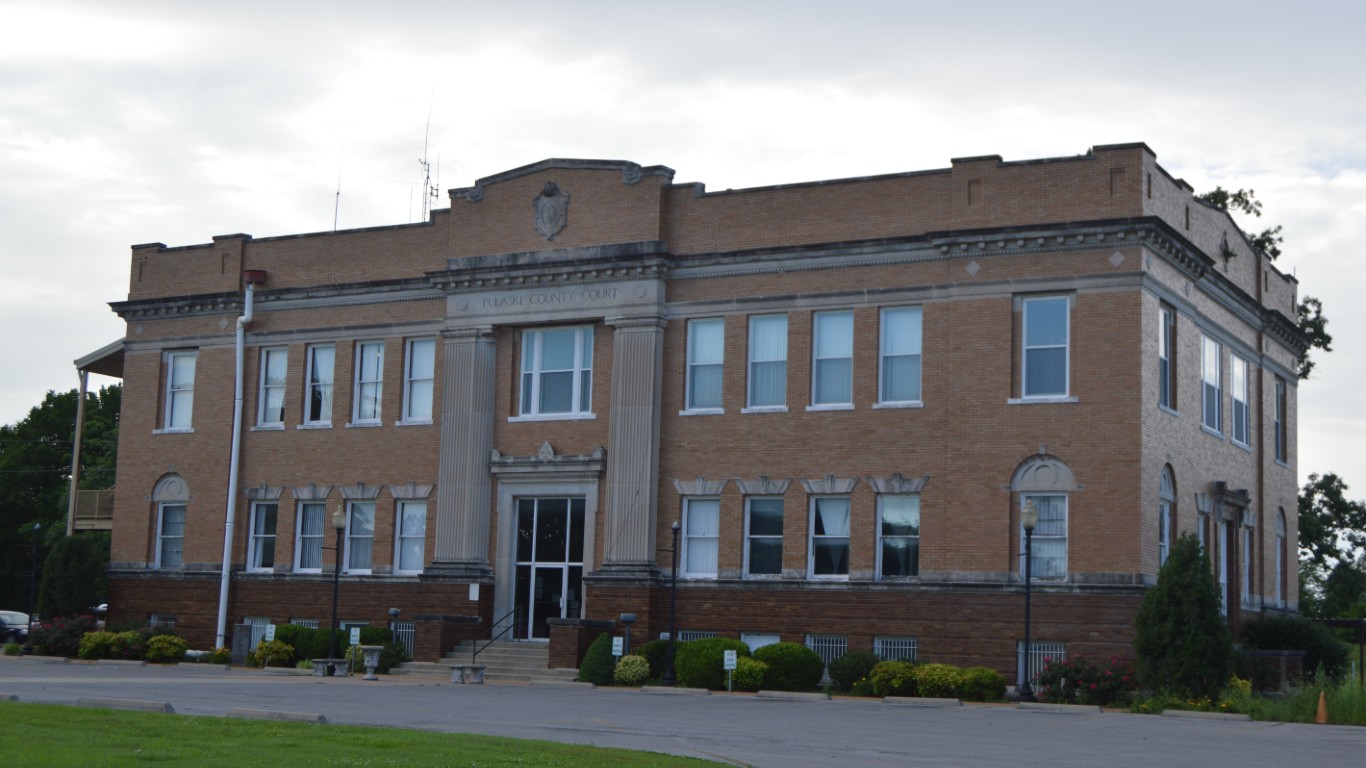
- Poverty rate: 25.0% (Illinois: 11.8%)
- Median household income: $41,038 (Illinois: $78,433)
- Adults with a bachelor’s degree or higher: 14.5% (Illinois: 36.7%)
- 2022 unemployment rate: 6.9% (Illinois: 4.6%)
- Total population: 5,177
- No. of counties considered in ranking: 102
Indiana: Crawford County

- Poverty rate: 21.9% (Indiana: 12.3%)
- Median household income: $46,706 (Indiana: $67,173)
- Adults with a bachelor’s degree or higher: 12.2% (Indiana: 28.2%)
- 2022 unemployment rate: 3.5% (Indiana: 3.0%)
- Total population: 10,511
- No. of counties considered in ranking: 92
Iowa: Story County

- Poverty rate: 19.6% (Iowa: 11.1%)
- Median household income: $66,197 (Iowa: $70,571)
- Adults with a bachelor’s degree or higher: 52.5% (Iowa: 30.3%)
- 2022 unemployment rate: 2.0% (Iowa: 2.7%)
- Total population: 98,573
- No. of counties considered in ranking: 99
Kansas: Riley County

- Poverty rate: 22.7% (Kansas: 11.6%)
- Median household income: $56,327 (Kansas: $69,747)
- Adults with a bachelor’s degree or higher: 47.8% (Kansas: 34.7%)
- 2022 unemployment rate: 2.7% (Kansas: 2.7%)
- Total population: 72,105
- No. of counties considered in ranking: 105
Kentucky: Wolfe County

- Poverty rate: 36.8% (Kentucky: 16.1%)
- Median household income: $28,666 (Kentucky: $60,183)
- Adults with a bachelor’s degree or higher: 7.0% (Kentucky: 26.5%)
- 2022 unemployment rate: 5.6% (Kentucky: 3.9%)
- Total population: 6,573
- No. of counties considered in ranking: 120
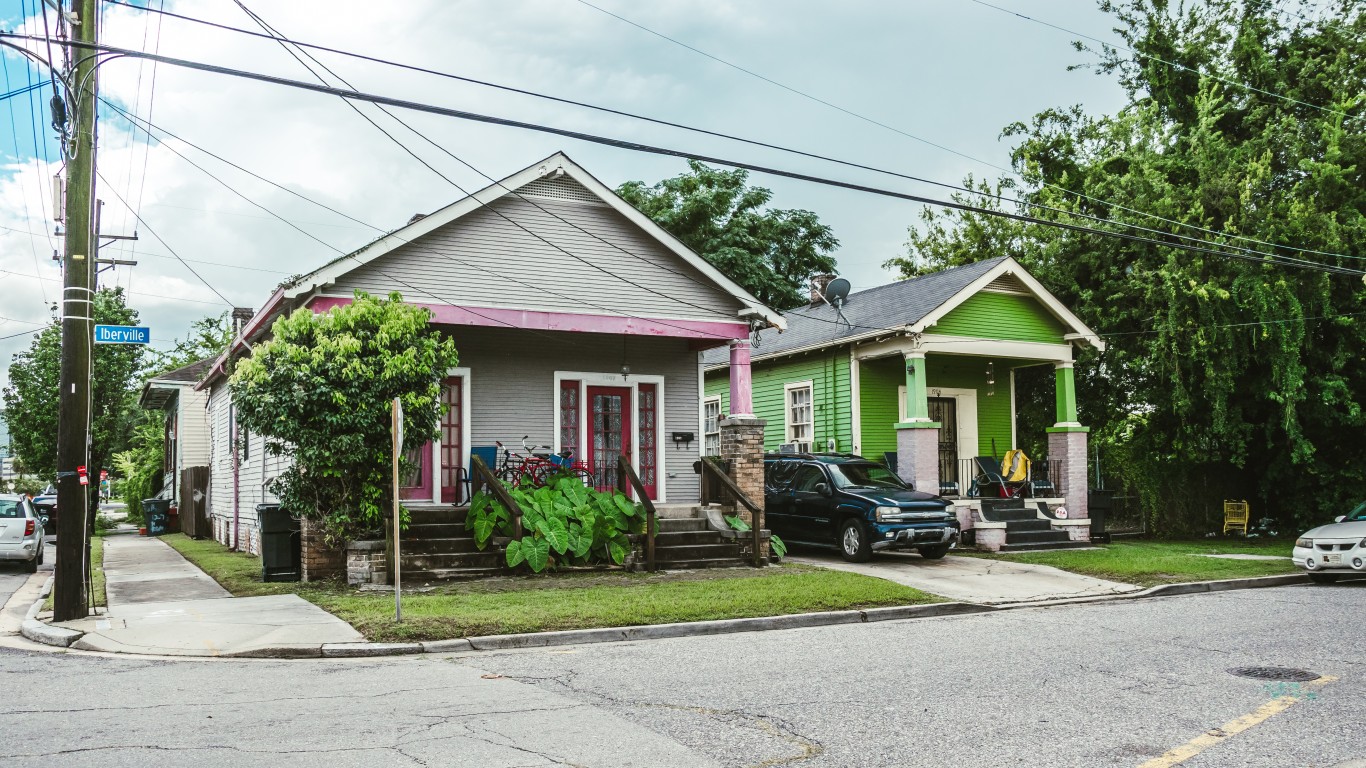
Louisiana: East Carroll Parish

- Poverty rate: 40.3% (Louisiana: 18.7%)
- Median household income: $30,856 (Louisiana: $57,852)
- Adults with a bachelor’s degree or higher: 11.8% (Louisiana: 26.1%)
- 2022 unemployment rate: 7.9% (Louisiana: 3.7%)
- Total population: 7,371
- No. of parishes considered in ranking: 64
Maine: Washington County

- Poverty rate: 17.5% (Maine: 10.9%)
- Median household income: $51,669 (Maine: $68,251)
- Adults with a bachelor’s degree or higher: 24.6% (Maine: 34.1%)
- 2022 unemployment rate: 4.3% (Maine: 3.0%)
- Total population: 31,096
- No. of counties considered in ranking: 16
Maryland: Somerset County
- Poverty rate: 19.8% (Maryland: 9.3%)
- Median household income: $52,149 (Maryland: $98,461)
- Adults with a bachelor’s degree or higher: 16.8% (Maryland: 42.2%)
- 2022 unemployment rate: 4.8% (Maryland: 3.2%)
- Total population: 24,672
- No. of counties considered in ranking: 24
Massachusetts: Suffolk County

- Poverty rate: 17.0% (Massachusetts: 9.9%)
- Median household income: $87,669 (Massachusetts: $96,505)
- Adults with a bachelor’s degree or higher: 49.2% (Massachusetts: 45.9%)
- 2022 unemployment rate: 3.6% (Massachusetts: 3.8%)
- Total population: 785,443
- No. of counties considered in ranking: 14
Michigan: Isabella County

- Poverty rate: 23.6% (Michigan: 13.1%)
- Median household income: $52,638 (Michigan: $68,505)
- Adults with a bachelor’s degree or higher: 30.7% (Michigan: 31.1%)
- 2022 unemployment rate: 4.9% (Michigan: 4.2%)
- Total population: 64,938
- No. of counties considered in ranking: 83
Minnesota: Mahnomen County
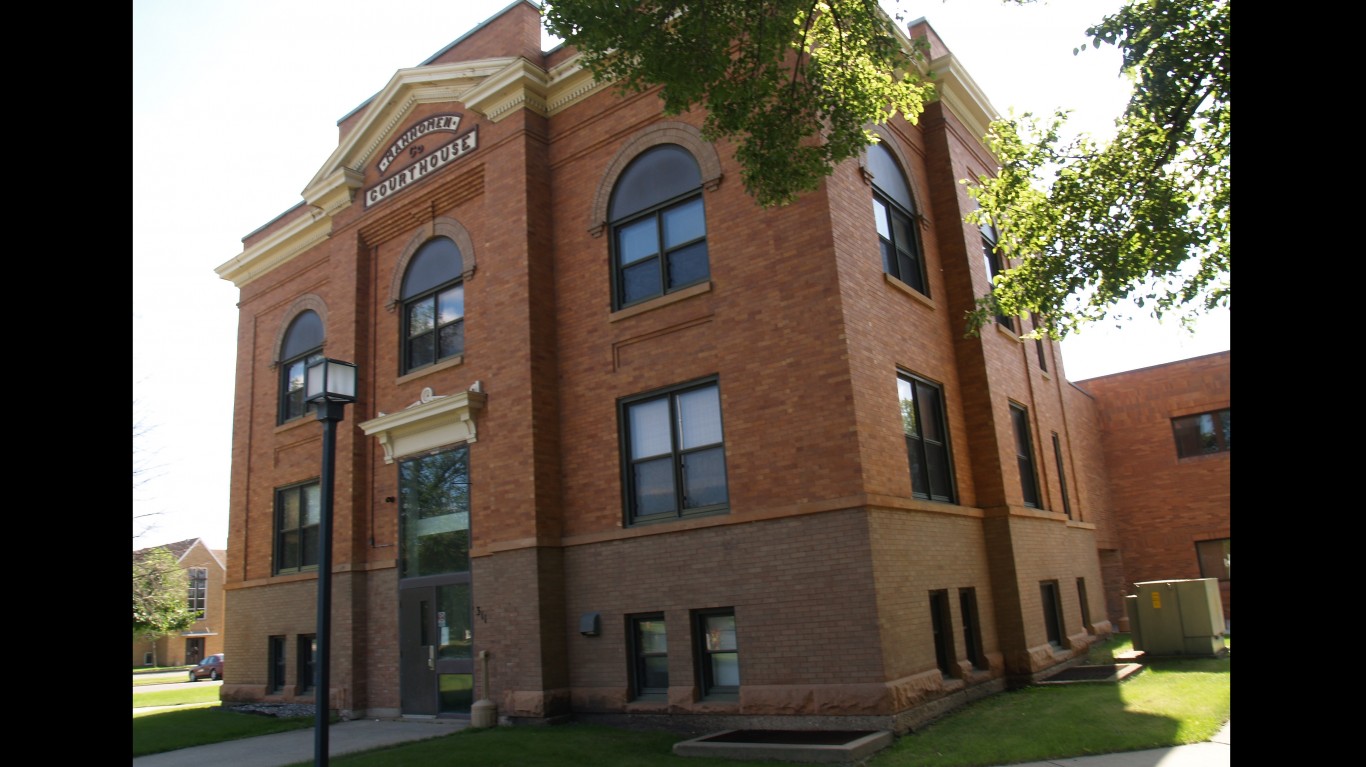
- Poverty rate: 20.6% (Minnesota: 9.3%)
- Median household income: $52,739 (Minnesota: $84,313)
- Adults with a bachelor’s degree or higher: 13.7% (Minnesota: 38.2%)
- 2022 unemployment rate: 4.9% (Minnesota: 2.7%)
- Total population: 5,389
- No. of counties considered in ranking: 87
Mississippi: Coahoma County

- Poverty rate: 37.0% (Mississippi: 19.2%)
- Median household income: $36,075 (Mississippi: $52,985)
- Adults with a bachelor’s degree or higher: 20.0% (Mississippi: 23.9%)
- 2022 unemployment rate: 5.6% (Mississippi: 3.9%)
- Total population: 21,264
- No. of counties considered in ranking: 82
Missouri: Pemiscot County

- Poverty rate: 29.3% (Missouri: 12.8%)
- Median household income: $37,426 (Missouri: $65,920)
- Adults with a bachelor’s degree or higher: 11.6% (Missouri: 31.2%)
- 2022 unemployment rate: 3.8% (Missouri: 2.5%)
- Total population: 15,555
- No. of counties considered in ranking: 115
Montana: Roosevelt County
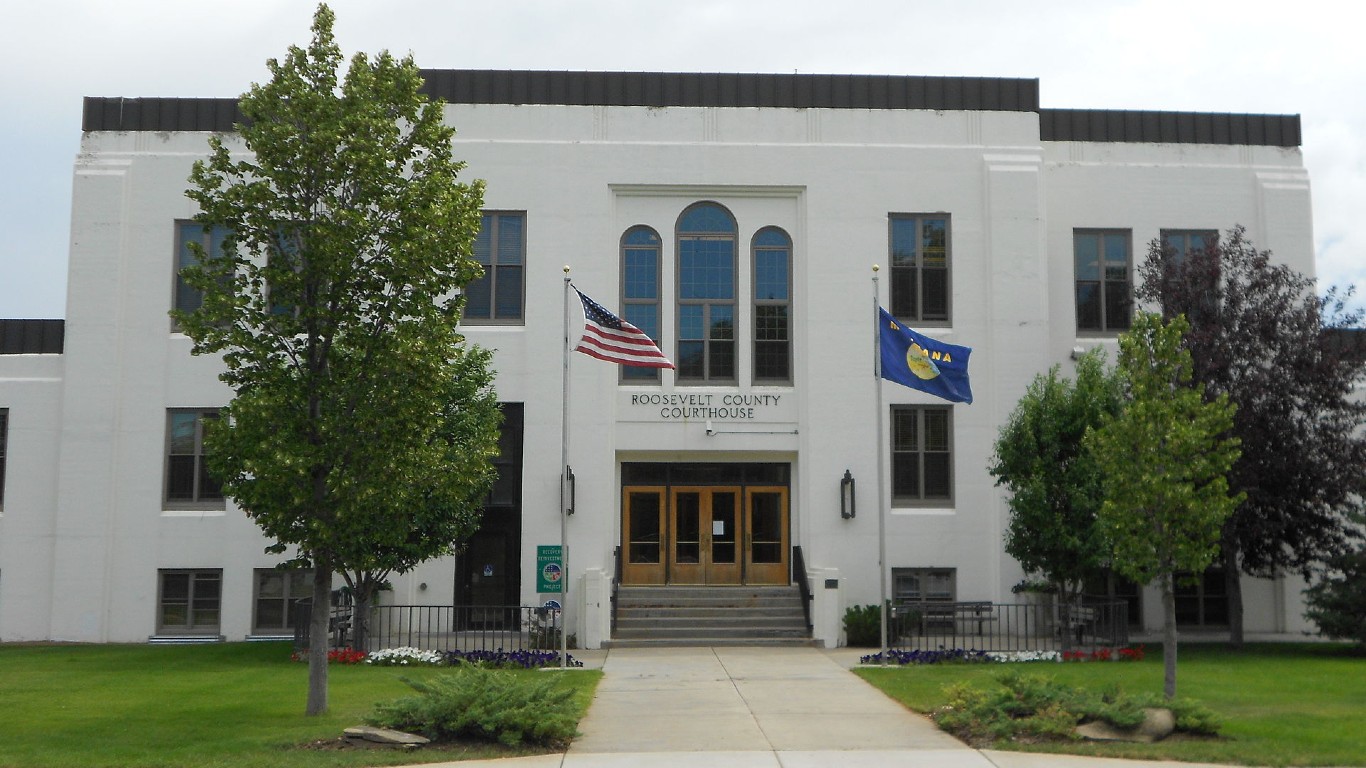
- Poverty rate: 31.5% (Montana: 12.4%)
- Median household income: $51,038 (Montana: $66,341)
- Adults with a bachelor’s degree or higher: 19.8% (Montana: 34.0%)
- 2022 unemployment rate: 3.5% (Montana: 2.6%)
- Total population: 10,799
- No. of counties considered in ranking: 52
Nebraska: Thurston County
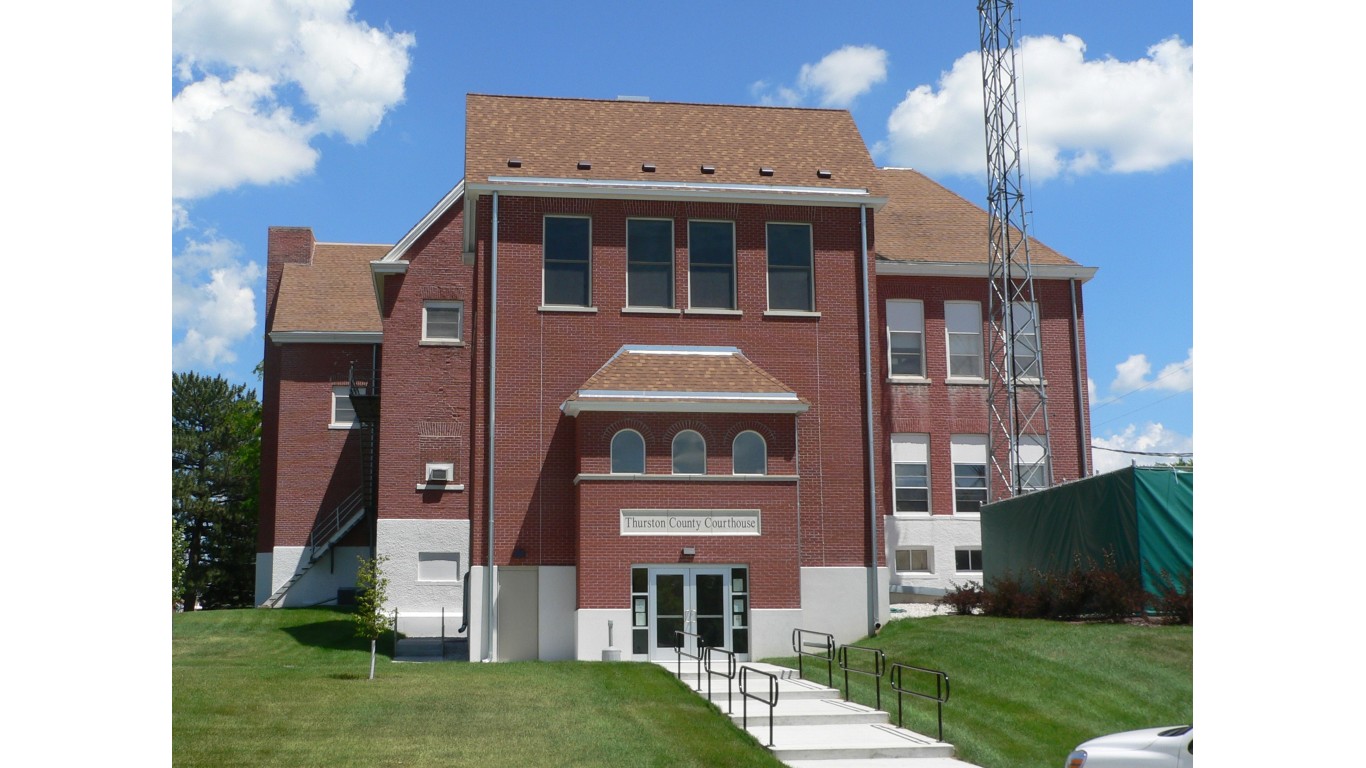
- Poverty rate: 19.0% (Nebraska: 10.4%)
- Median household income: $63,459 (Nebraska: $71,722)
- Adults with a bachelor’s degree or higher: 19.8% (Nebraska: 33.5%)
- 2022 unemployment rate: 3.4% (Nebraska: 2.3%)
- Total population: 6,716
- No. of counties considered in ranking: 81
Nevada: Mineral County
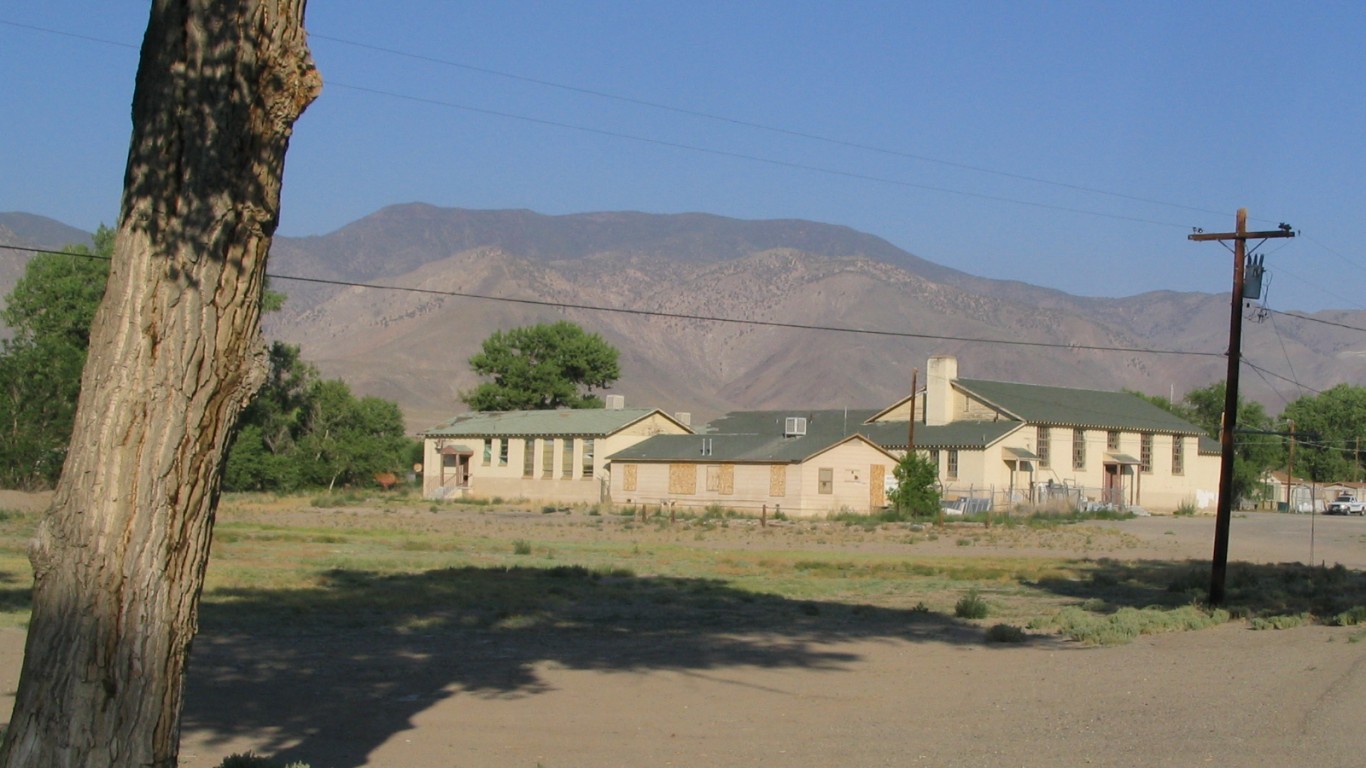
- Poverty rate: 18.5% (Nevada: 12.7%)
- Median household income: $46,625 (Nevada: $71,646)
- Adults with a bachelor’s degree or higher: 14.6% (Nevada: 26.5%)
- 2022 unemployment rate: 4.1% (Nevada: 5.4%)
- Total population: 4,568
- No. of counties considered in ranking: 16
New Hampshire: Sullivan County

- Poverty rate: 11.7% (New Hampshire: 7.3%)
- Median household income: $70,788 (New Hampshire: $90,845)
- Adults with a bachelor’s degree or higher: 30.1% (New Hampshire: 39.0%)
- 2022 unemployment rate: 2.4% (New Hampshire: 2.5%)
- Total population: 43,356
- No. of counties considered in ranking: 10
New Jersey: Cumberland County
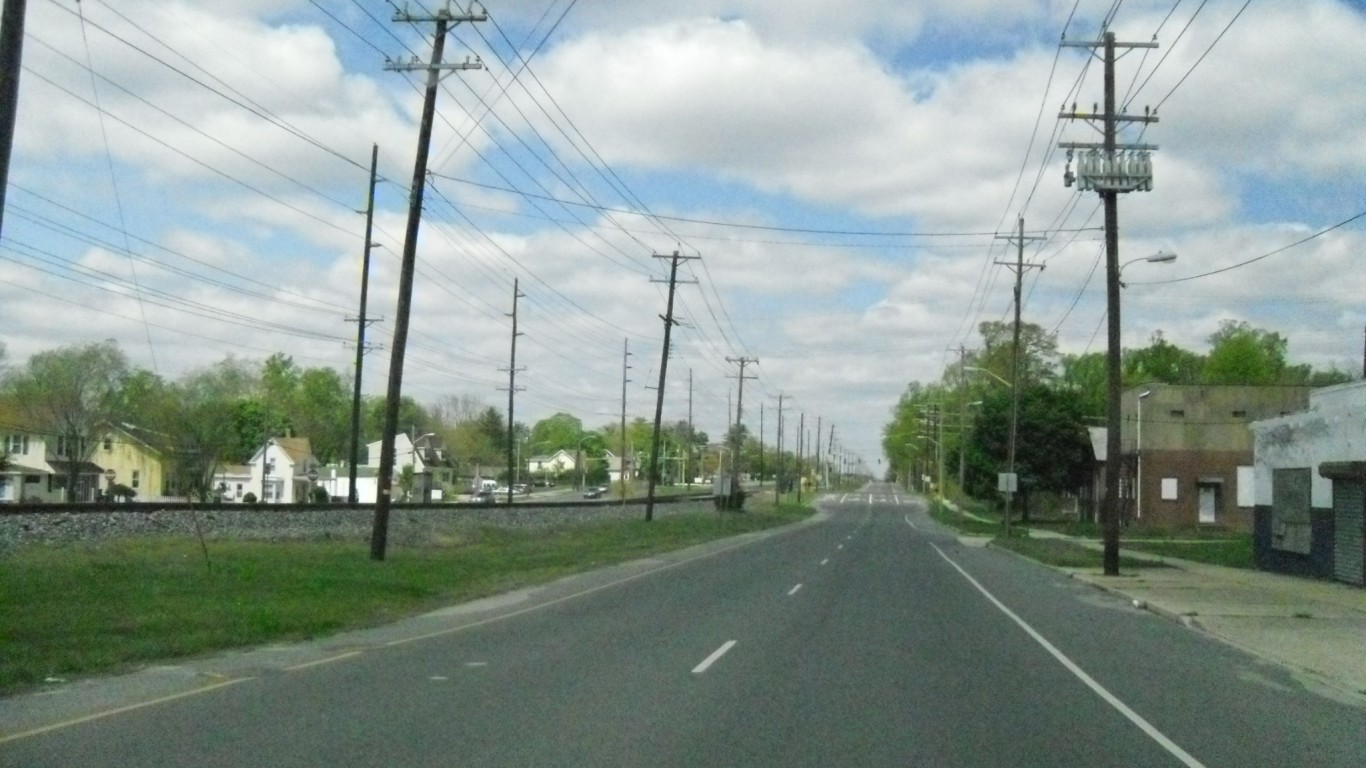
- Poverty rate: 15.5% (New Jersey: 9.7%)
- Median household income: $62,310 (New Jersey: $97,126)
- Adults with a bachelor’s degree or higher: 17.3% (New Jersey: 42.3%)
- 2022 unemployment rate: 5.1% (New Jersey: 3.7%)
- Total population: 153,588
- No. of counties considered in ranking: 21
New Mexico: McKinley County

- Poverty rate: 33.6% (New Mexico: 18.3%)
- Median household income: $44,029 (New Mexico: $58,722)
- Adults with a bachelor’s degree or higher: 12.4% (New Mexico: 29.1%)
- 2022 unemployment rate: 5.7% (New Mexico: 4.0%)
- Total population: 72,073
- No. of counties considered in ranking: 32
New York: Bronx County

- Poverty rate: 26.9% (New York: 13.6%)
- Median household income: $47,036 (New York: $81,386)
- Adults with a bachelor’s degree or higher: 21.2% (New York: 38.8%)
- 2022 unemployment rate: 7.8% (New York: 4.3%)
- Total population: 1,443,229
- No. of counties considered in ranking: 62
North Carolina: Hyde County

- Poverty rate: 29.9% (North Carolina: 13.3%)
- Median household income: $43,724 (North Carolina: $66,186)
- Adults with a bachelor’s degree or higher: 14.2% (North Carolina: 33.9%)
- 2022 unemployment rate: 5.6% (North Carolina: 3.7%)
- Total population: 4,636
- No. of counties considered in ranking: 100
North Dakota: Sioux County

- Poverty rate: 39.7% (North Dakota: 10.8%)
- Median household income: $41,201 (North Dakota: $73,959)
- Adults with a bachelor’s degree or higher: 11.5% (North Dakota: 31.4%)
- 2022 unemployment rate: 2.6% (North Dakota: 2.1%)
- Total population: 3,896
- No. of counties considered in ranking: 51
Ohio: Athens County
- Poverty rate: 24.4% (Ohio: 13.3%)
- Median household income: $48,750 (Ohio: $66,990)
- Adults with a bachelor’s degree or higher: 34.3% (Ohio: 30.4%)
- 2022 unemployment rate: 4.8% (Ohio: 4.0%)
- Total population: 61,276
- No. of counties considered in ranking: 88
Oklahoma: Okfuskee County

- Poverty rate: 26.7% (Oklahoma: 15.2%)
- Median household income: $45,429 (Oklahoma: $61,364)
- Adults with a bachelor’s degree or higher: 12.5% (Oklahoma: 27.3%)
- 2022 unemployment rate: 3.9% (Oklahoma: 3.0%)
- Total population: 11,349
- No. of counties considered in ranking: 77
Oregon: Lake County

- Poverty rate: 19.6% (Oregon: 11.9%)
- Median household income: $54,663 (Oregon: $76,632)
- Adults with a bachelor’s degree or higher: 19.8% (Oregon: 35.5%)
- 2022 unemployment rate: 5.4% (Oregon: 4.2%)
- Total population: 8,201
- No. of counties considered in ranking: 36
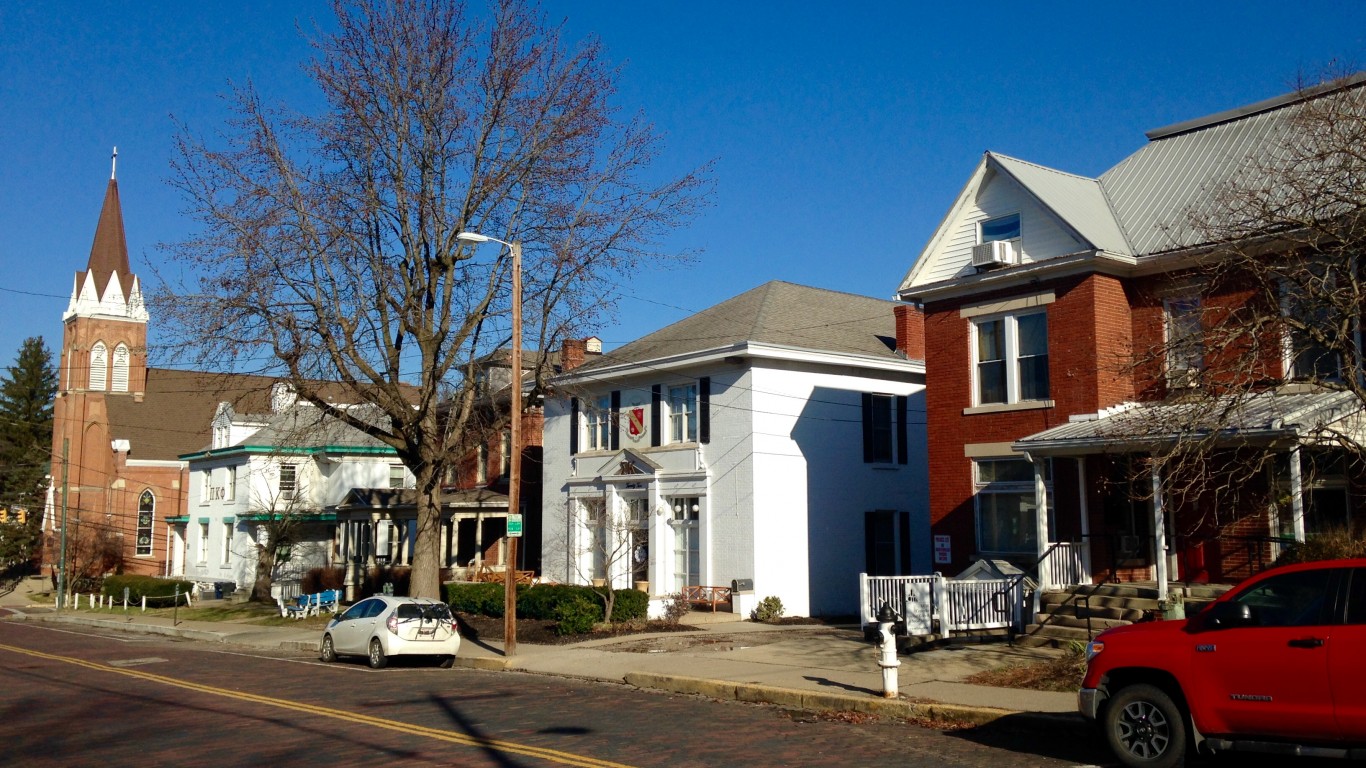
Pennsylvania: Philadelphia County

- Poverty rate: 22.7% (Pennsylvania: 11.8%)
- Median household income: $57,537 (Pennsylvania: $73,170)
- Adults with a bachelor’s degree or higher: 33.6% (Pennsylvania: 33.8%)
- 2022 unemployment rate: 5.4% (Pennsylvania: 4.4%)
- Total population: 1,593,208
- No. of counties considered in ranking: 67
Rhode Island: Providence County

- Poverty rate: 13.6% (Rhode Island: 11.2%)
- Median household income: $72,579 (Rhode Island: $81,370)
- Adults with a bachelor’s degree or higher: 31.2% (Rhode Island: 36.3%)
- 2022 unemployment rate: 3.5% (Rhode Island: 3.2%)
- Total population: 657,984
- No. of counties considered in ranking: 5
South Carolina: Dillon County
- Poverty rate: 31.6% (South Carolina: 14.4%)
- Median household income: $42,454 (South Carolina: $63,623)
- Adults with a bachelor’s degree or higher: 11.9% (South Carolina: 30.6%)
- 2022 unemployment rate: 4.6% (South Carolina: 3.2%)
- Total population: 28,255
- No. of counties considered in ranking: 46
South Dakota: Oglala Lakota County

- Poverty rate: 55.8% (South Dakota: 12.3%)
- Median household income: $32,279 (South Dakota: $69,457)
- Adults with a bachelor’s degree or higher: 8.1% (South Dakota: 30.4%)
- 2022 unemployment rate: 4.9% (South Dakota: 2.1%)
- Total population: 13,695
- No. of counties considered in ranking: 66
Tennessee: Hancock County

- Poverty rate: 32.3% (Tennessee: 14.0%)
- Median household income: $31,809 (Tennessee: $64,035)
- Adults with a bachelor’s degree or higher: 9.9% (Tennessee: 29.7%)
- 2022 unemployment rate: 4.2% (Tennessee: 3.4%)
- Total population: 6,726
- No. of counties considered in ranking: 95
Texas: Dimmit County

- Poverty rate: 43.6% (Texas: 13.9%)
- Median household income: $27,374 (Texas: $73,035)
- Adults with a bachelor’s degree or higher: 14.6% (Texas: 32.3%)
- 2022 unemployment rate: 3.8% (Texas: 3.9%)
- Total population: 8,672
- No. of counties considered in ranking: 246
Utah: Piute County

- Poverty rate: 20.9% (Utah: 8.5%)
- Median household income: $33,359 (Utah: $86,833)
- Adults with a bachelor’s degree or higher: 19.6% (Utah: 36.1%)
- 2022 unemployment rate: 4.1% (Utah: 2.3%)
- Total population: 1,764
- No. of counties considered in ranking: 28
Vermont: Essex County

- Poverty rate: 13.2% (Vermont: 10.4%)
- Median household income: $55,247 (Vermont: $74,014)
- Adults with a bachelor’s degree or higher: 20.2% (Vermont: 41.7%)
- 2022 unemployment rate: 4.0% (Vermont: 2.6%)
- Total population: 5,976
- No. of counties considered in ranking: 14
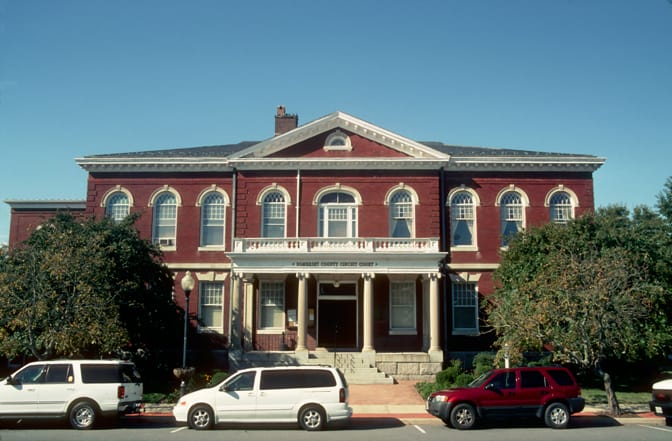
Virginia: Radford (independent city)

- Poverty rate: 33.8% (Virginia: 10.0%)
- Median household income: $51,039 (Virginia: $87,249)
- Adults with a bachelor’s degree or higher: 44.8% (Virginia: 41.0%)
- 2022 unemployment rate: 3.5% (Virginia: 2.9%)
- Total population: 16,379
- No. of counties and county equivalents considered in ranking: 133
Washington: Whitman County
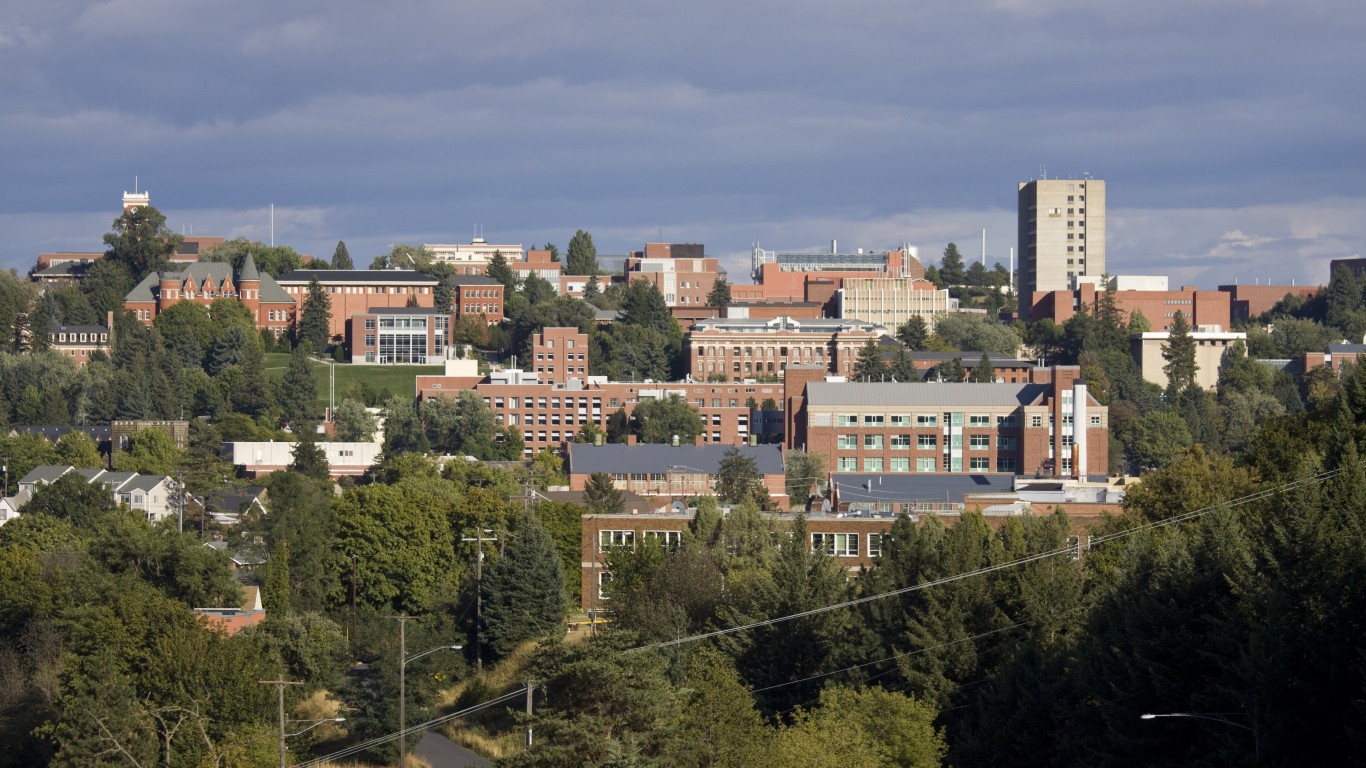
- Poverty rate: 23.9% (Washington: 9.9%)
- Median household income: $49,345 (Washington: $90,325)
- Adults with a bachelor’s degree or higher: 50.9% (Washington: 38.0%)
- 2022 unemployment rate: 4.7% (Washington: 4.2%)
- Total population: 47,141
- No. of counties considered in ranking: 39
West Virginia: Calhoun County
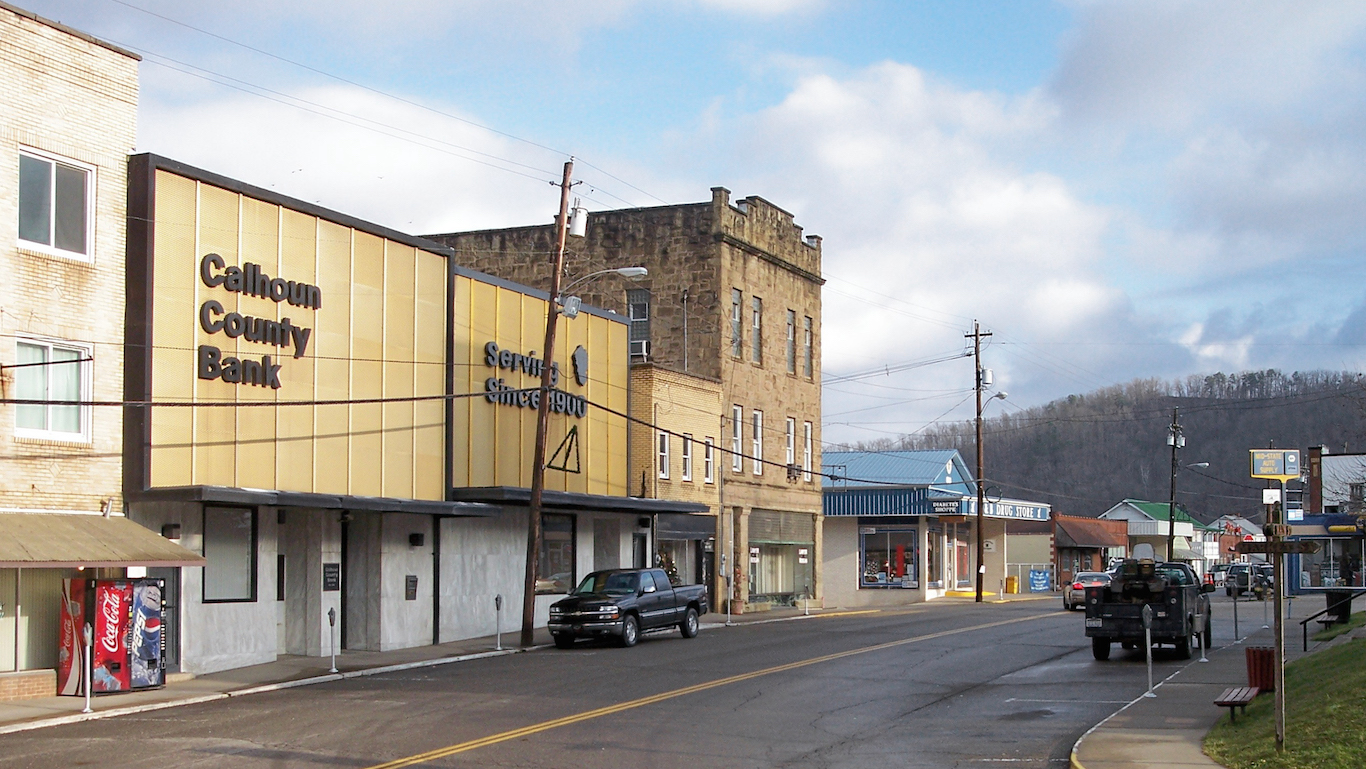
- Poverty rate: 33.7% (West Virginia: 16.8%)
- Median household income: $39,031 (West Virginia: $55,217)
- Adults with a bachelor’s degree or higher: 8.3% (West Virginia: 22.7%)
- 2022 unemployment rate: 8.2% (West Virginia: 3.9%)
- Total population: 6,279
- No. of counties considered in ranking: 55
Wisconsin: Menominee County

- Poverty rate: 20.0% (Wisconsin: 10.7%)
- Median household income: $62,194 (Wisconsin: $72,458)
- Adults with a bachelor’s degree or higher: 18.9% (Wisconsin: 32.0%)
- 2022 unemployment rate: 5.5% (Wisconsin: 2.9%)
- Total population: 4,279
- No. of counties considered in ranking: 72
Wyoming: Albany County

- Poverty rate: 23.0% (Wyoming: 10.7%)
- Median household income: $55,887 (Wyoming: $72,495)
- Adults with a bachelor’s degree or higher: 55.9% (Wyoming: 29.0%)
- 2022 unemployment rate: 3.1% (Wyoming: 3.6%)
- Total population: 37,525
- No. of counties considered in ranking: 23