Anybody who has been to college, or even searched for potential colleges, knows that higher education is expensive. As of June 2024, Americans had a collective $1.6 trillion in student loan debt — and that loan debt is outstanding for 36% of borrowers under 40 years old. With the rising cost of living and the rising cost of education, some people have decided to not pursue a college degree. Colleges are now offering free tuition to certain middle class families to attend. Still, it seems that colleges view the middle class as making upwards of six figures — where people who identify themselves as middle class typically make under $99,999 annually. The cost of inflation has significantly harmed the middle class around the country. Many people who consider themselves middle class are finding it harder to make ends meet — and it’s not just about education (Here is the poorest town in every American state.)
The average income of the middle class has also shrunk over time, from 62% in 1970. Alternately, those who consider themselves as upper class saw aggregate income increase from 29% to 50%. This is widening the divide between social classes, leading to a phenomenon known as “the missing middle.” So where do we see the middle class shrinking the most, and how is this affecting American progression? To determine the cities where the middle class is shrinking, 24/7 Wall St. reviewed five-year data on family income from the U.S. Census Bureau’s American Community Survey. Cities were ranked based on the percentage-point change in the share of family households residing in middle-income census tracts from 2012 to 2022. Middle-income census tracts were defined as census tracts in which the median family income is within 25% of the median family income for the city as a whole. Only census tracts that spatially overlap with city boundaries by at least 50% were considered. Census tract and place boundaries were sourced from the U.S. Census Bureau. Only cities with at least 150,000 residents were considered in our analysis.
Why We’re Discussing the Middle Class

For as long as many people can remember, the middle class has represented the backbone of American society. But this is becoming less and less commonly the case. The middle class’ decline in different cities represents significant changes. This trend often signals some level of income inequality, with more stratification between high-earning and low-earning workers. These changes can also affect everything from the education system to the job market, affecting how the city itself grows and progresses.
The middle class is shrinking in these 40 cities:
40. New Orleans, Louisiana

- Change in share of families in middle-income tracts, 2012 to 2022: -2.7 ppts.
- Change in share of families in upper-income tracts, 2012 to 2022: +8.0 ppts.
- Change in share of families in lower-income tracts, 2012 to 2022: -5.3 ppts.
- Median family income, 2022: $73,549
- Total population, 2022: 380,408
39. Pembroke Pines, Florida
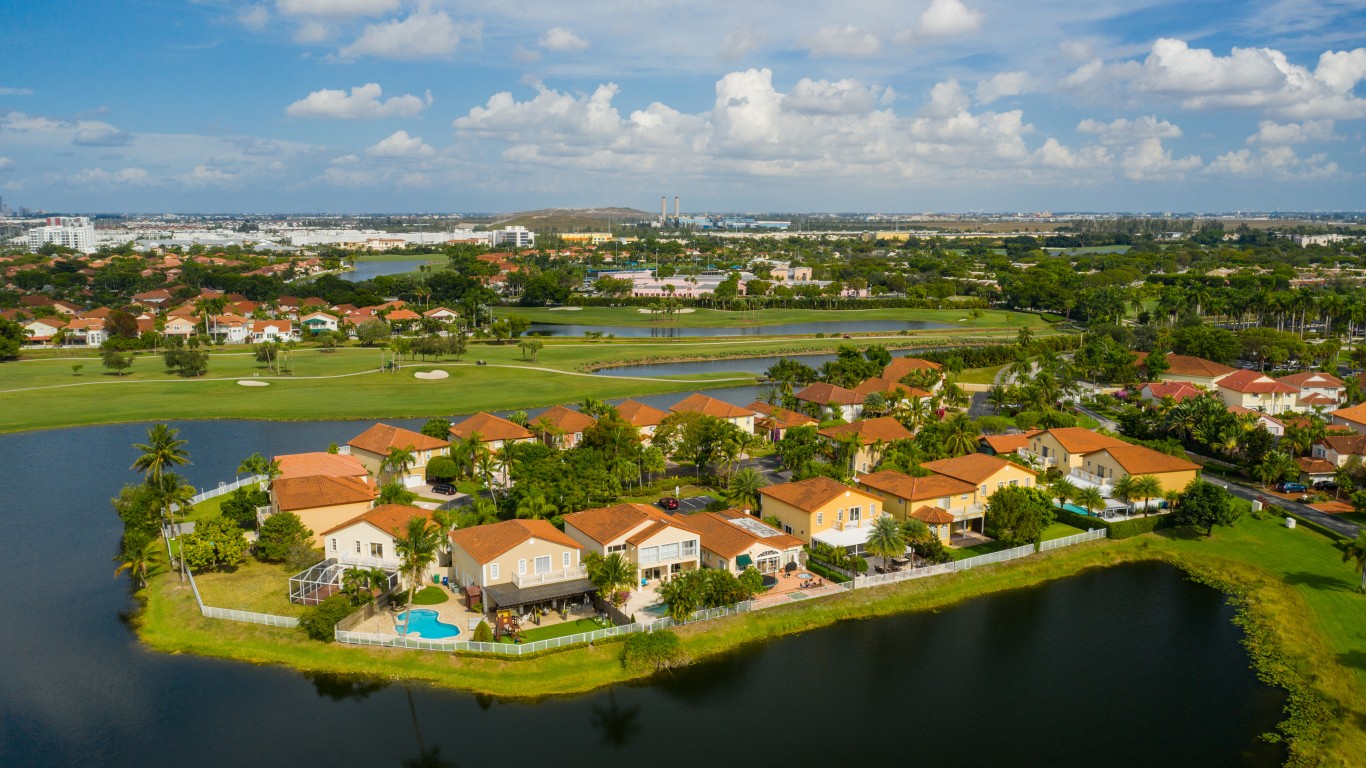
- Change in share of families in middle-income tracts, 2012 to 2022: -2.8 ppts.
- Change in share of families in upper-income tracts, 2012 to 2022: -1.9 ppts.
- Change in share of families in lower-income tracts, 2012 to 2022: +4.6 ppts.
- Median family income, 2022: $94,525
- Total population, 2022: 170,472
38. Des Moines, Iowa

- Change in share of families in middle-income tracts, 2012 to 2022: -2.9 ppts.
- Change in share of families in upper-income tracts, 2012 to 2022: -1.8 ppts.
- Change in share of families in lower-income tracts, 2012 to 2022: +4.7 ppts.
- Median family income, 2022: $76,602
- Total population, 2022: 213,164
37. Portland, Oregon
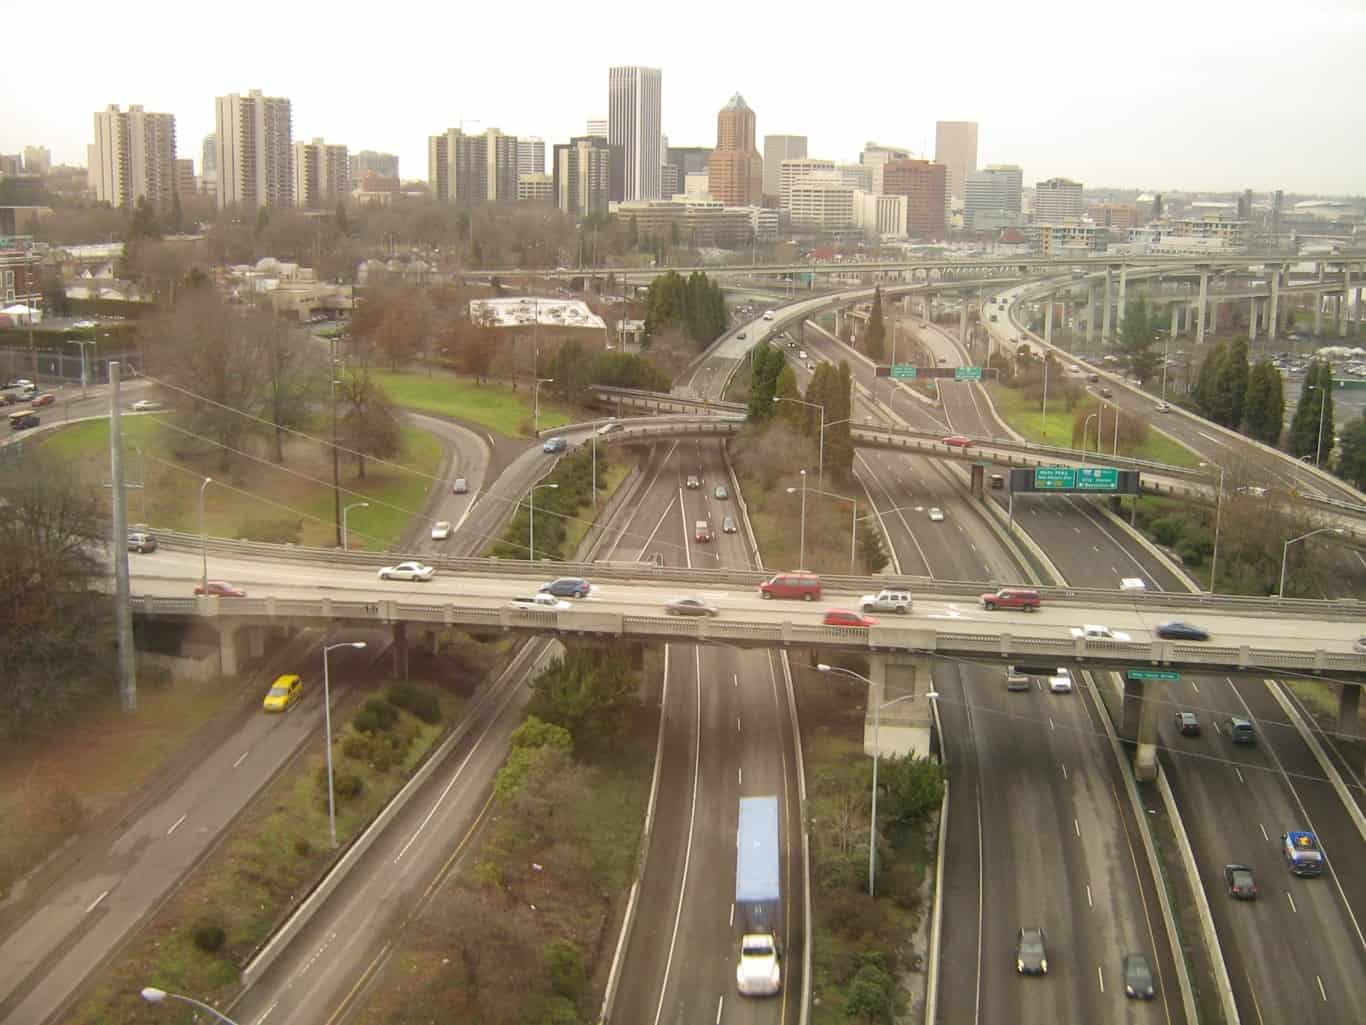
- Change in share of families in middle-income tracts, 2012 to 2022: -3.0 ppts.
- Change in share of families in upper-income tracts, 2012 to 2022: +2.7 ppts.
- Change in share of families in lower-income tracts, 2012 to 2022: +0.3 ppts.
- Median family income, 2022: $116,103
- Total population, 2022: 646,101
36. El Paso, Texas
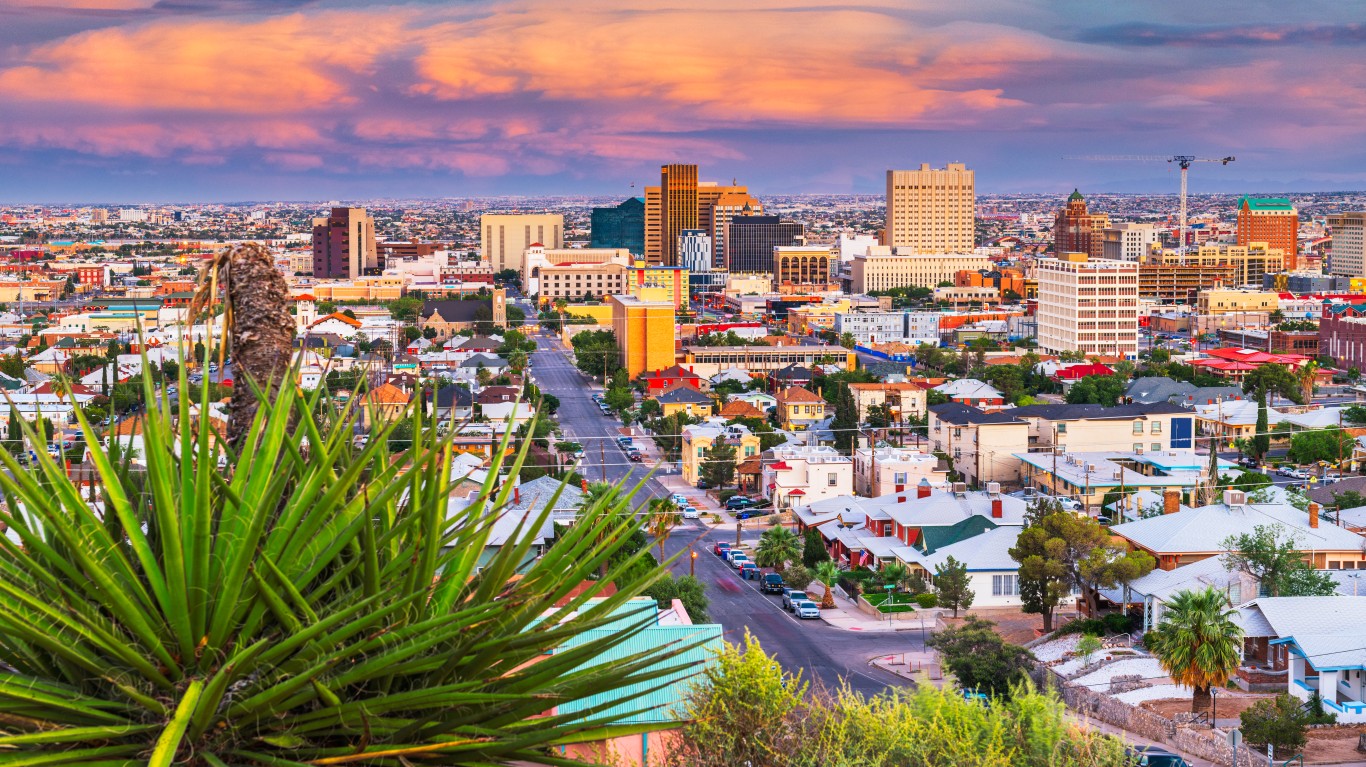
- Change in share of families in middle-income tracts, 2012 to 2022: -3.0 ppts.
- Change in share of families in upper-income tracts, 2012 to 2022: -2.3 ppts.
- Change in share of families in lower-income tracts, 2012 to 2022: +5.3 ppts.
- Median family income, 2022: $63,067
- Total population, 2022: 677,181
35. Santa Rosa, California
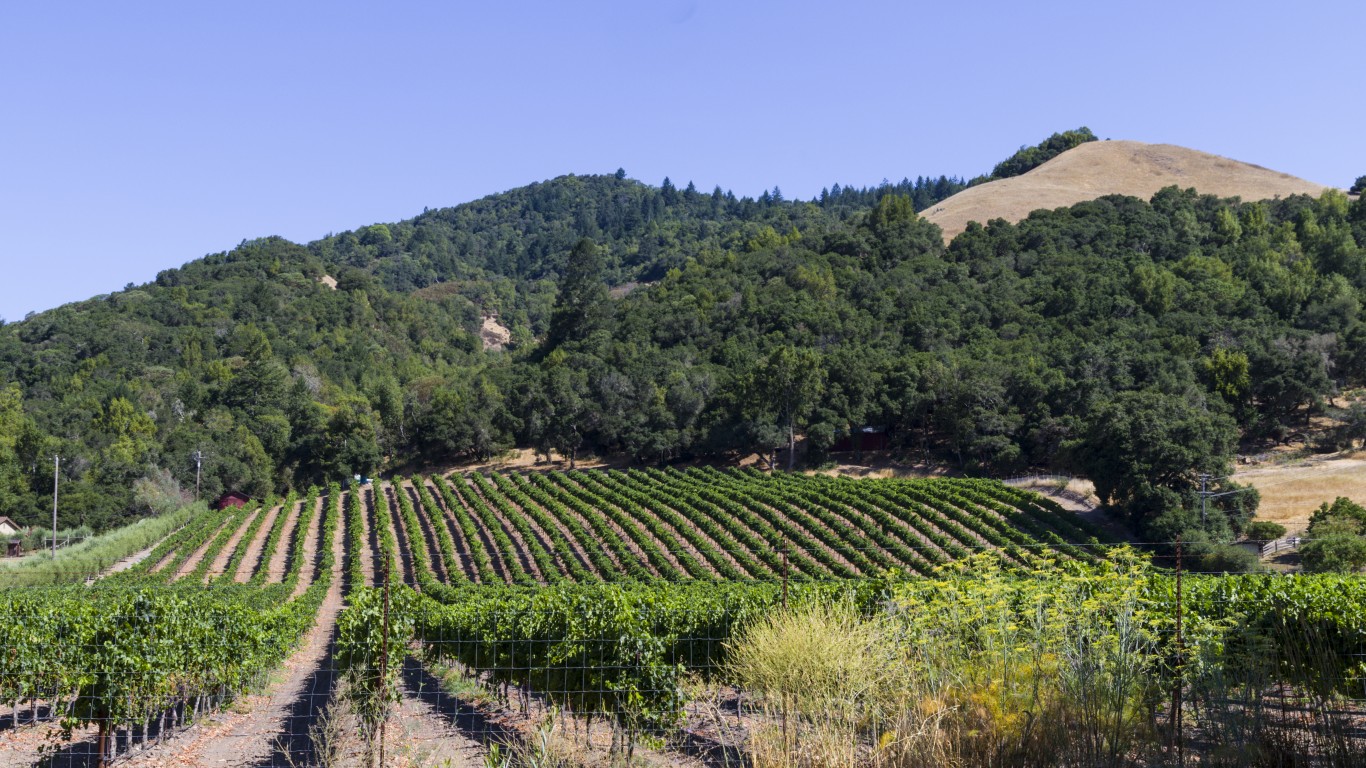
- Change in share of families in middle-income tracts, 2012 to 2022: -3.2 ppts.
- Change in share of families in upper-income tracts, 2012 to 2022: +10.6 ppts.
- Change in share of families in lower-income tracts, 2012 to 2022: -7.4 ppts.
- Median family income, 2022: $110,196
- Total population, 2022: 178,221
34. Escondido, California
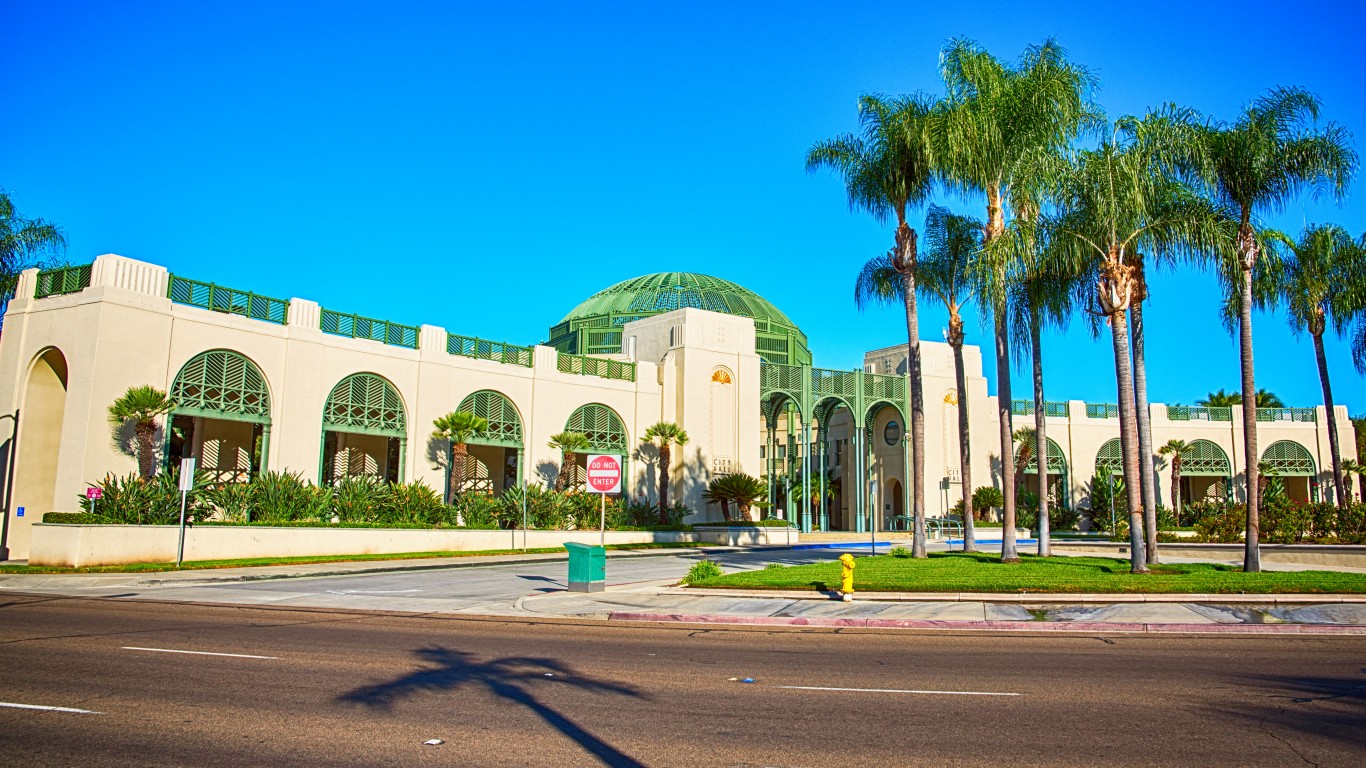
- Change in share of families in middle-income tracts, 2012 to 2022: -3.3 ppts.
- Change in share of families in upper-income tracts, 2012 to 2022: -3.7 ppts.
- Change in share of families in lower-income tracts, 2012 to 2022: +7.0 ppts.
- Median family income, 2022: $89,970
- Total population, 2022: 151,114
33. Peoria, Arizona
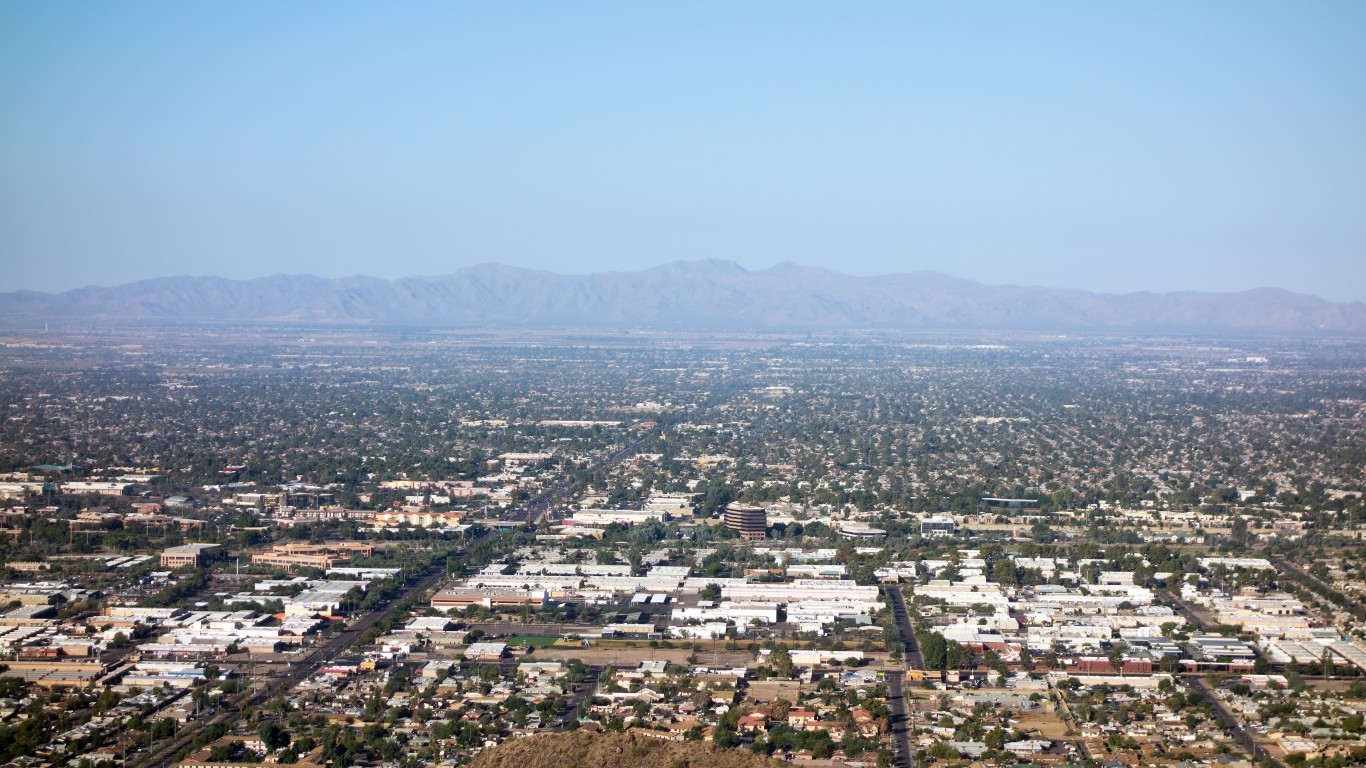
- Change in share of families in middle-income tracts, 2012 to 2022: -3.3 ppts.
- Change in share of families in upper-income tracts, 2012 to 2022: +3.2 ppts.
- Change in share of families in lower-income tracts, 2012 to 2022: +0.1 ppts.
- Median family income, 2022: $102,661
- Total population, 2022: 191,292
32. Glendale, Arizona

- Change in share of families in middle-income tracts, 2012 to 2022: -3.4 ppts.
- Change in share of families in upper-income tracts, 2012 to 2022: +6.0 ppts.
- Change in share of families in lower-income tracts, 2012 to 2022: -2.6 ppts.
- Median family income, 2022: $77,602
- Total population, 2022: 248,083
31. Jackson, Mississippi

- Change in share of families in middle-income tracts, 2012 to 2022: -3.6 ppts.
- Change in share of families in upper-income tracts, 2012 to 2022: +1.0 ppts.
- Change in share of families in lower-income tracts, 2012 to 2022: +2.6 ppts.
- Median family income, 2022: $52,443
- Total population, 2022: 153,271
30. Boston, Massachusetts

- Change in share of families in middle-income tracts, 2012 to 2022: -3.6 ppts.
- Change in share of families in upper-income tracts, 2012 to 2022: +4.6 ppts.
- Change in share of families in lower-income tracts, 2012 to 2022: -1.0 ppts.
- Median family income, 2022: $106,015
- Total population, 2022: 665,945
29. Madison, Wisconsin
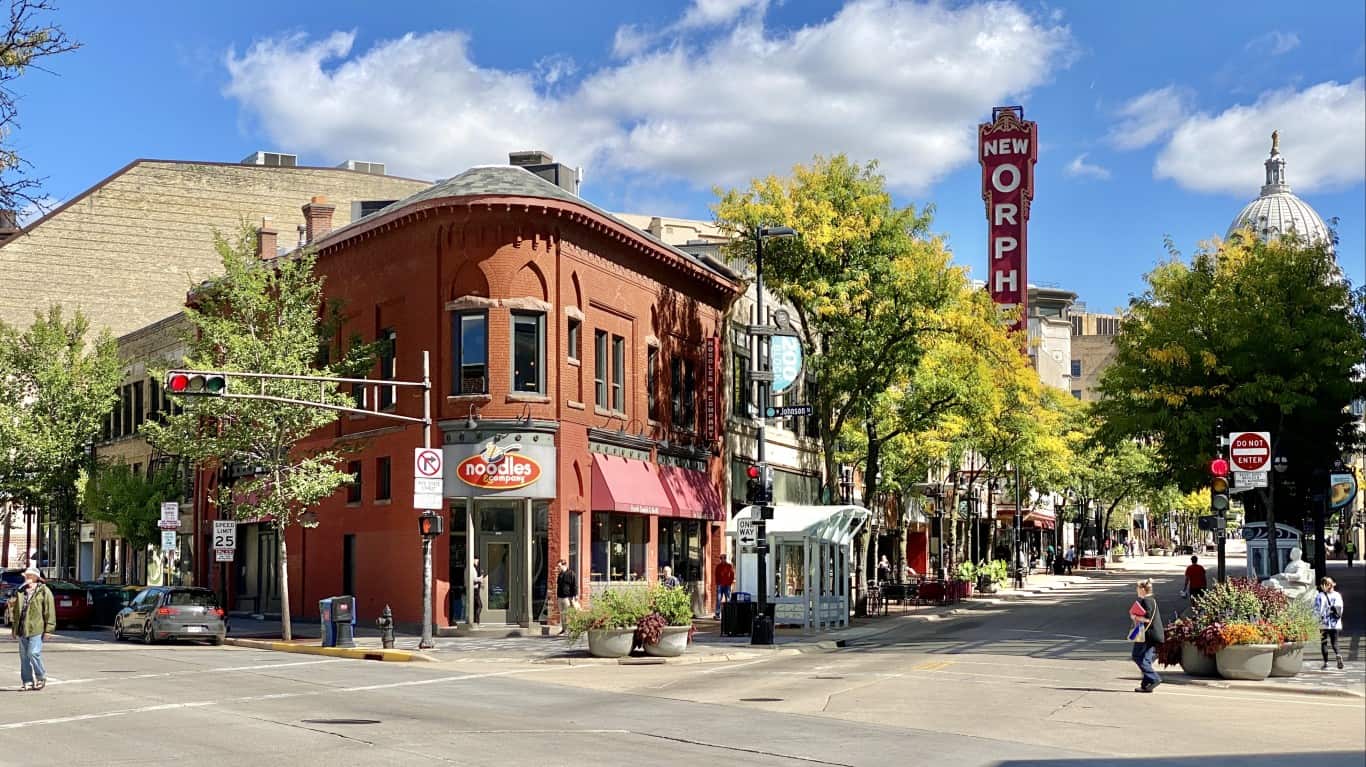
- Change in share of families in middle-income tracts, 2012 to 2022: -4.0 ppts.
- Change in share of families in upper-income tracts, 2012 to 2022: +1.5 ppts.
- Change in share of families in lower-income tracts, 2012 to 2022: +2.6 ppts.
- Median family income, 2022: $111,576
- Total population, 2022: 268,516
28. Spring Valley, Nevada
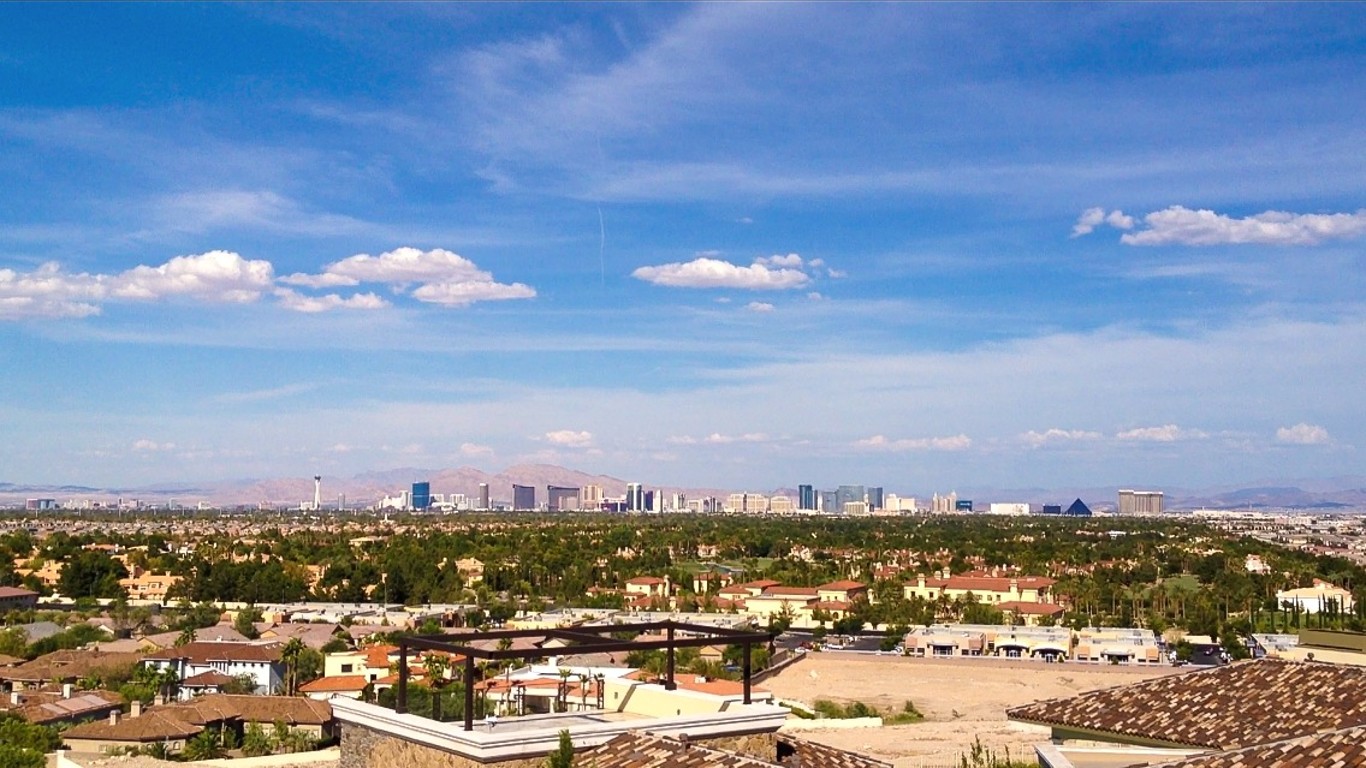
- Change in share of families in middle-income tracts, 2012 to 2022: -4.8 ppts.
- Change in share of families in upper-income tracts, 2012 to 2022: -2.7 ppts.
- Change in share of families in lower-income tracts, 2012 to 2022: +7.4 ppts.
- Median family income, 2022: $79,763
- Total population, 2022: 220,114
27. Birmingham, Alabama

- Change in share of families in middle-income tracts, 2012 to 2022: -5.1 ppts.
- Change in share of families in upper-income tracts, 2012 to 2022: -3.6 ppts.
- Change in share of families in lower-income tracts, 2012 to 2022: +8.7 ppts.
- Median family income, 2022: $55,541
- Total population, 2022: 200,431
26. Baton Rouge, Louisiana
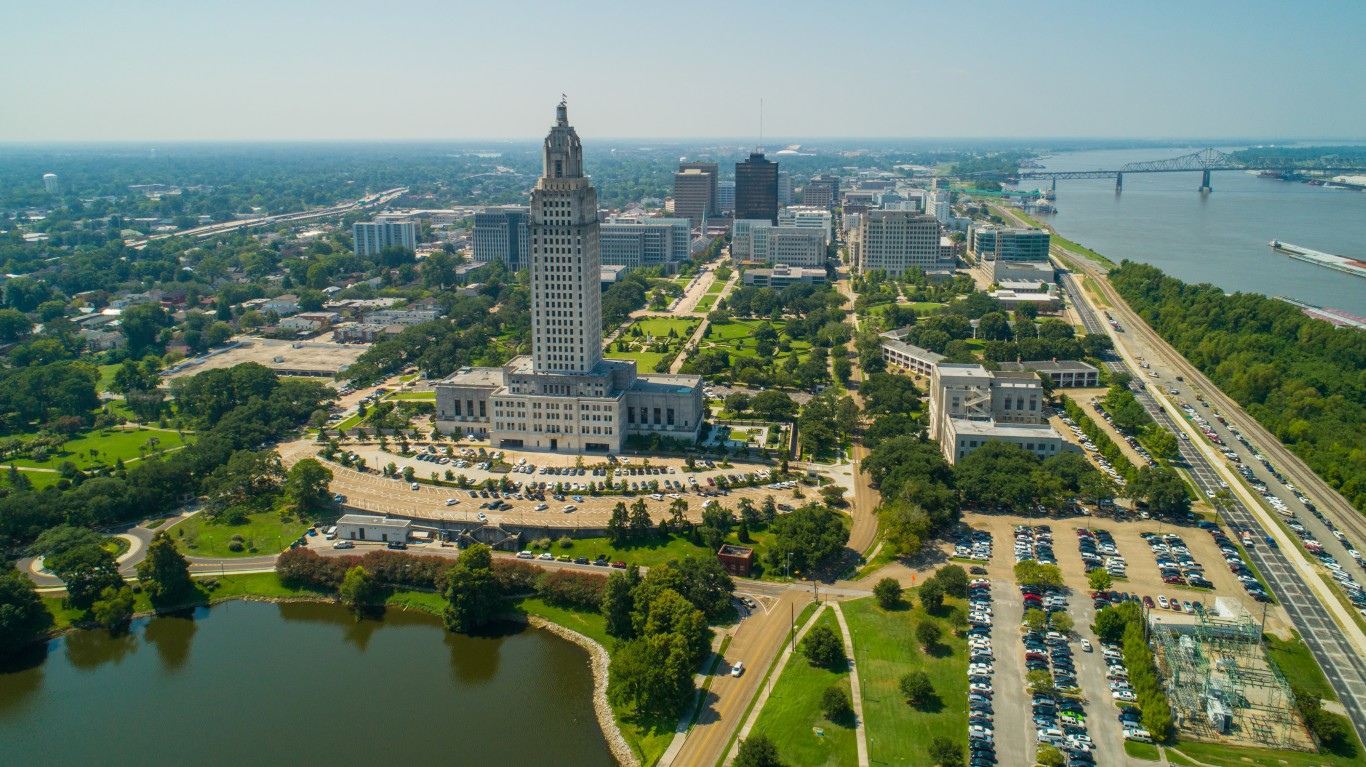
- Change in share of families in middle-income tracts, 2012 to 2022: -5.3 ppts.
- Change in share of families in upper-income tracts, 2012 to 2022: +3.4 ppts.
- Change in share of families in lower-income tracts, 2012 to 2022: +1.9 ppts.
- Median family income, 2022: $68,228
- Total population, 2022: 225,500
25. Chesapeake, Virginia
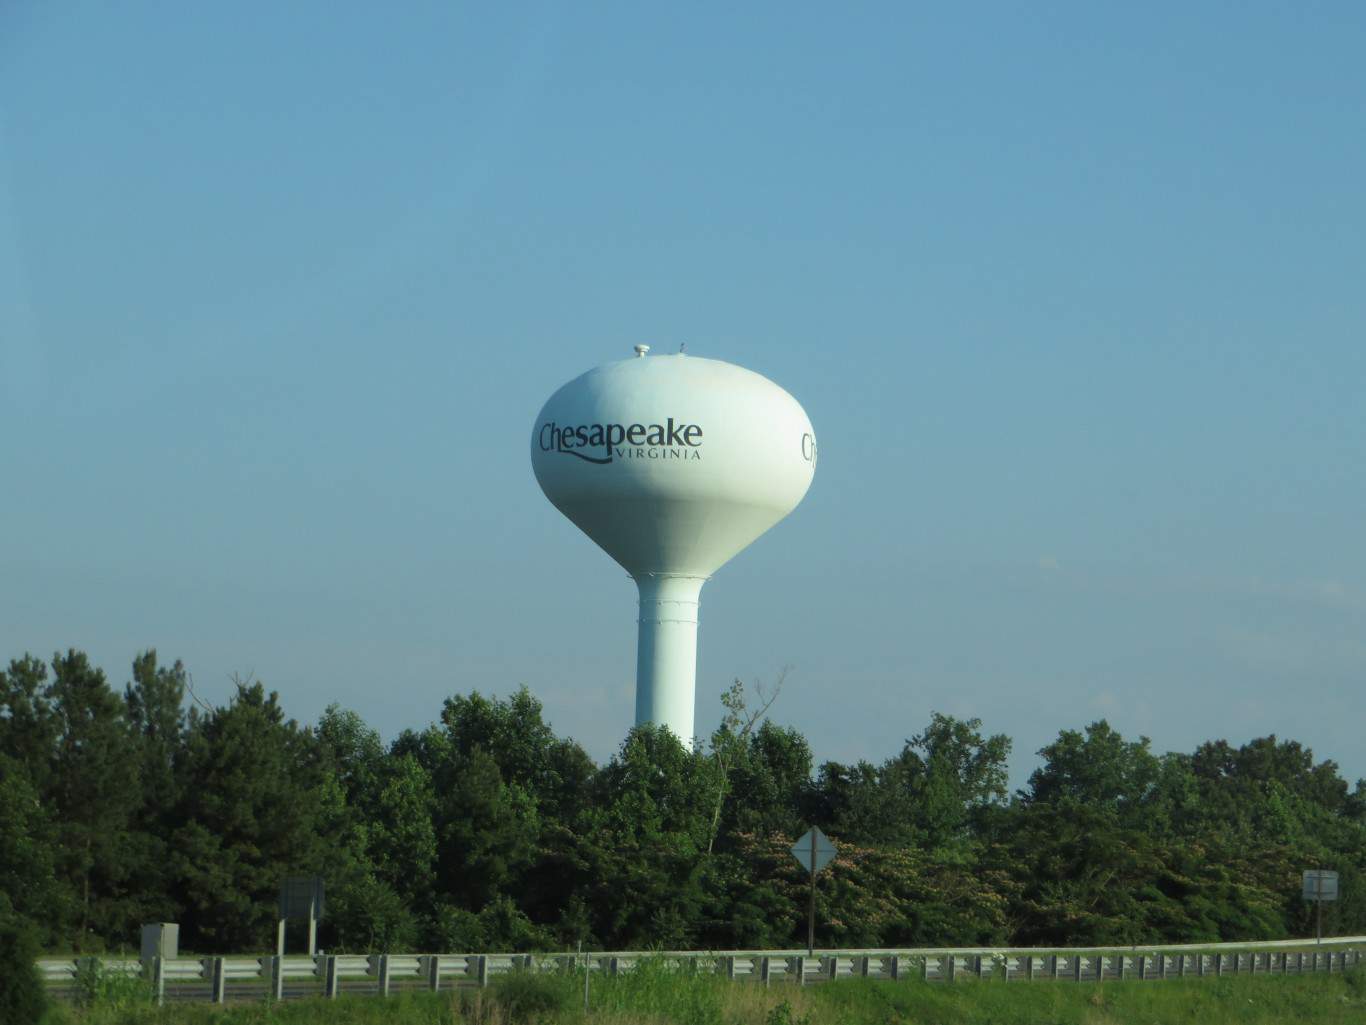
- Change in share of families in middle-income tracts, 2012 to 2022: -5.4 ppts.
- Change in share of families in upper-income tracts, 2012 to 2022: +6.3 ppts.
- Change in share of families in lower-income tracts, 2012 to 2022: -0.9 ppts.
- Median family income, 2022: $109,923
- Total population, 2022: 249,377
24. Atlanta, Georgia

- Change in share of families in middle-income tracts, 2012 to 2022: -5.6 ppts.
- Change in share of families in upper-income tracts, 2012 to 2022: +11.9 ppts.
- Change in share of families in lower-income tracts, 2012 to 2022: -6.3 ppts.
- Median family income, 2022: $103,886
- Total population, 2022: 494,838
23. Fayetteville, North Carolina
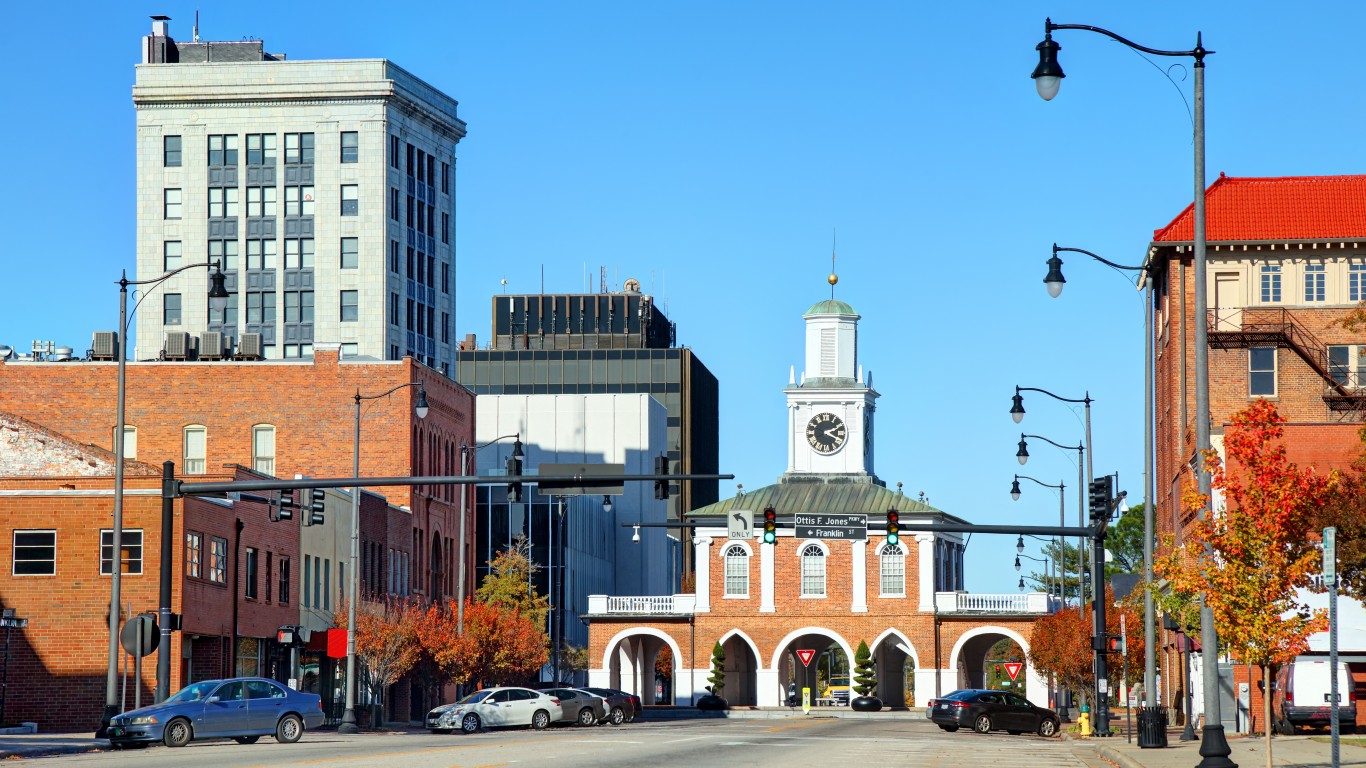
- Change in share of families in middle-income tracts, 2012 to 2022: -5.7 ppts.
- Change in share of families in upper-income tracts, 2012 to 2022: +8.4 ppts.
- Change in share of families in lower-income tracts, 2012 to 2022: -2.8 ppts.
- Median family income, 2022: $63,485
- Total population, 2022: 208,697
22. Corpus Christi, Texas
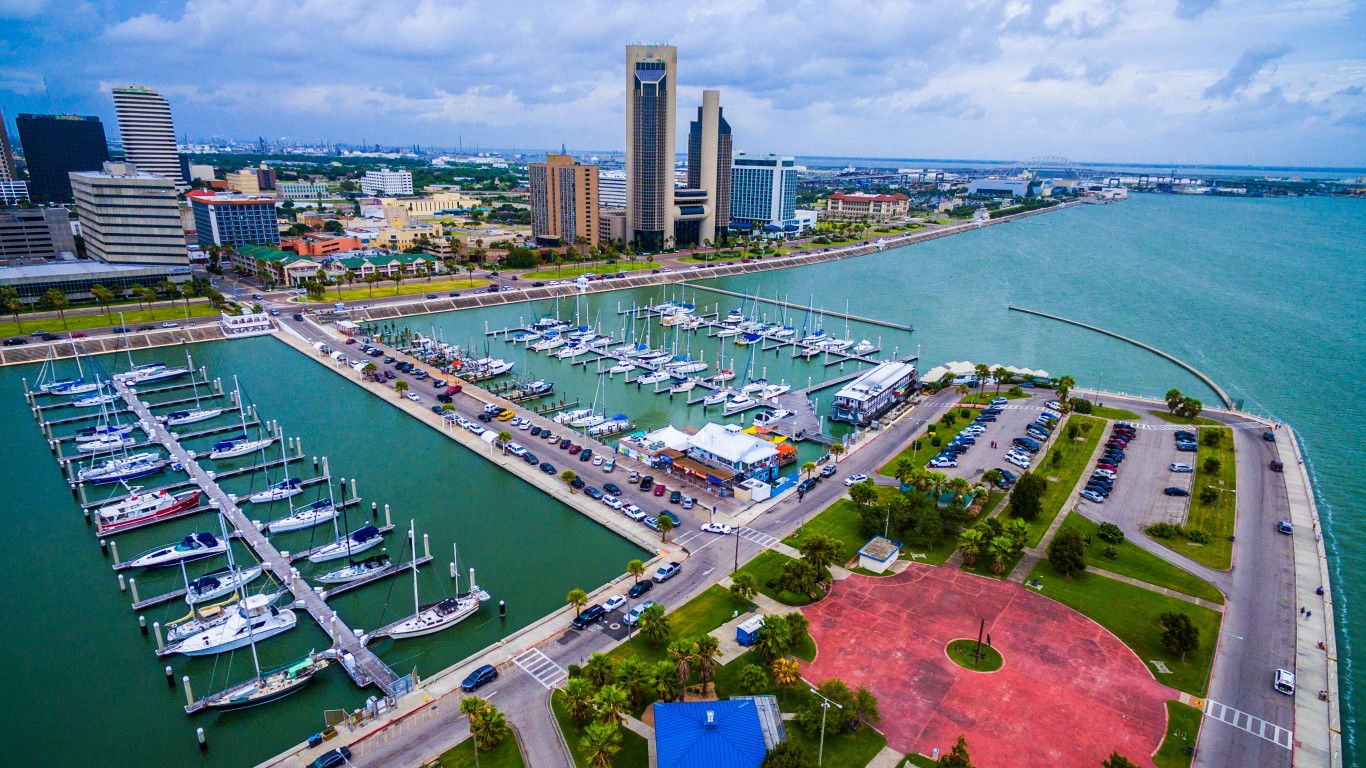
- Change in share of families in middle-income tracts, 2012 to 2022: -6.0 ppts.
- Change in share of families in upper-income tracts, 2012 to 2022: +3.5 ppts.
- Change in share of families in lower-income tracts, 2012 to 2022: +2.5 ppts.
- Median family income, 2022: $78,428
- Total population, 2022: 317,804
21. Amarillo, Texas

- Change in share of families in middle-income tracts, 2012 to 2022: -6.7 ppts.
- Change in share of families in upper-income tracts, 2012 to 2022: -0.2 ppts.
- Change in share of families in lower-income tracts, 2012 to 2022: +6.9 ppts.
- Median family income, 2022: $76,749
- Total population, 2022: 200,360
20. Henderson, Nevada

- Change in share of families in middle-income tracts, 2012 to 2022: -8.1 ppts.
- Change in share of families in upper-income tracts, 2012 to 2022: +0.0 ppts.
- Change in share of families in lower-income tracts, 2012 to 2022: +8.0 ppts.
- Median family income, 2022: $100,794
- Total population, 2022: 318,063
19. Santa Ana, California
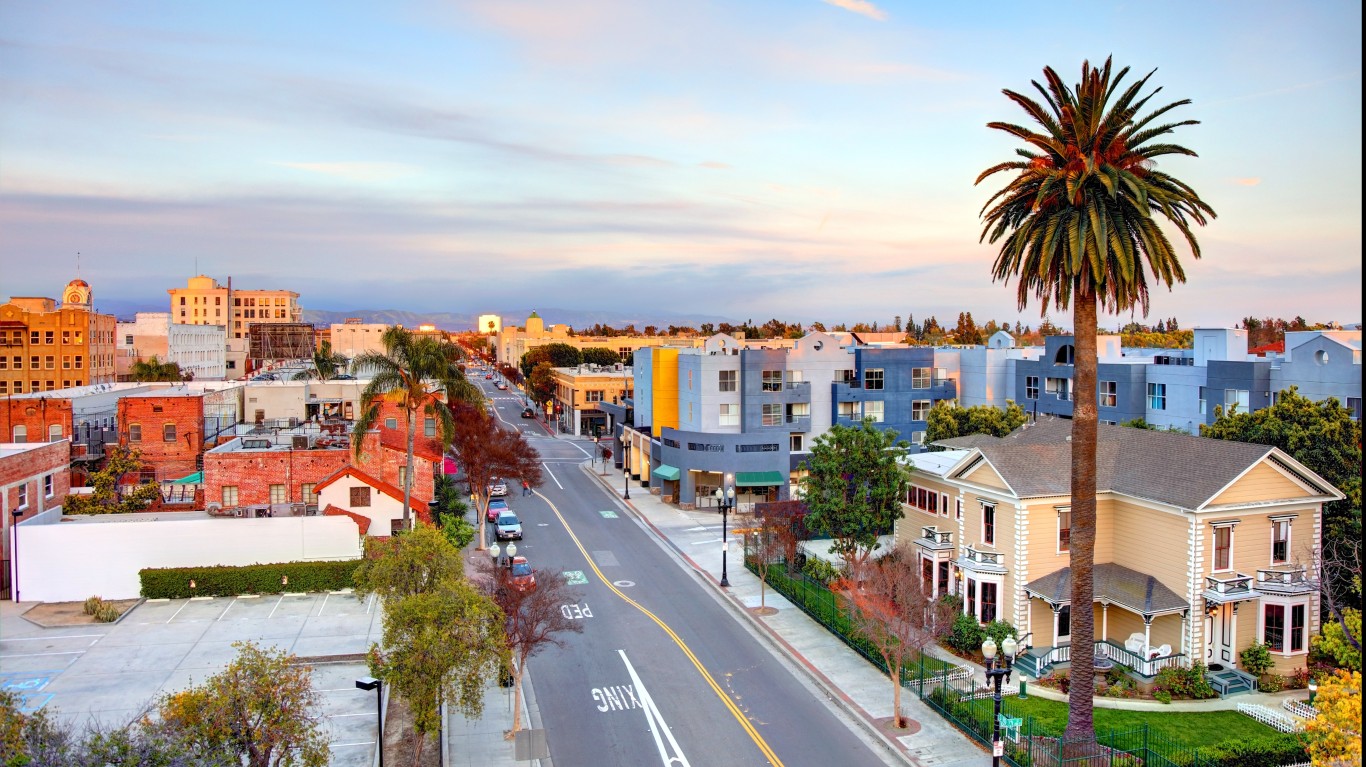
- Change in share of families in middle-income tracts, 2012 to 2022: -8.3 ppts.
- Change in share of families in upper-income tracts, 2012 to 2022: +2.3 ppts.
- Change in share of families in lower-income tracts, 2012 to 2022: +6.0 ppts.
- Median family income, 2022: $83,689
- Total population, 2022: 311,379
18. Newport News, Virginia

- Change in share of families in middle-income tracts, 2012 to 2022: -8.8 ppts.
- Change in share of families in upper-income tracts, 2012 to 2022: +0.8 ppts.
- Change in share of families in lower-income tracts, 2012 to 2022: +8.0 ppts.
- Median family income, 2022: $77,483
- Total population, 2022: 185,118
17. Hialeah, Florida
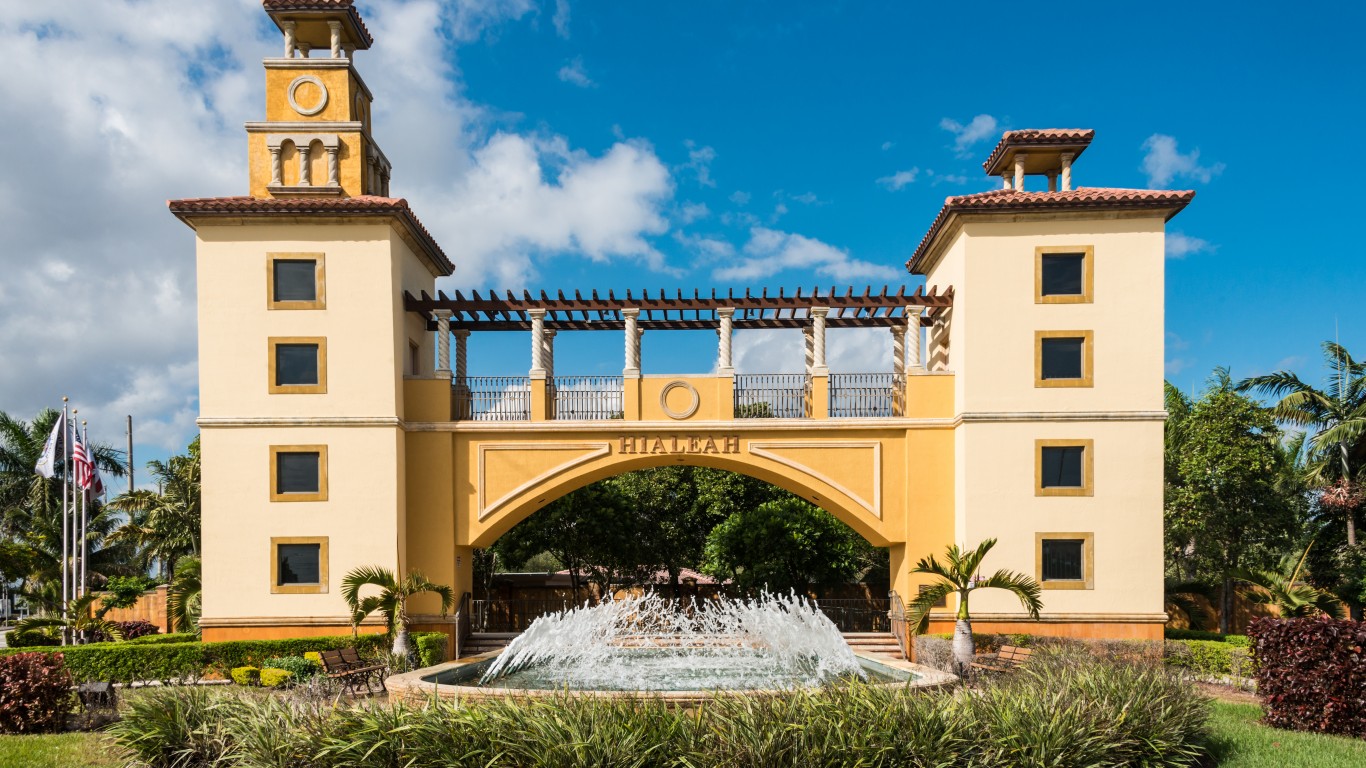
- Change in share of families in middle-income tracts, 2012 to 2022: -9.0 ppts.
- Change in share of families in upper-income tracts, 2012 to 2022: +9.5 ppts.
- Change in share of families in lower-income tracts, 2012 to 2022: -0.5 ppts.
- Median family income, 2022: $55,066
- Total population, 2022: 222,996
16. Augusta, Georgia
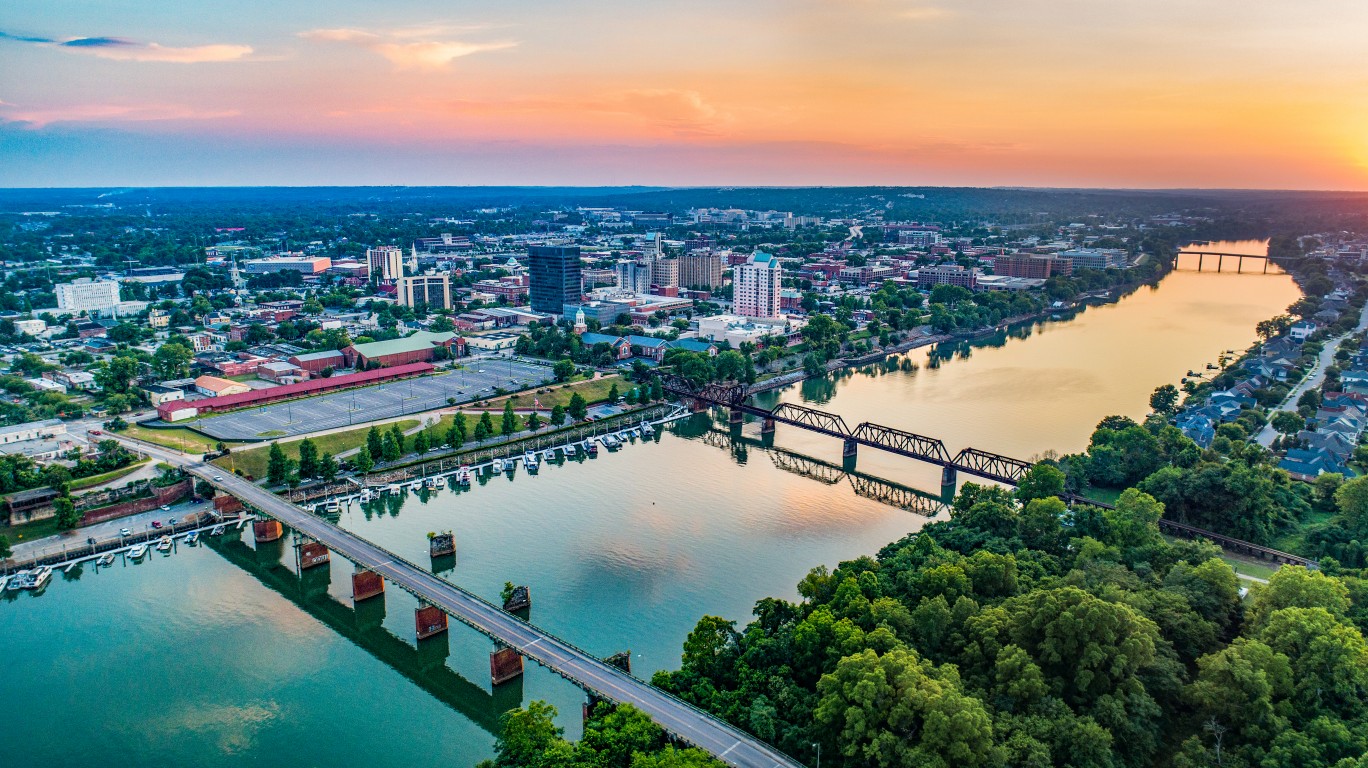
- Change in share of families in middle-income tracts, 2012 to 2022: -10.0 ppts.
- Change in share of families in upper-income tracts, 2012 to 2022: -0.4 ppts.
- Change in share of families in lower-income tracts, 2012 to 2022: +10.4 ppts.
- Median family income, 2022: $60,664
- Total population, 2022: 201,615
15. Tulsa, Oklahoma

- Change in share of families in middle-income tracts, 2012 to 2022: -10.0 ppts.
- Change in share of families in upper-income tracts, 2012 to 2022: +2.7 ppts.
- Change in share of families in lower-income tracts, 2012 to 2022: +7.4 ppts.
- Median family income, 2022: $74,430
- Total population, 2022: 411,938
14. Irvine, California
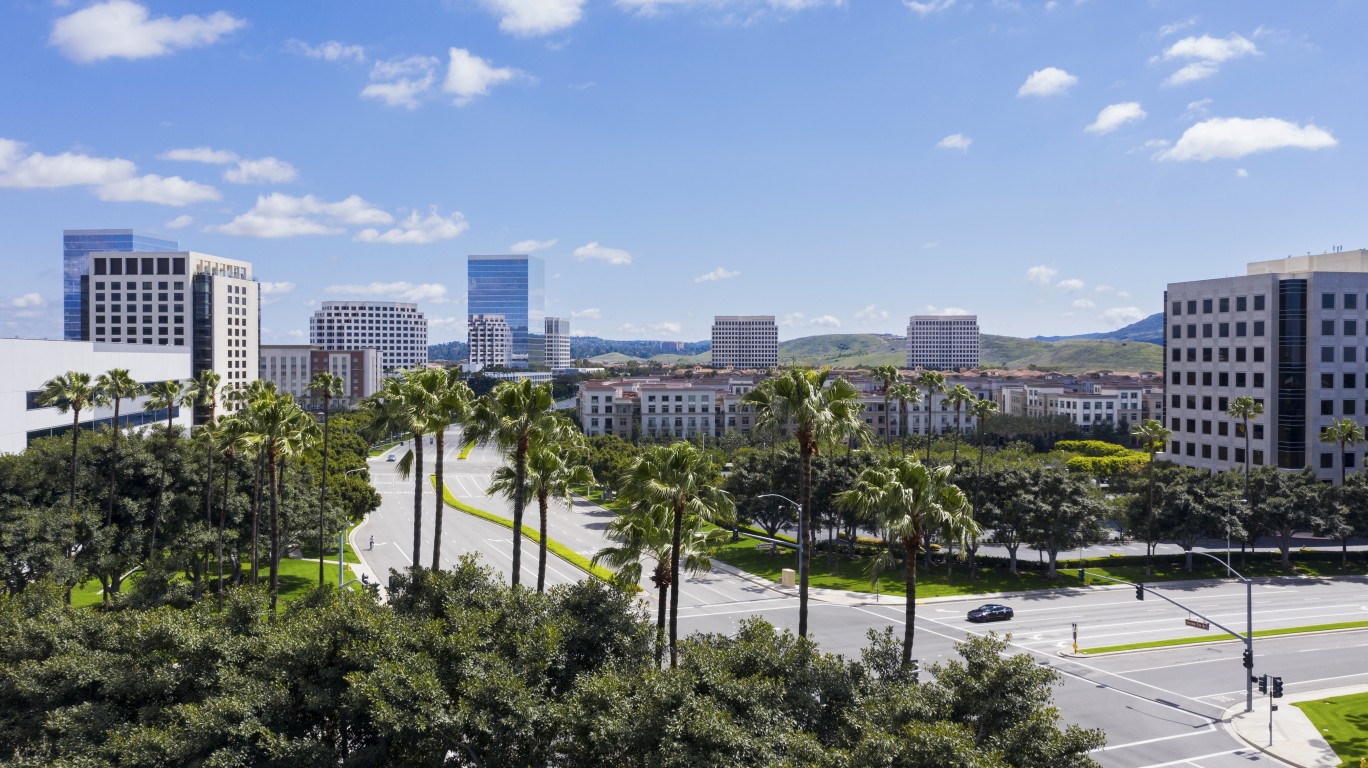
- Change in share of families in middle-income tracts, 2012 to 2022: -10.2 ppts.
- Change in share of families in upper-income tracts, 2012 to 2022: +3.3 ppts.
- Change in share of families in lower-income tracts, 2012 to 2022: +6.9 ppts.
- Median family income, 2022: $153,615
- Total population, 2022: 304,527
13. Sunnyvale, California
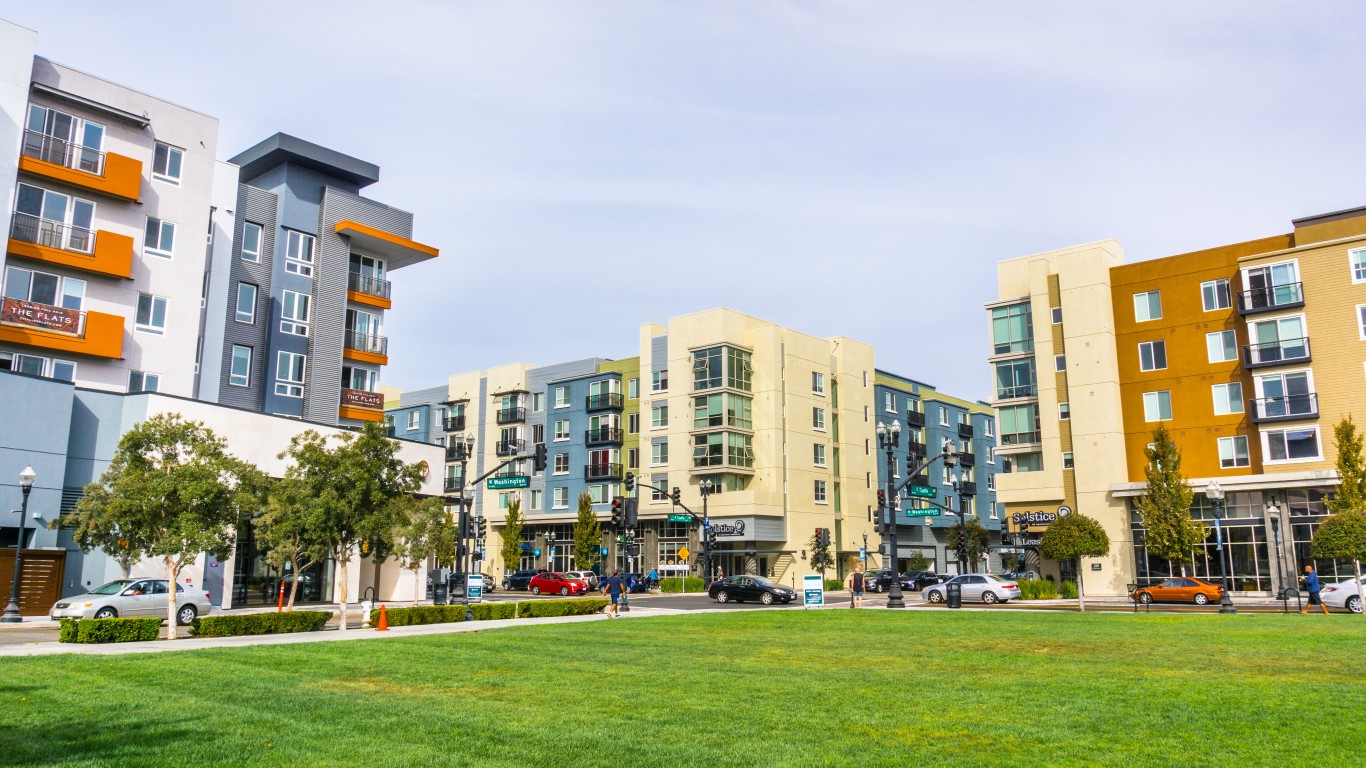
- Change in share of families in middle-income tracts, 2012 to 2022: -10.4 ppts.
- Change in share of families in upper-income tracts, 2012 to 2022: -3.2 ppts.
- Change in share of families in lower-income tracts, 2012 to 2022: +13.5 ppts.
- Median family income, 2022: $190,031
- Total population, 2022: 154,573
12. Oxnard, California
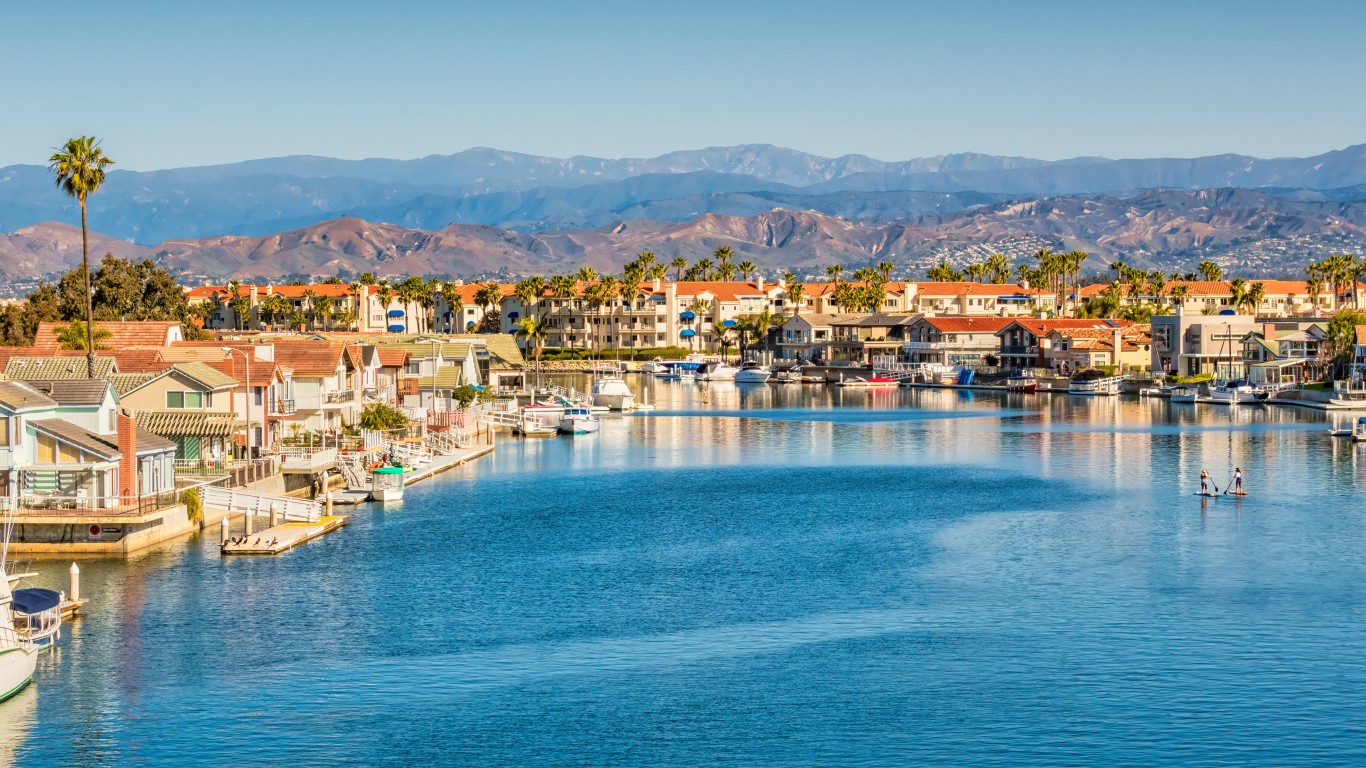
- Change in share of families in middle-income tracts, 2012 to 2022: -11.3 ppts.
- Change in share of families in upper-income tracts, 2012 to 2022: +0.5 ppts.
- Change in share of families in lower-income tracts, 2012 to 2022: +10.8 ppts.
- Median family income, 2022: $89,908
- Total population, 2022: 202,279
11. Tampa, Florida

- Change in share of families in middle-income tracts, 2012 to 2022: -11.6 ppts.
- Change in share of families in upper-income tracts, 2012 to 2022: +11.0 ppts.
- Change in share of families in lower-income tracts, 2012 to 2022: +0.6 ppts.
- Median family income, 2022: $84,185
- Total population, 2022: 388,768
10. Urban Honolulu, Hawaii

- Change in share of families in middle-income tracts, 2012 to 2022: -12.1 ppts.
- Change in share of families in upper-income tracts, 2012 to 2022: +8.1 ppts.
- Change in share of families in lower-income tracts, 2012 to 2022: +4.0 ppts.
- Median family income, 2022: $106,192
- Total population, 2022: 348,547
9. Paradise, Nevada

- Change in share of families in middle-income tracts, 2012 to 2022: -12.5 ppts.
- Change in share of families in upper-income tracts, 2012 to 2022: +13.8 ppts.
- Change in share of families in lower-income tracts, 2012 to 2022: -1.3 ppts.
- Median family income, 2022: $68,168
- Total population, 2022: 189,733
8. Anchorage, Alaska
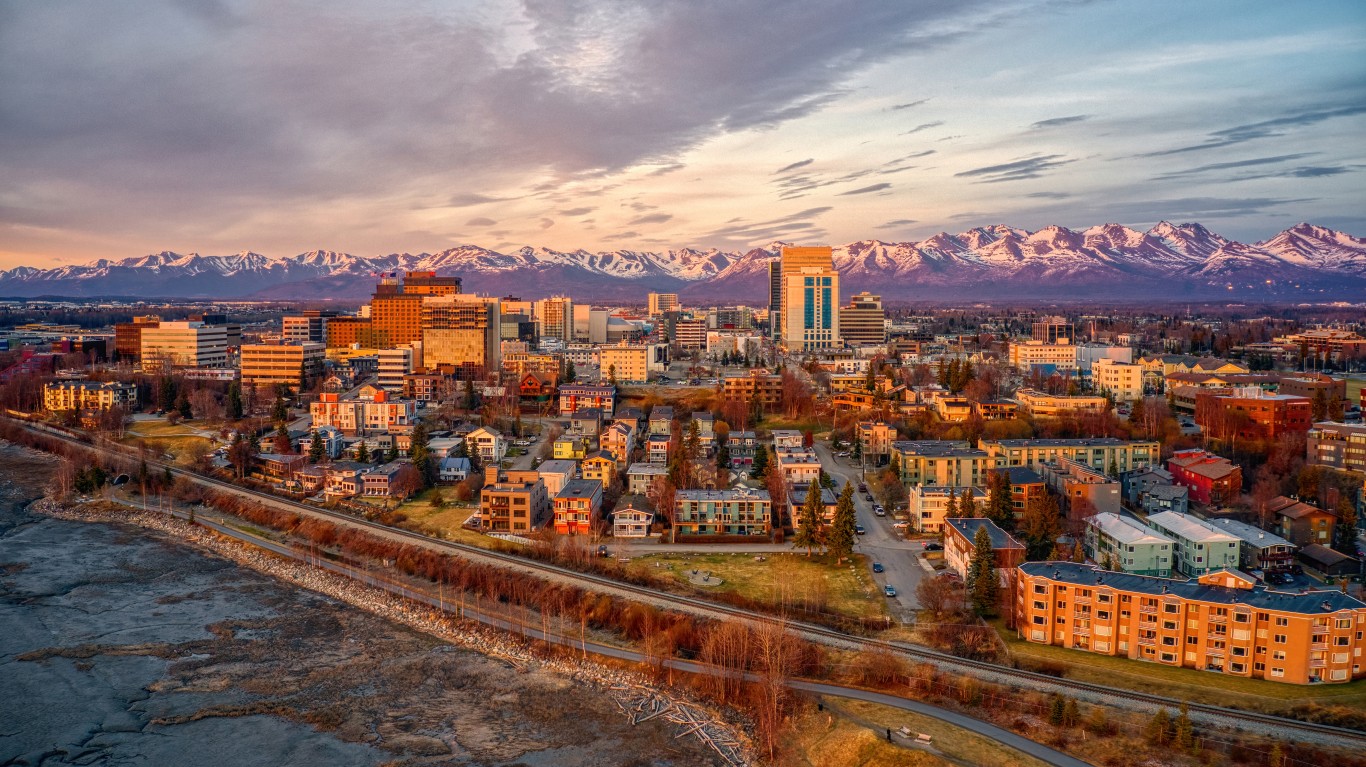
- Change in share of families in middle-income tracts, 2012 to 2022: -12.7 ppts.
- Change in share of families in upper-income tracts, 2012 to 2022: +9.4 ppts.
- Change in share of families in lower-income tracts, 2012 to 2022: +3.3 ppts.
- Median family income, 2022: $115,272
- Total population, 2022: 290,674
7. Paterson, New Jersey
- Change in share of families in middle-income tracts, 2012 to 2022: -12.8 ppts.
- Change in share of families in upper-income tracts, 2012 to 2022: +4.4 ppts.
- Change in share of families in lower-income tracts, 2012 to 2022: +8.4 ppts.
- Median family income, 2022: $59,976
- Total population, 2022: 157,864
6. Orlando, Florida

- Change in share of families in middle-income tracts, 2012 to 2022: -12.9 ppts.
- Change in share of families in upper-income tracts, 2012 to 2022: +6.5 ppts.
- Change in share of families in lower-income tracts, 2012 to 2022: +6.4 ppts.
- Median family income, 2022: $74,980
- Total population, 2022: 307,738
5. Clarksville, Tennessee
- Change in share of families in middle-income tracts, 2012 to 2022: -14.0 ppts.
- Change in share of families in upper-income tracts, 2012 to 2022: +5.8 ppts.
- Change in share of families in lower-income tracts, 2012 to 2022: +8.3 ppts.
- Median family income, 2022: $73,333
- Total population, 2022: 167,882
4. Laredo, Texas
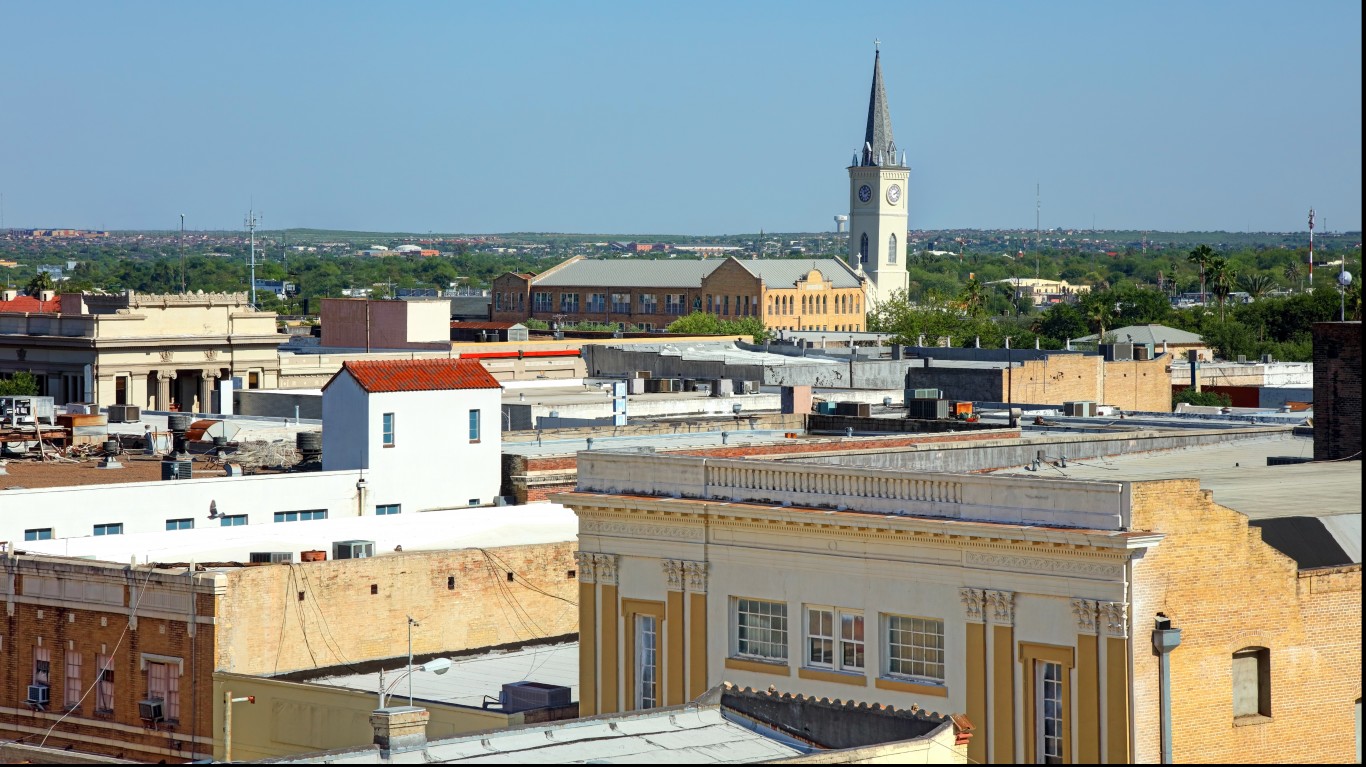
- Change in share of families in middle-income tracts, 2012 to 2022: -15.6 ppts.
- Change in share of families in upper-income tracts, 2012 to 2022: +5.4 ppts.
- Change in share of families in lower-income tracts, 2012 to 2022: +10.2 ppts.
- Median family income, 2022: $66,315
- Total population, 2022: 255,293
3. Fort Lauderdale, Florida
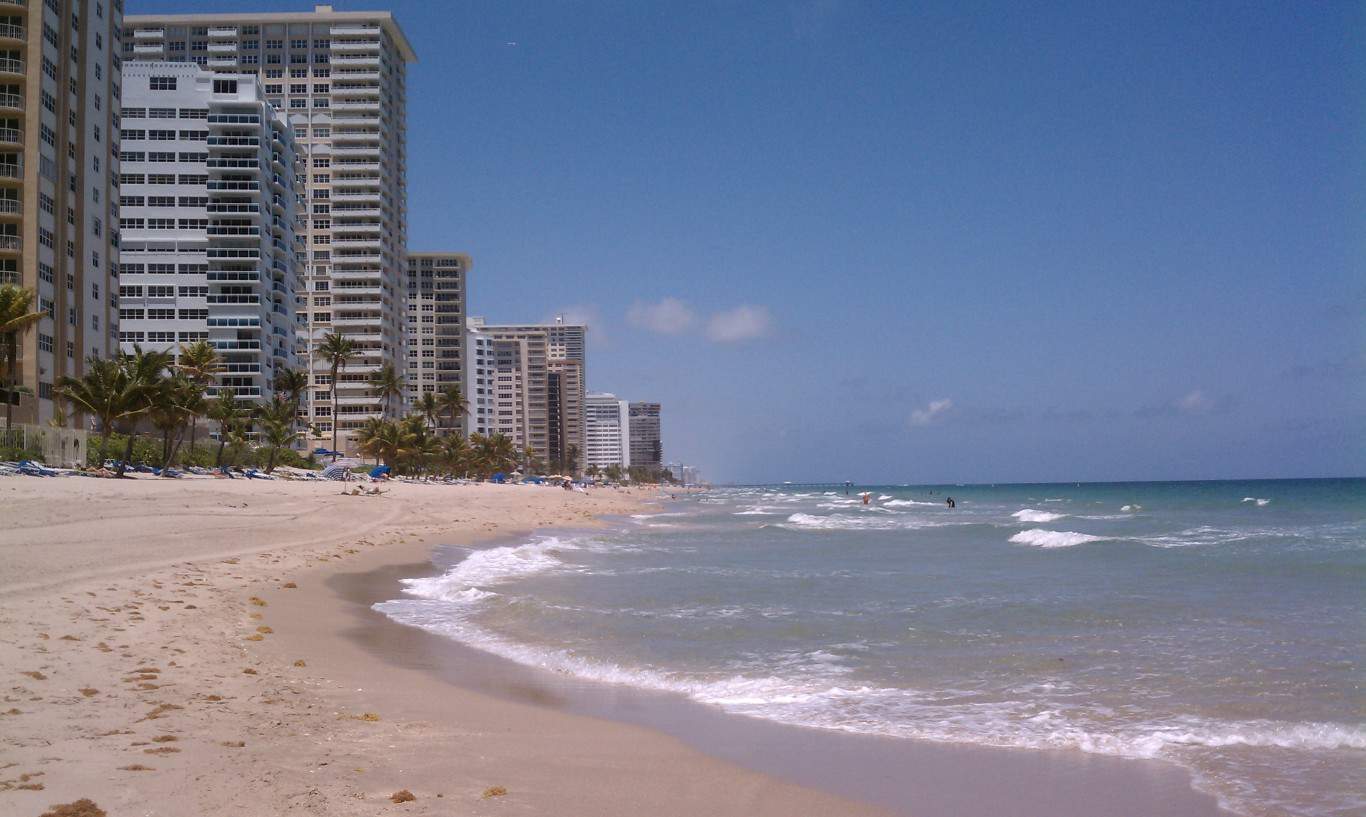
- Change in share of families in middle-income tracts, 2012 to 2022: -16.6 ppts.
- Change in share of families in upper-income tracts, 2012 to 2022: +9.3 ppts.
- Change in share of families in lower-income tracts, 2012 to 2022: +7.3 ppts.
- Median family income, 2022: $87,676
- Total population, 2022: 182,673
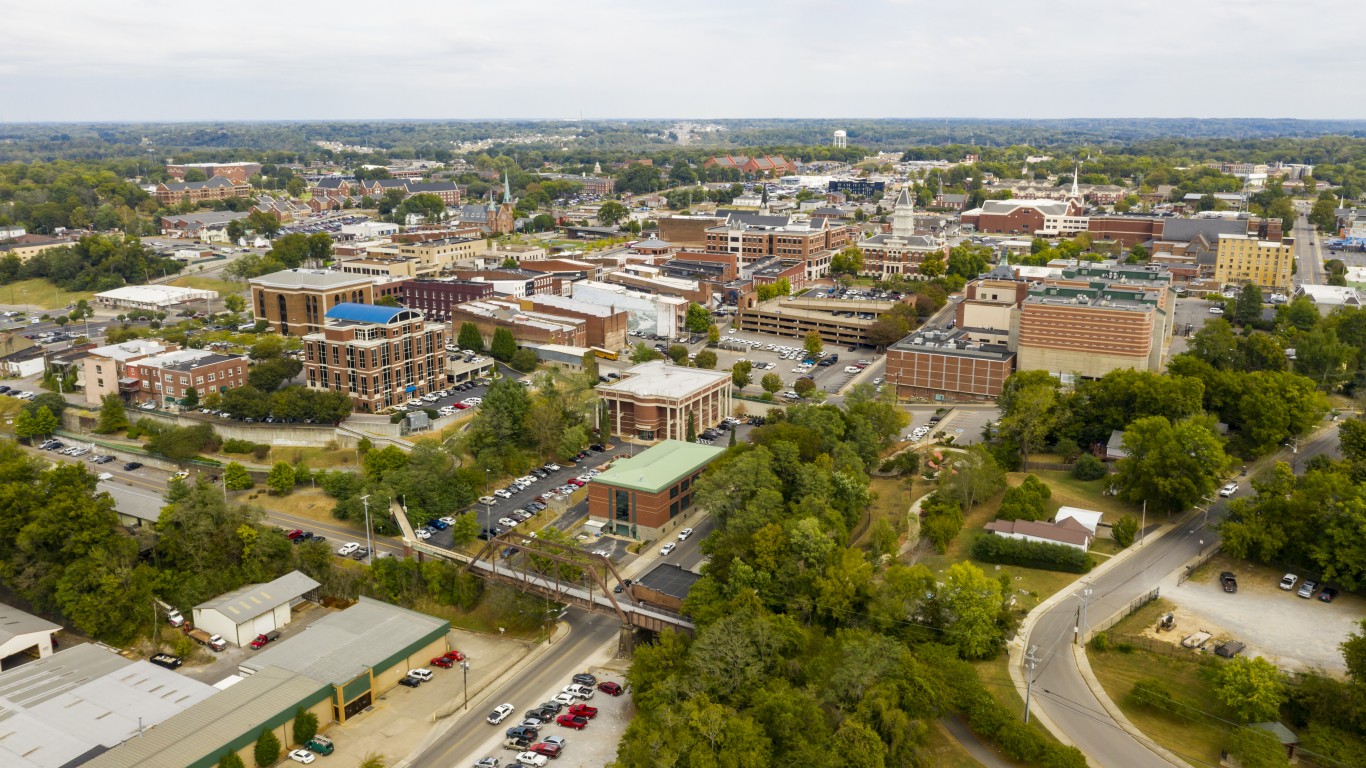
2. Murfreesboro, Tennessee
- Change in share of families in middle-income tracts, 2012 to 2022: -16.7 ppts.
- Change in share of families in upper-income tracts, 2012 to 2022: +2.1 ppts.
- Change in share of families in lower-income tracts, 2012 to 2022: +14.6 ppts.
- Median family income, 2022: $90,863
- Total population, 2022: 153,487
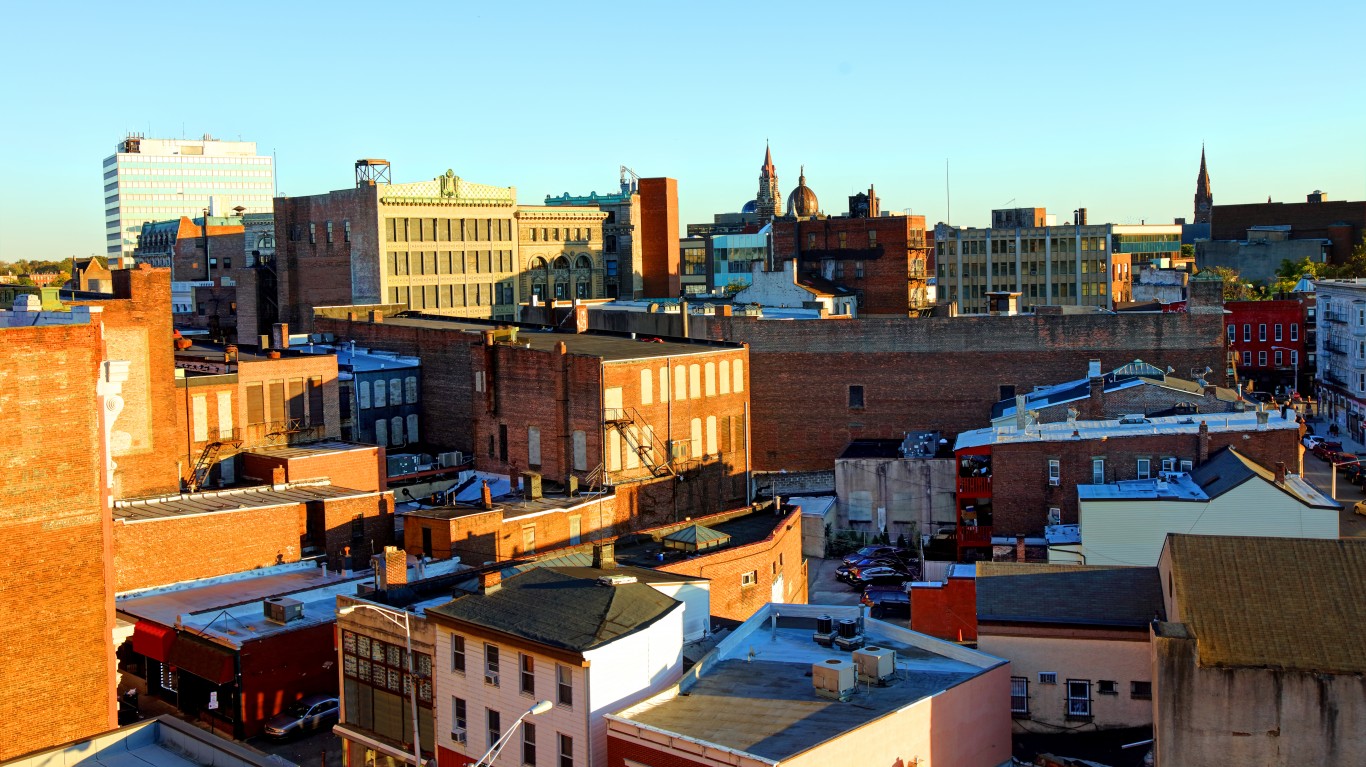
1. Jersey City, New Jersey

- Change in share of families in middle-income tracts, 2012 to 2022: -20.1 ppts.
- Change in share of families in upper-income tracts, 2012 to 2022: +10.4 ppts.
- Change in share of families in lower-income tracts, 2012 to 2022: +9.7 ppts.
- Median family income, 2022: $102,072
- Total population, 2022: 287,899