Even as we approach the 5th anniversary of the pandemic, America’s urban centers are still grappling with the long-term effects of the COVID-19 pandemic, changing work patterns, and evolving demographic trends.
While some employers, such as Jamie Dimon from JPMorgan Chase, have made it clear it’s time for employees to get back into the office, many other employers have adopted permanent hybrid or remote work policies, leaving downtown office towers only partly filled. As of mid-2025, national office vacancy rates hit a record 20–21%, while workplace badge swipes show average occupancy stabilizing around 55% on a typical weekday
Rising housing costs in larger metros, combined with a growing appetite for more space and flexibility, have spurred some urban residents to migrate to the suburbs – or even entirely new regions. Recent Census estimates show that most U.S. cities actually gained population between 2023 and 2024, with New York City, Houston, and Los Angeles recording the largest numeric increases. While Americans still express high interest in moving, the actual share who relocate annually remains closer to 8–9%.
Meanwhile, city revitalization efforts are underway, supported by billions in state and federal infrastructure dollars. However, in late September 2025, the U.S. Department of Transportation canceled a small number of previously announced transit and development grants, even as the majority of funding continues to flow toward downtown renewal projects.
To give our readers a better sense of where the change has been most significant, 24/7 Wall St. reviewed five-year data on population change from the U.S. Census Bureau’s 2022 American Community Survey. Cities were ranked based on the percentage change in population in downtown census tracts from 2012 to 2022. Downtown areas were defined as the census tracts that fall at least 50% within the 1.8-mile radius around a city hall. Non-downtown areas were defined as the census tracts that fall at least 50% within a city’s boundaries, yet less than 50% within the 1.8-mile radius around city hall. Boundary definitions are from the U.S. Census Bureau and are for 2022. Only principal cities of metropolitan statistical areas were considered. City hall coordinates as well as supplemental data on income are also from the Census Bureau.
Geographically, 10 of the cities on the list are from the Midwest. However, the region with the most cities on the list is the South, with 26 cities, including 10 in Texas alone. Georgia has the second most cities on the list, at four, including the city whose downtown shrank the most from 2012 to 2022.
This post was updated on October 2nd to include new census bureau data and recent polling on remote work.
Why This Matters
A thriving downtown is a critical economic driver for any city, acting as a hub for business innovation, job creation, and tourism.
When downtown areas flourish, they attract new businesses, which in turn generate additional employment opportunities and bolster local tax revenues.
Successful downtown redevelopment also tends to increase nearby property values, boosting wealth for property owners and contributing to the city’s overall economic stability.
Furthermore, vibrant city centers draw visitors to cultural attractions, sporting events, and dining options, creating a sustainable cycle of investment and reinvestment. These dynamic urban cores help knit communities together and foster collaboration among entrepreneurs, artists, and residents—ultimately helping to strengthen the entire region’s economic resilience.
Here are 40 American cities with shrinking downtowns:
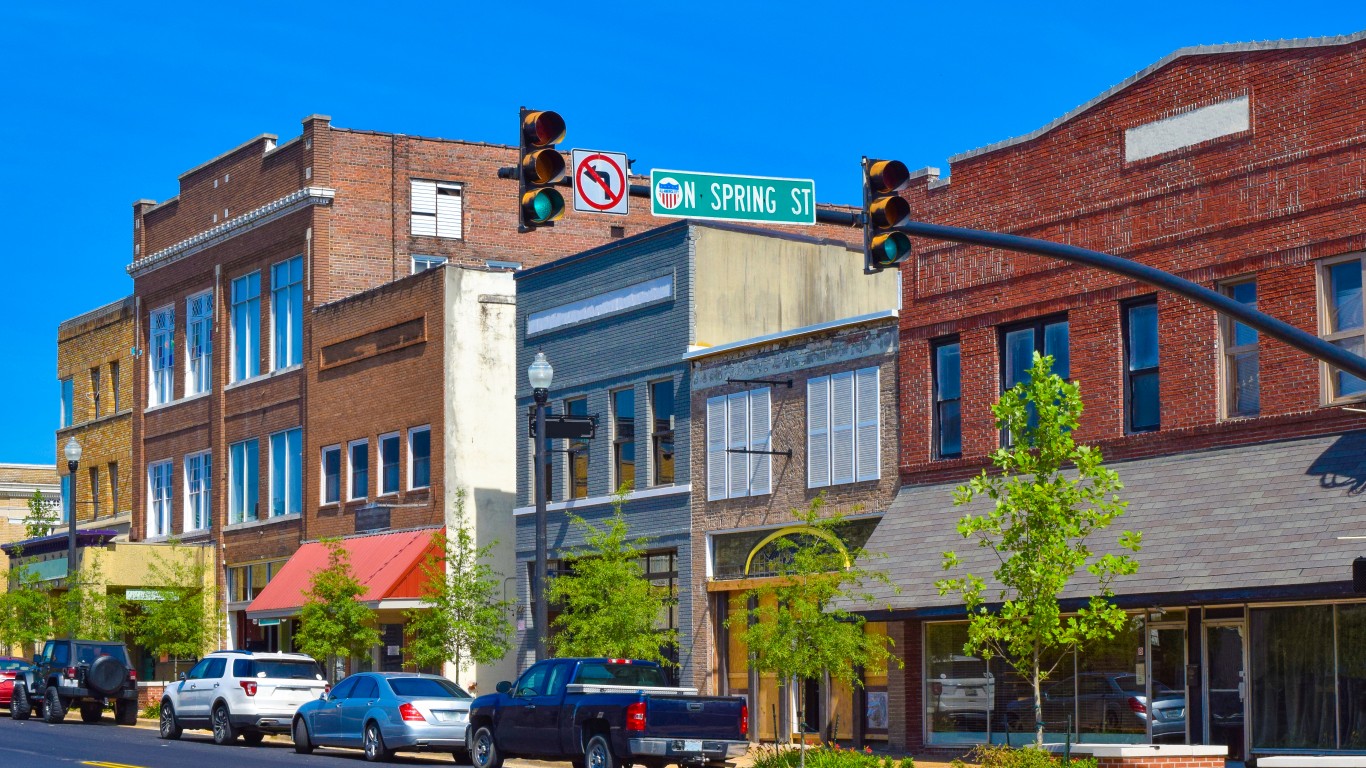
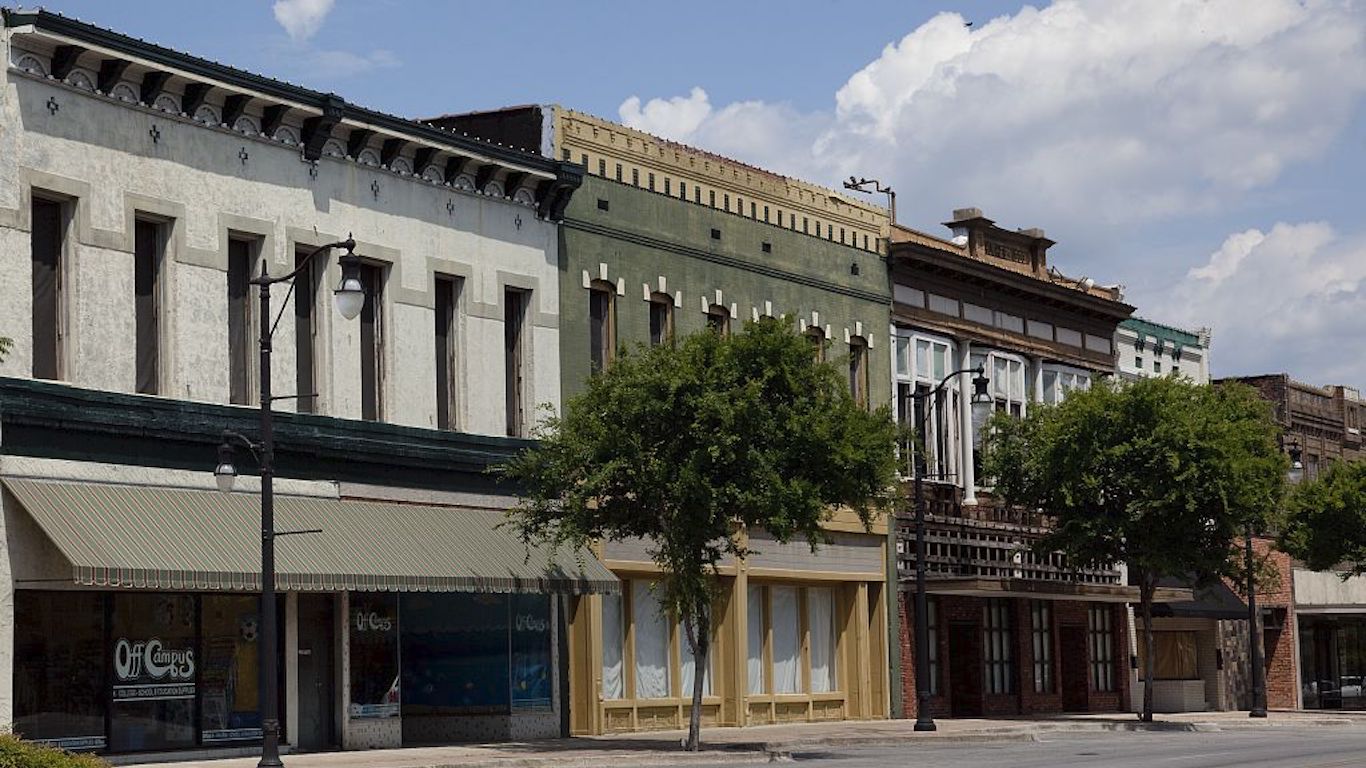
40. San Angelo, Texas
- Population change in downtown tracts from 2012 to 2022: -10.3%
- Population change of non-downtown tracts from 2012 to 2022: +8.7%
- Per capita income change in downtown tracts from 2012 to 2022: +21.3%
- Per capita income change in non-downtown tracts from 2012 to 2022: +15.5%
39. San Antonio, Texas
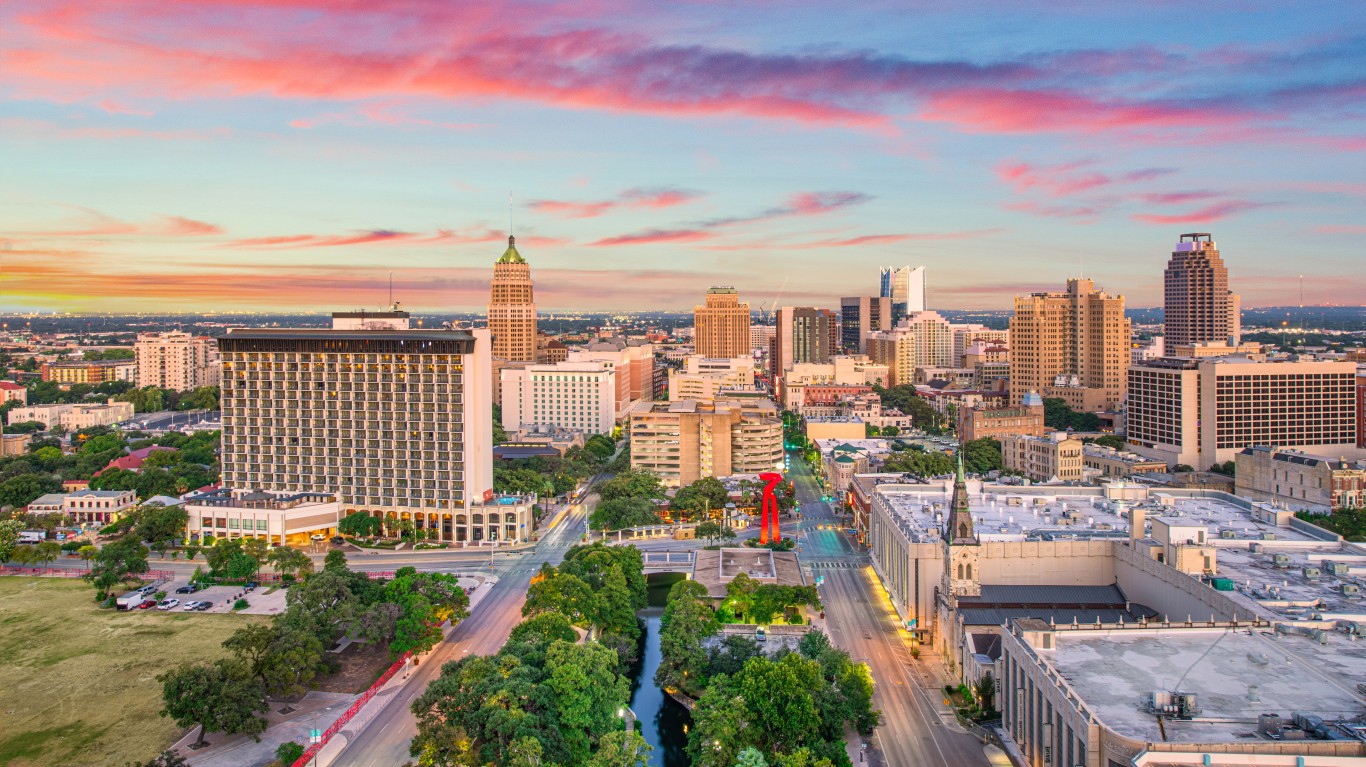
- Population change in downtown tracts from 2012 to 2022: -10.6%
- Population change of non-downtown tracts from 2012 to 2022: +7.5%
- Per capita income change in downtown tracts from 2012 to 2022: +28.5%
- Per capita income change in non-downtown tracts from 2012 to 2022: +8.0%
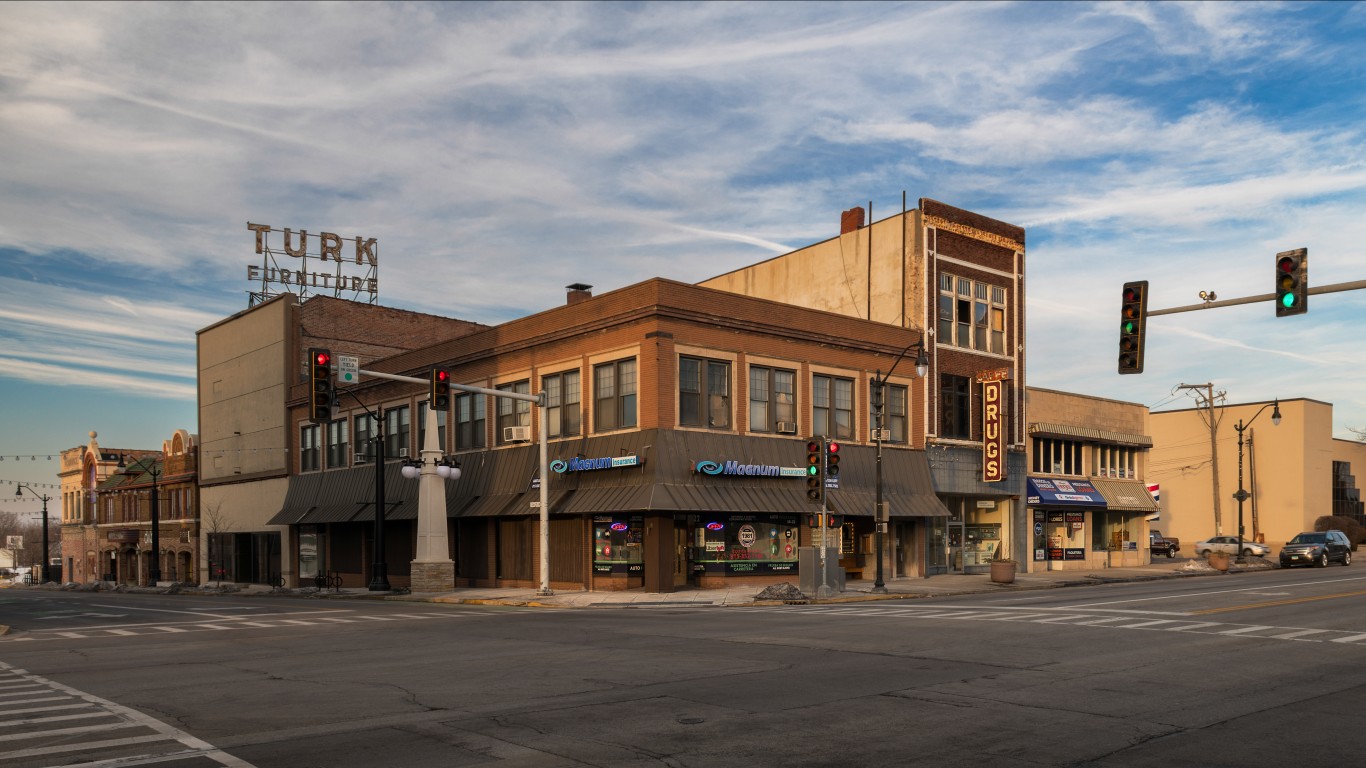
38. St. Joseph, Missouri
- Population change in downtown tracts from 2012 to 2022: -10.9%
- Population change of non-downtown tracts from 2012 to 2022: -1.7%
- Per capita income change in downtown tracts from 2012 to 2022: +9.1%
- Per capita income change in non-downtown tracts from 2012 to 2022: +11.5%
37. Springfield, Illinois

- Population change in downtown tracts from 2012 to 2022: -10.9%
- Population change of non-downtown tracts from 2012 to 2022: -2.0%
- Per capita income change in downtown tracts from 2012 to 2022: +9.5%
- Per capita income change in non-downtown tracts from 2012 to 2022: +8.2%
36. Youngstown, Ohio
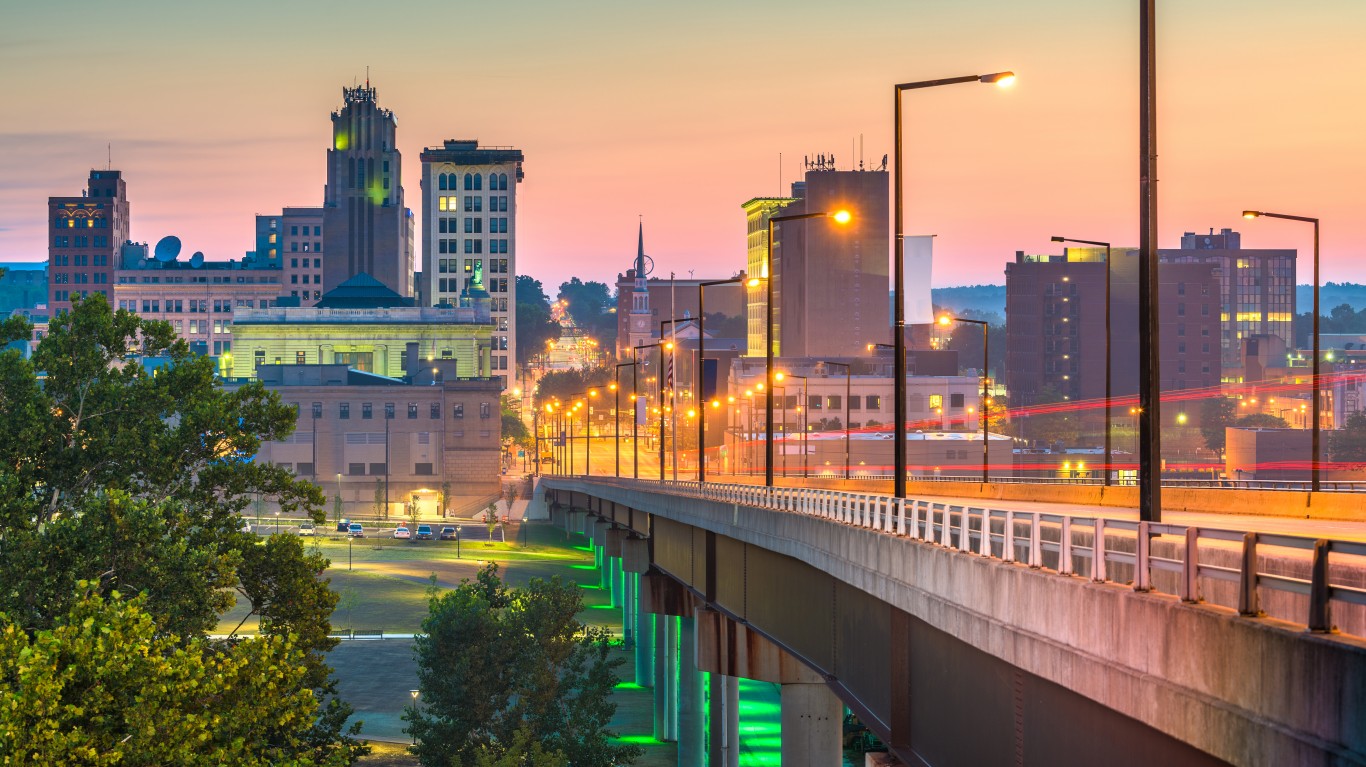
- Population change in downtown tracts from 2012 to 2022: -11.1%
- Population change of non-downtown tracts from 2012 to 2022: -7.4%
- Per capita income change in downtown tracts from 2012 to 2022: +21.5%
- Per capita income change in non-downtown tracts from 2012 to 2022: +2.2%
35. Canton, Ohio

- Population change in downtown tracts from 2012 to 2022: -11.3%
- Population change of non-downtown tracts from 2012 to 2022: -2.8%
- Per capita income change in downtown tracts from 2012 to 2022: +4.6%
- Per capita income change in non-downtown tracts from 2012 to 2022: +11.1%
34. Brownsville, Texas
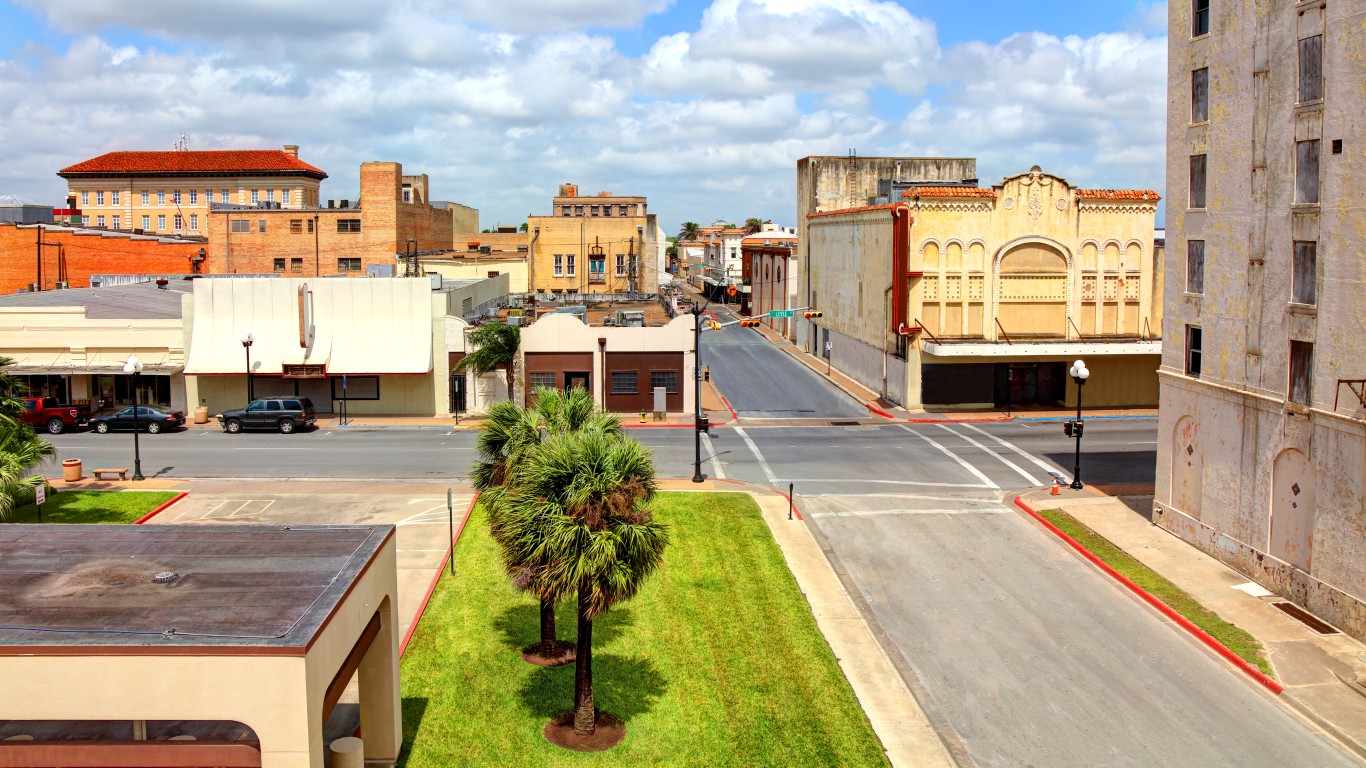
- Population change in downtown tracts from 2012 to 2022: -11.5%
- Population change of non-downtown tracts from 2012 to 2022: +0.6%
- Per capita income change in downtown tracts from 2012 to 2022: +11.5%
- Per capita income change in non-downtown tracts from 2012 to 2022: +9.8%
33. Johnstown, Pennsylvania
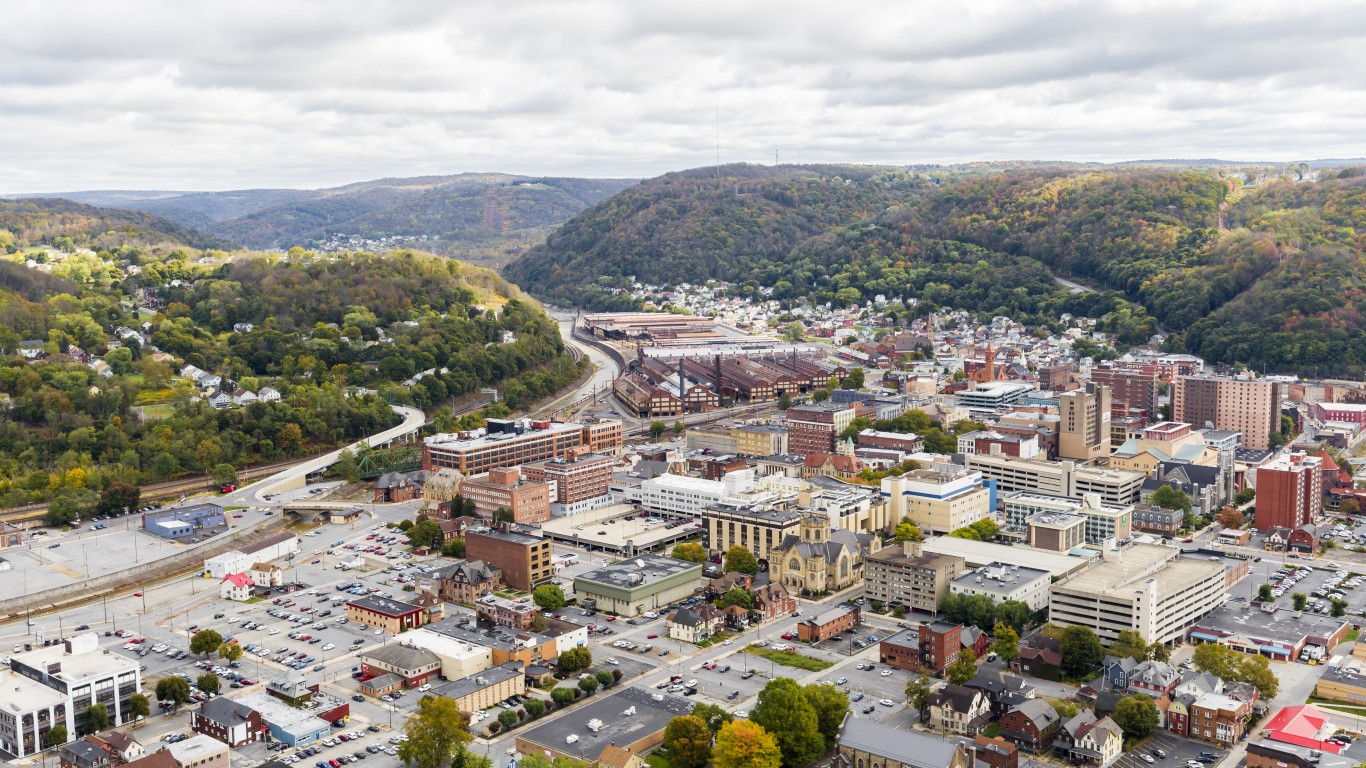
- Population change in downtown tracts from 2012 to 2022: -11.6%
- Population change of non-downtown tracts from 2012 to 2022: -12.4%
- Per capita income change in downtown tracts from 2012 to 2022: +23.9%
- Per capita income change in non-downtown tracts from 2012 to 2022: -1.5%
32. Amarillo, Texas
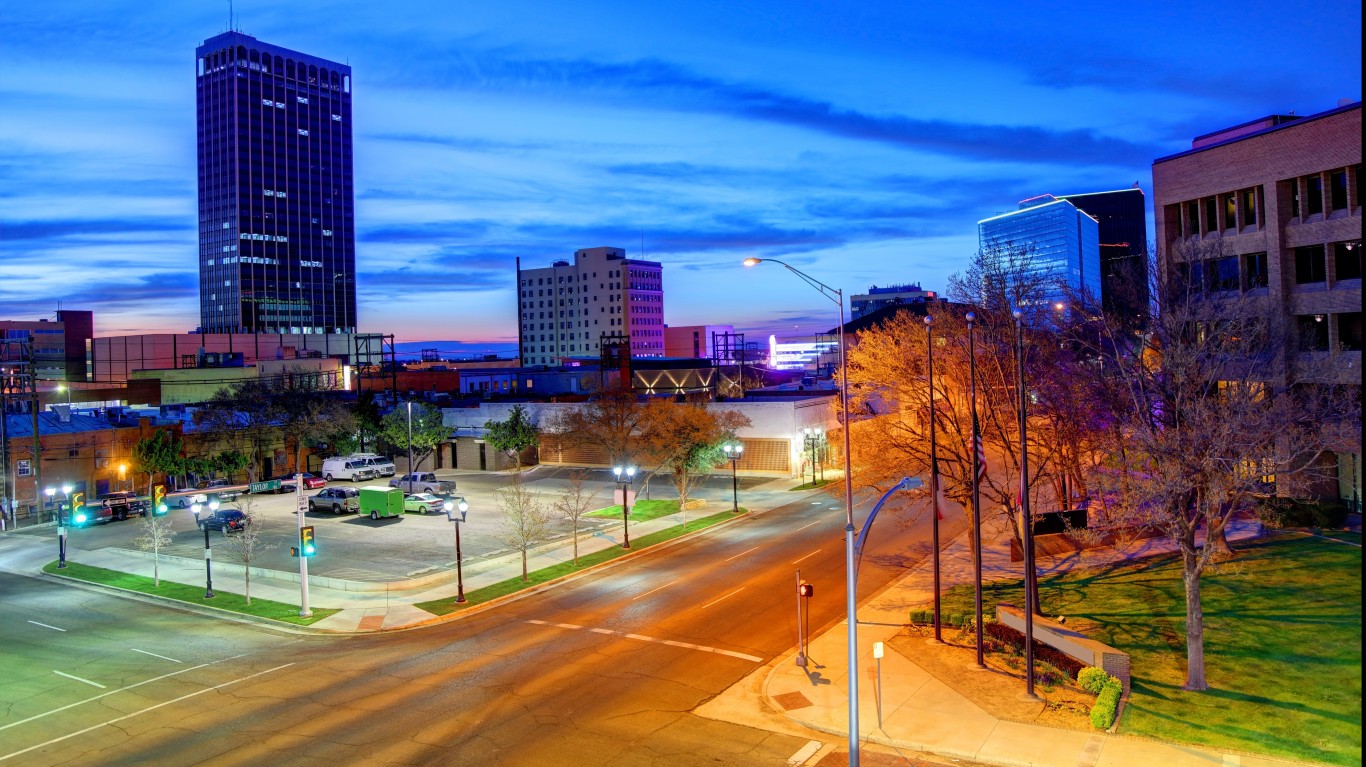
- Population change in downtown tracts from 2012 to 2022: -11.6%
- Population change of non-downtown tracts from 2012 to 2022: +1.8%
- Per capita income change in downtown tracts from 2012 to 2022: +14.1%
- Per capita income change in non-downtown tracts from 2012 to 2022: +6.2%
31. Hattiesburg, Mississippi
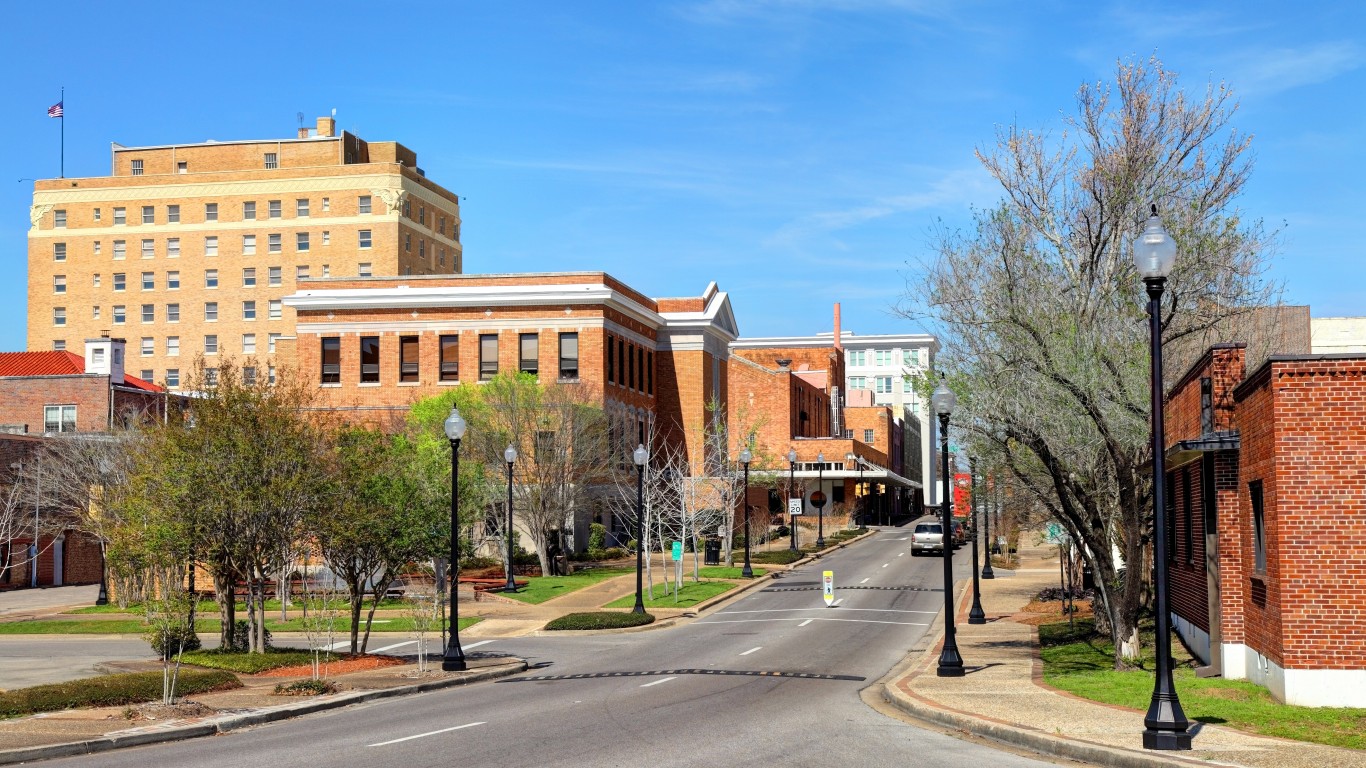
- Population change in downtown tracts from 2012 to 2022: -11.7%
- Population change of non-downtown tracts from 2012 to 2022: +9.2%
- Per capita income change in downtown tracts from 2012 to 2022: +21.2%
- Per capita income change in non-downtown tracts from 2012 to 2022: +0.8%
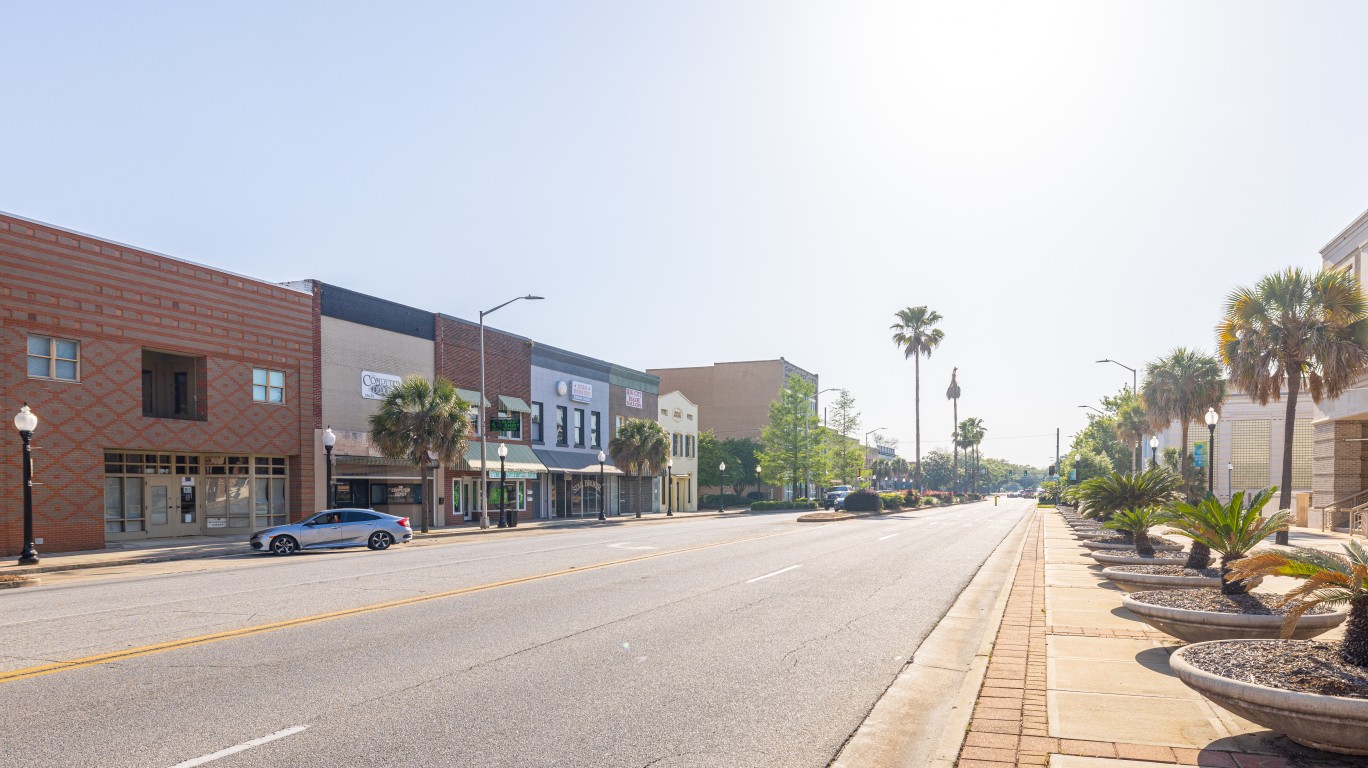
30. Valdosta, Georgia

- Population change in downtown tracts from 2012 to 2022: -12.6%
- Population change of non-downtown tracts from 2012 to 2022: +4.5%
- Per capita income change in downtown tracts from 2012 to 2022: +26.0%
- Per capita income change in non-downtown tracts from 2012 to 2022: +5.0%
29. El Paso, Texas
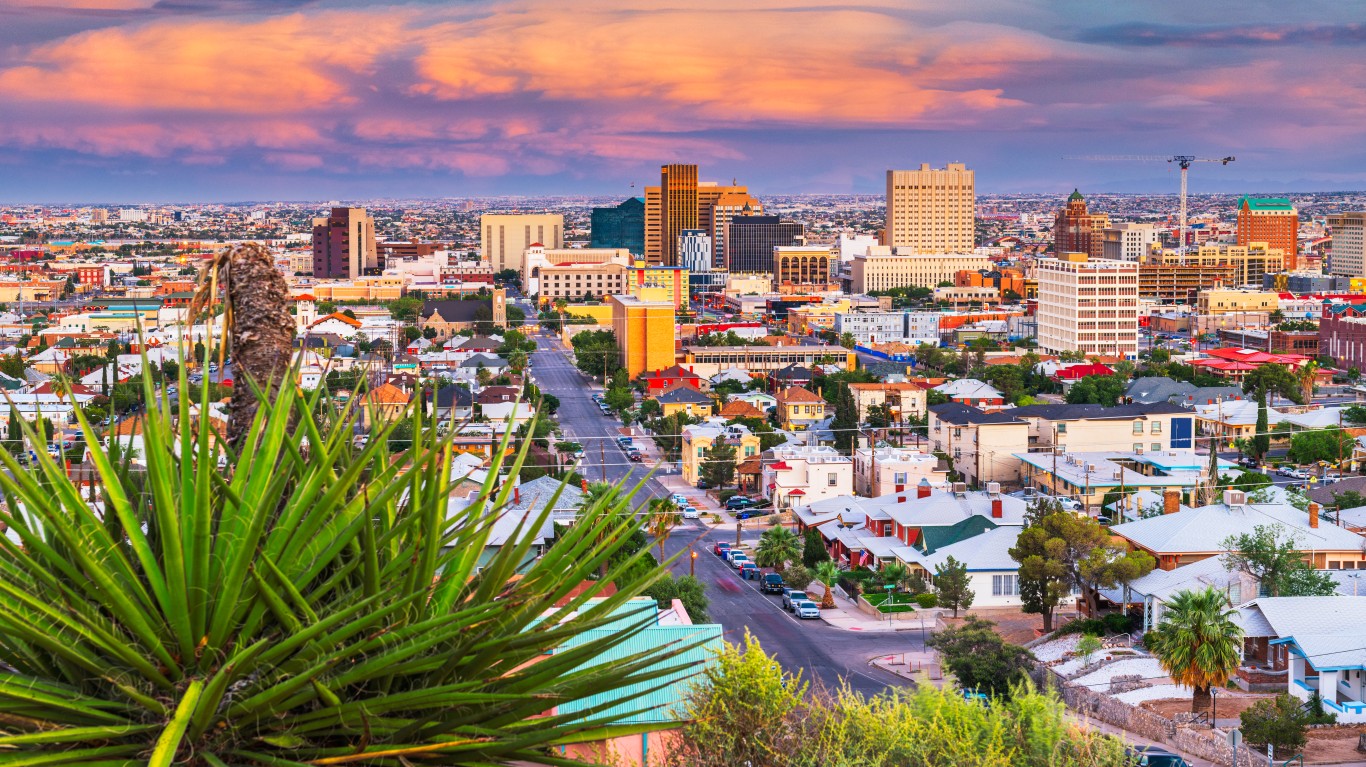
- Population change in downtown tracts from 2012 to 2022: -12.7%
- Population change of non-downtown tracts from 2012 to 2022: -3.2%
- Per capita income change in downtown tracts from 2012 to 2022: +17.9%
- Per capita income change in non-downtown tracts from 2012 to 2022: +8.5%
28. Jackson, Mississippi
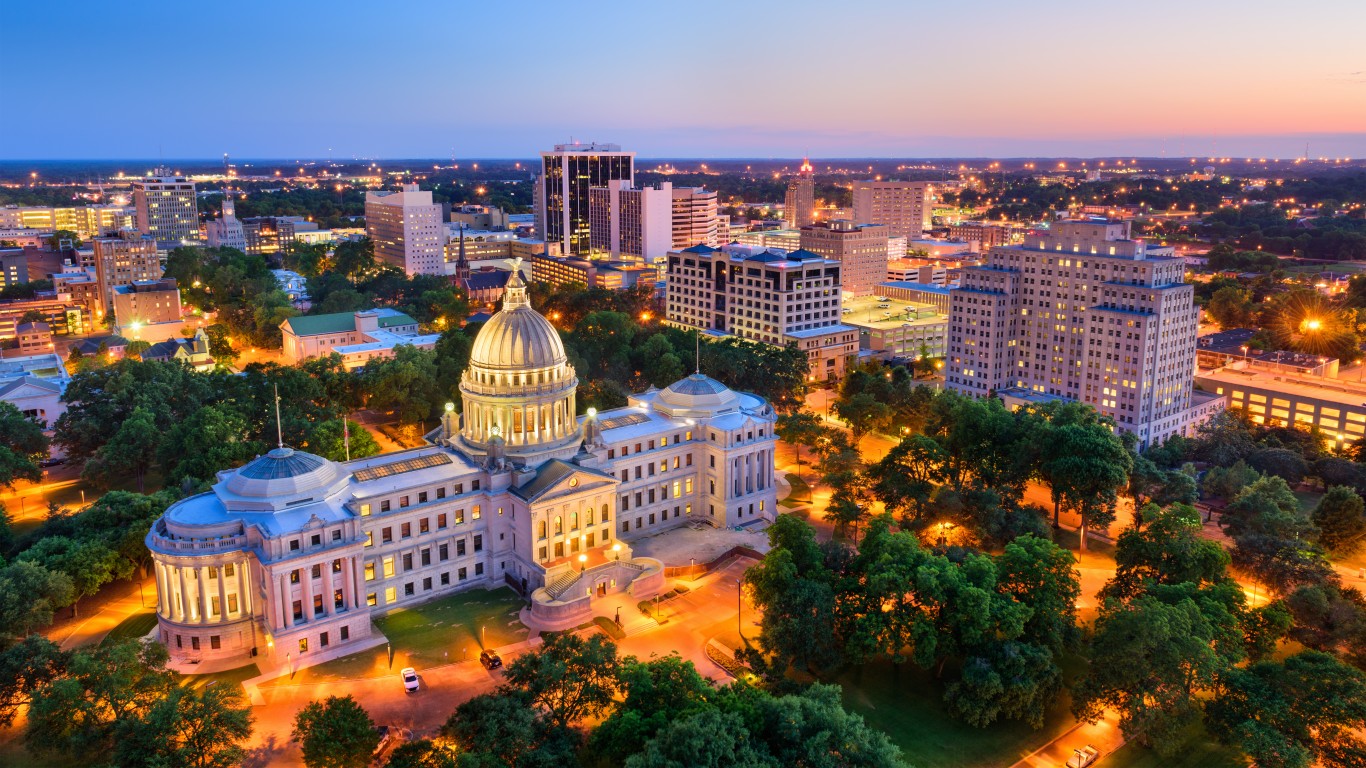
- Population change in downtown tracts from 2012 to 2022: -13.2%
- Population change of non-downtown tracts from 2012 to 2022: -12.6%
- Per capita income change in downtown tracts from 2012 to 2022: +33.1%
- Per capita income change in non-downtown tracts from 2012 to 2022: +5.4%
27. Casper, Wyoming
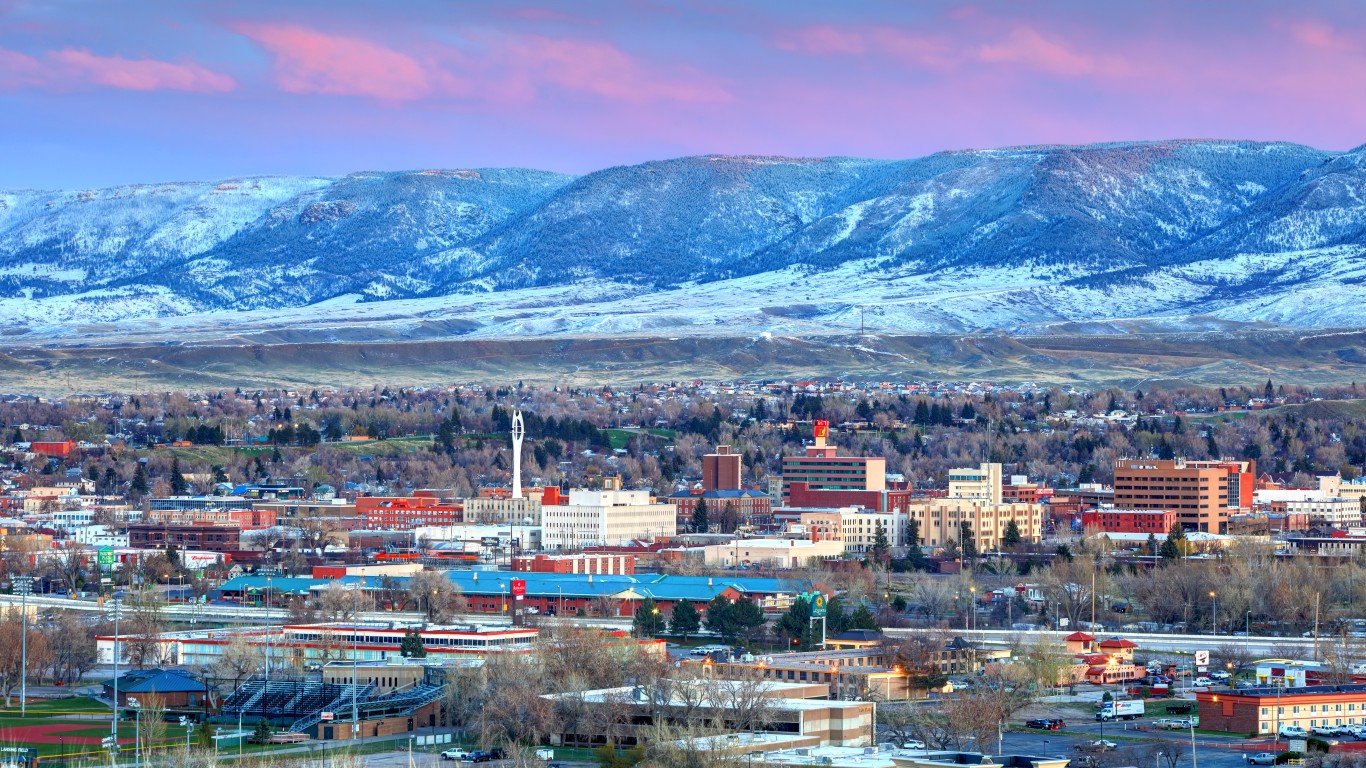
- Population change in downtown tracts from 2012 to 2022: -13.2%
- Population change of non-downtown tracts from 2012 to 2022: +1.5%
- Per capita income change in downtown tracts from 2012 to 2022: +11.6%
- Per capita income change in non-downtown tracts from 2012 to 2022: -3.6%
26. Gadsden, Alabama
- Population change in downtown tracts from 2012 to 2022: -13.3%
- Population change of non-downtown tracts from 2012 to 2022: -6.4%
- Per capita income change in downtown tracts from 2012 to 2022: +5.2%
- Per capita income change in non-downtown tracts from 2012 to 2022: +7.4%
25. Abilene, Texas

- Population change in downtown tracts from 2012 to 2022: -13.3%
- Population change of non-downtown tracts from 2012 to 2022: +3.3%
- Per capita income change in downtown tracts from 2012 to 2022: +4.8%
- Per capita income change in non-downtown tracts from 2012 to 2022: +7.5%
24. Cumberland, Maryland
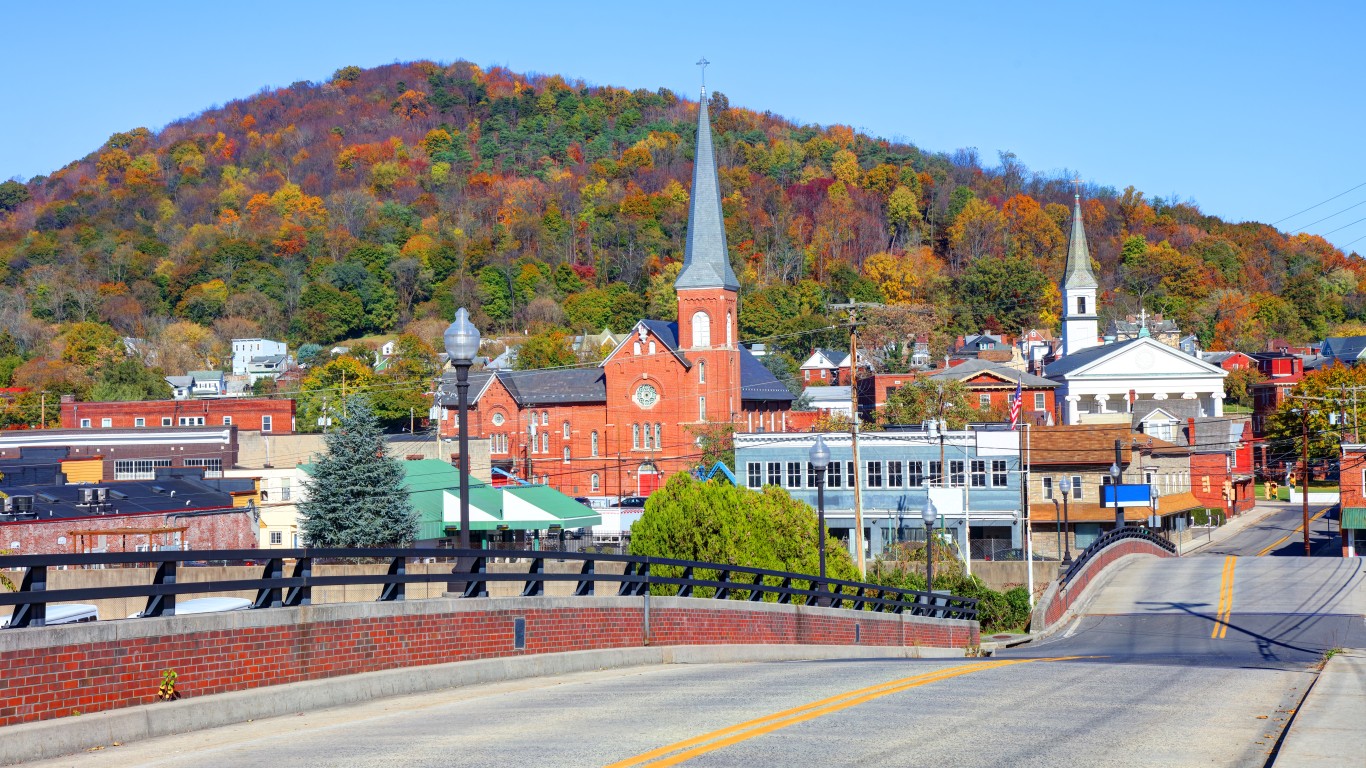
- Population change in downtown tracts from 2012 to 2022: -13.4%
- Population change of non-downtown tracts from 2012 to 2022: -7.4%
- Per capita income change in downtown tracts from 2012 to 2022: +5.1%
- Per capita income change in non-downtown tracts from 2012 to 2022: +14.8%
23. Panama City, Florida
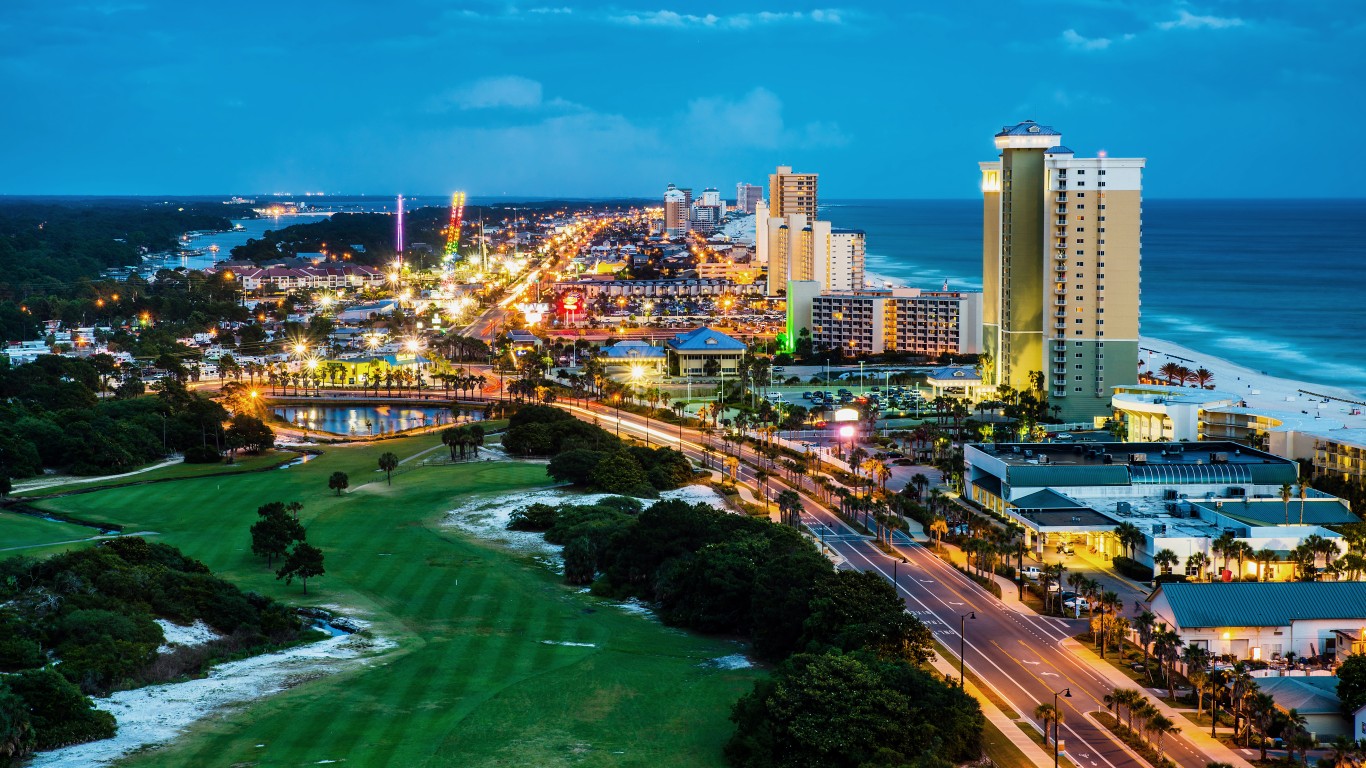
- Population change in downtown tracts from 2012 to 2022: -13.8%
- Population change of non-downtown tracts from 2012 to 2022: -7.9%
- Per capita income change in downtown tracts from 2012 to 2022: +20.6%
- Per capita income change in non-downtown tracts from 2012 to 2022: +17.1%
22. Decatur, Illinois

- Population change in downtown tracts from 2012 to 2022: -14.7%
- Population change of non-downtown tracts from 2012 to 2022: -7.4%
- Per capita income change in downtown tracts from 2012 to 2022: +9.4%
- Per capita income change in non-downtown tracts from 2012 to 2022: +6.2%
21. Kankakee, Illinois
- Population change in downtown tracts from 2012 to 2022: -14.9%
- Population change of non-downtown tracts from 2012 to 2022: +3.6%
- Per capita income change in downtown tracts from 2012 to 2022: +19.4%
- Per capita income change in non-downtown tracts from 2012 to 2022: +2.7%
20. Naples, Florida

- Population change in downtown tracts from 2012 to 2022: -15.0%
- Population change of non-downtown tracts from 2012 to 2022: +3.3%
- Per capita income change in downtown tracts from 2012 to 2022: +31.1%
- Per capita income change in non-downtown tracts from 2012 to 2022: +29.3%
19. Laredo, Texas
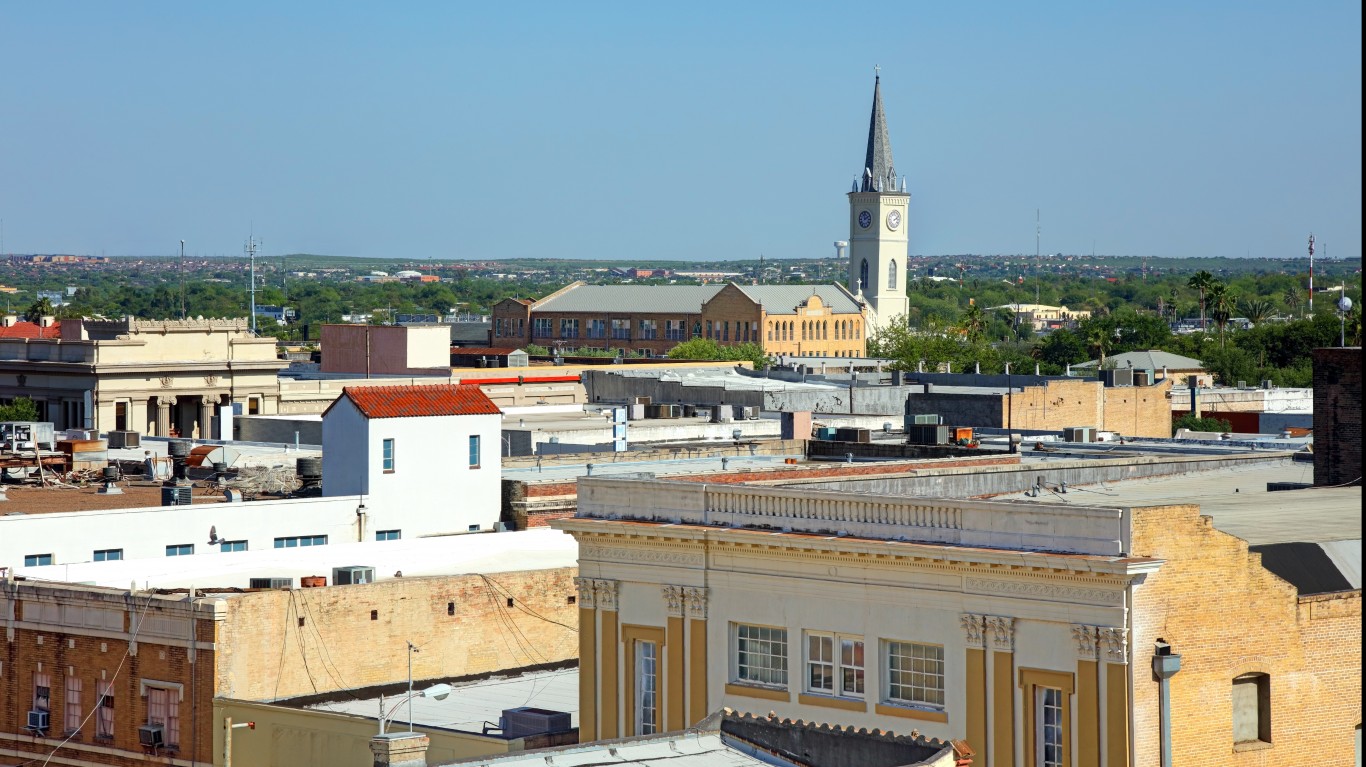
- Population change in downtown tracts from 2012 to 2022: -15.4%
- Population change of non-downtown tracts from 2012 to 2022: +5.4%
- Per capita income change in downtown tracts from 2012 to 2022: +27.8%
- Per capita income change in non-downtown tracts from 2012 to 2022: +22.2%
18. Evansville, Indiana
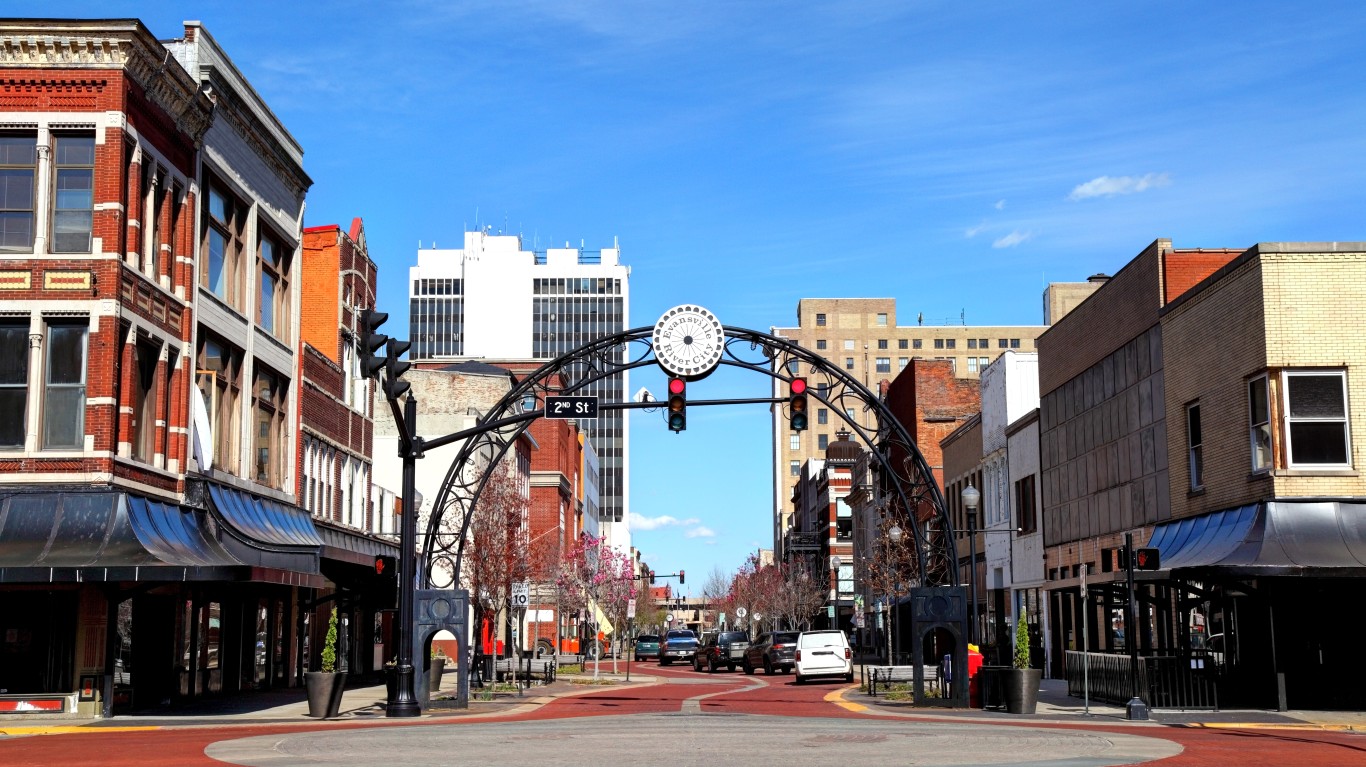
- Population change in downtown tracts from 2012 to 2022: -15.6%
- Population change of non-downtown tracts from 2012 to 2022: +0.2%
- Per capita income change in downtown tracts from 2012 to 2022: +10.5%
- Per capita income change in non-downtown tracts from 2012 to 2022: +8.6%
17. Lima, Ohio
- Population change in downtown tracts from 2012 to 2022: -16.0%
- Population change of non-downtown tracts from 2012 to 2022: +8.3%
- Per capita income change in downtown tracts from 2012 to 2022: +17.7%
- Per capita income change in non-downtown tracts from 2012 to 2022: -1.3%
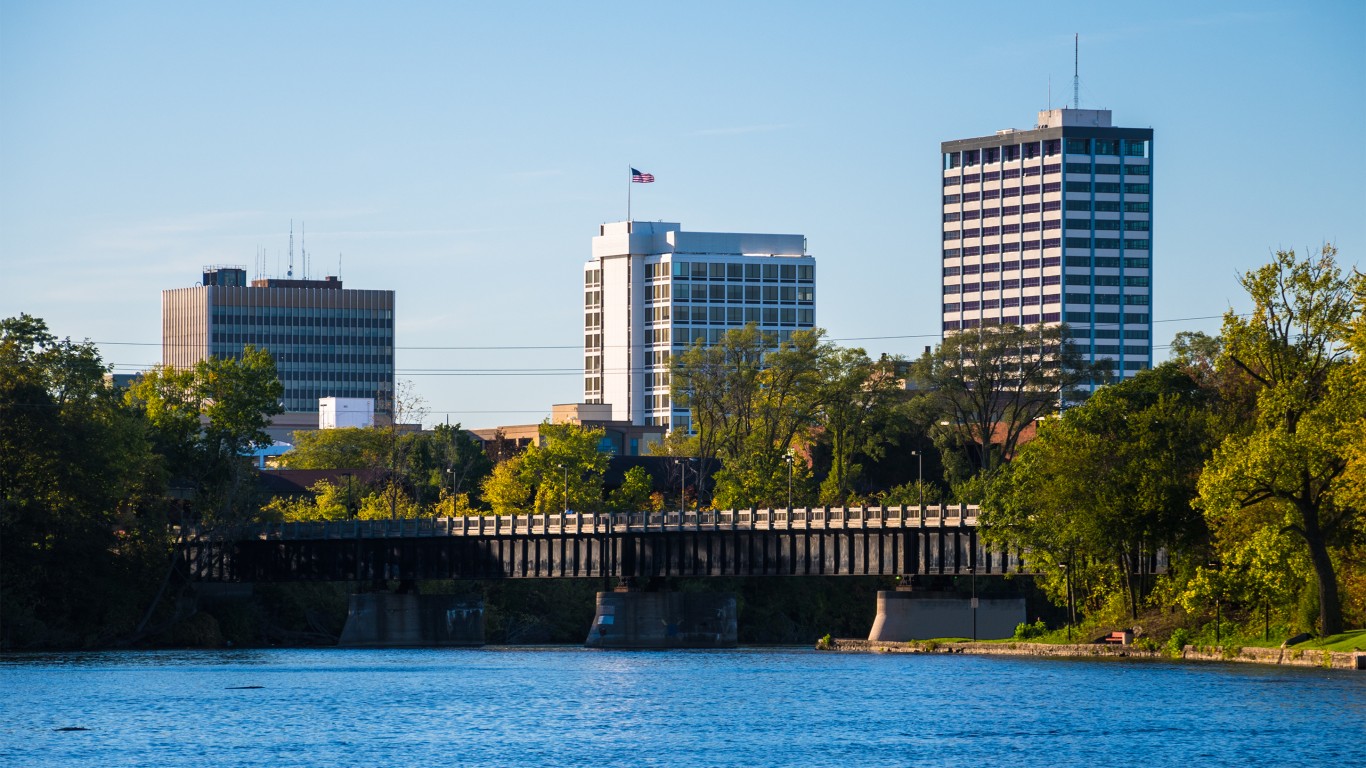
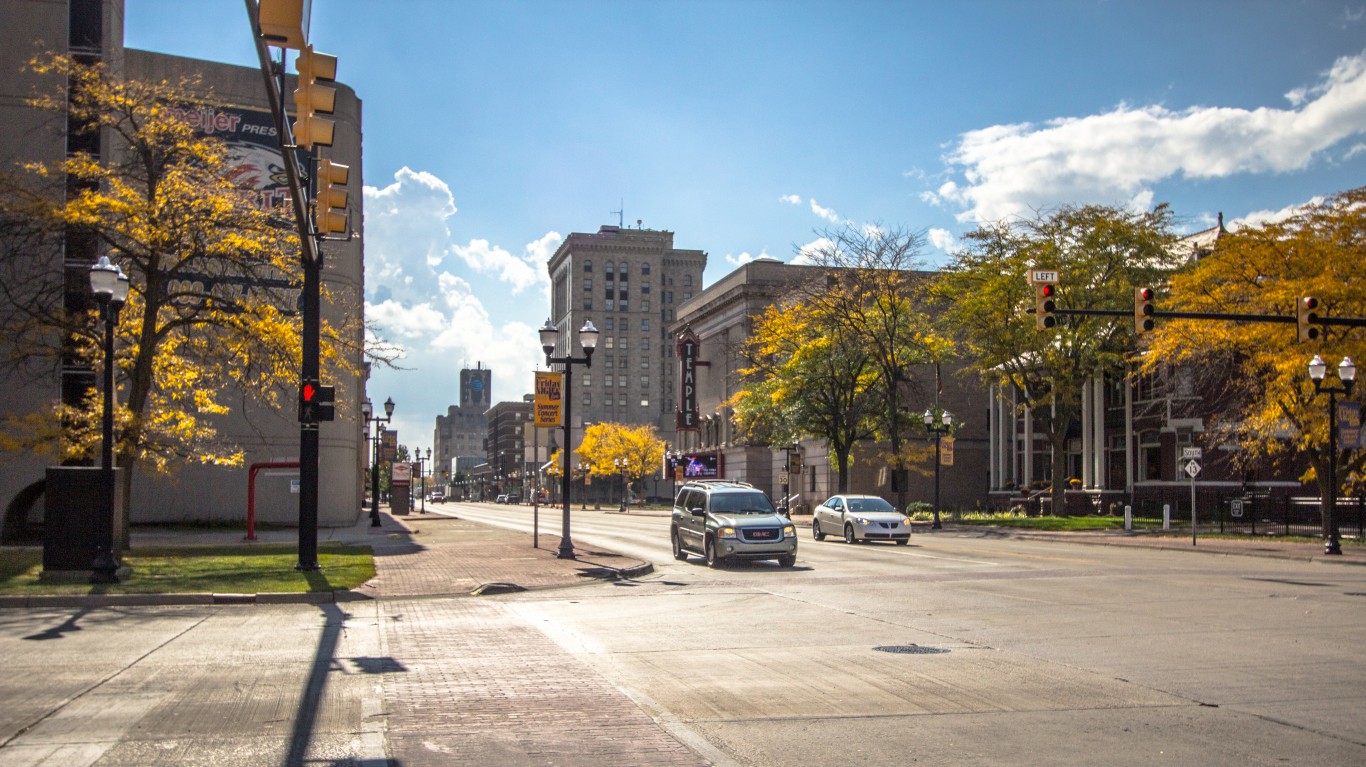
16. Flint, Michigan

- Population change in downtown tracts from 2012 to 2022: -16.9%
- Population change of non-downtown tracts from 2012 to 2022: -22.0%
- Per capita income change in downtown tracts from 2012 to 2022: +19.1%
- Per capita income change in non-downtown tracts from 2012 to 2022: +7.1%
15. Yuma, Arizona

- Population change in downtown tracts from 2012 to 2022: -17.0%
- Population change of non-downtown tracts from 2012 to 2022: -5.4%
- Per capita income change in downtown tracts from 2012 to 2022: +23.6%
- Per capita income change in non-downtown tracts from 2012 to 2022: +19.6%
14. Bangor, Maine
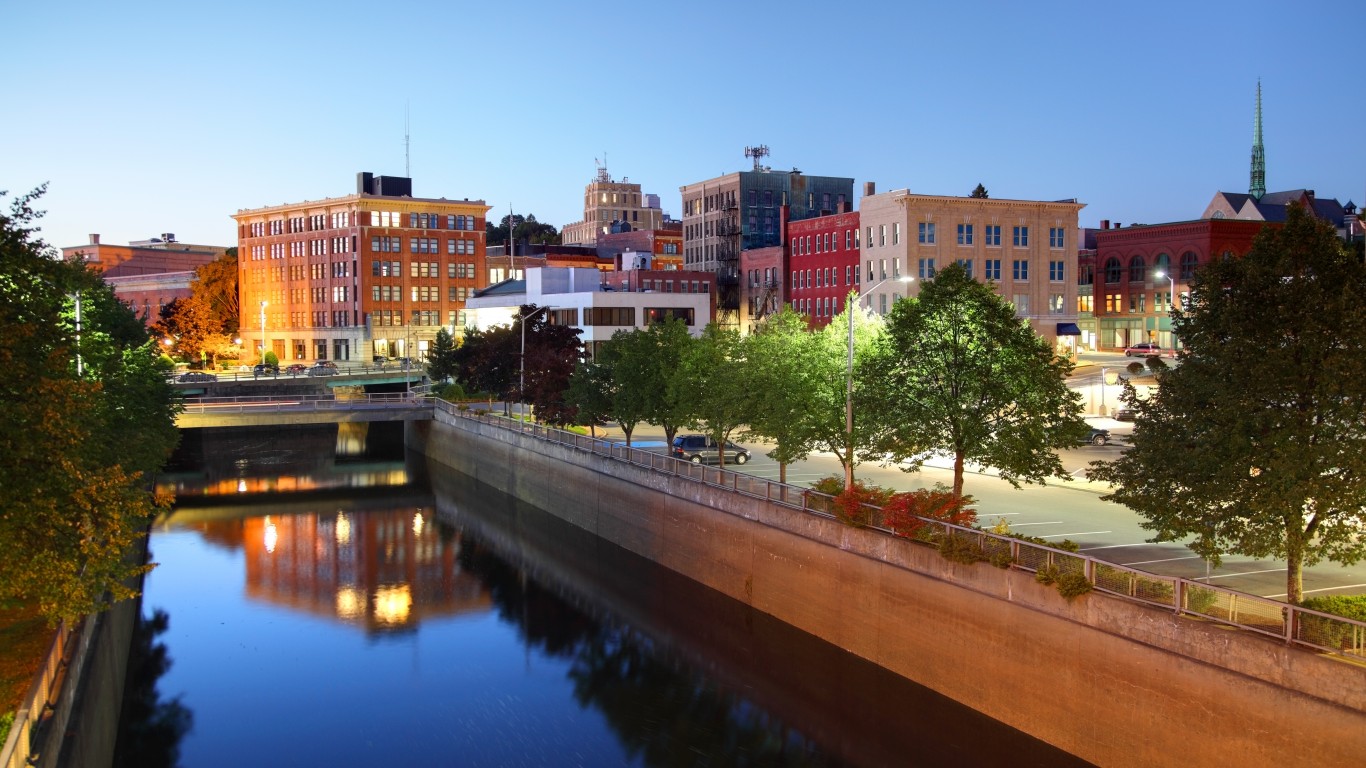
- Population change in downtown tracts from 2012 to 2022: -17.2%
- Population change of non-downtown tracts from 2012 to 2022: +4.4%
- Per capita income change in downtown tracts from 2012 to 2022: +25.7%
- Per capita income change in non-downtown tracts from 2012 to 2022: +16.7%
13. Victoria, Texas
- Population change in downtown tracts from 2012 to 2022: -17.8%
- Population change of non-downtown tracts from 2012 to 2022: +5.7%
- Per capita income change in downtown tracts from 2012 to 2022: -6.3%
- Per capita income change in non-downtown tracts from 2012 to 2022: +2.1%
12. Topeka, Kansas
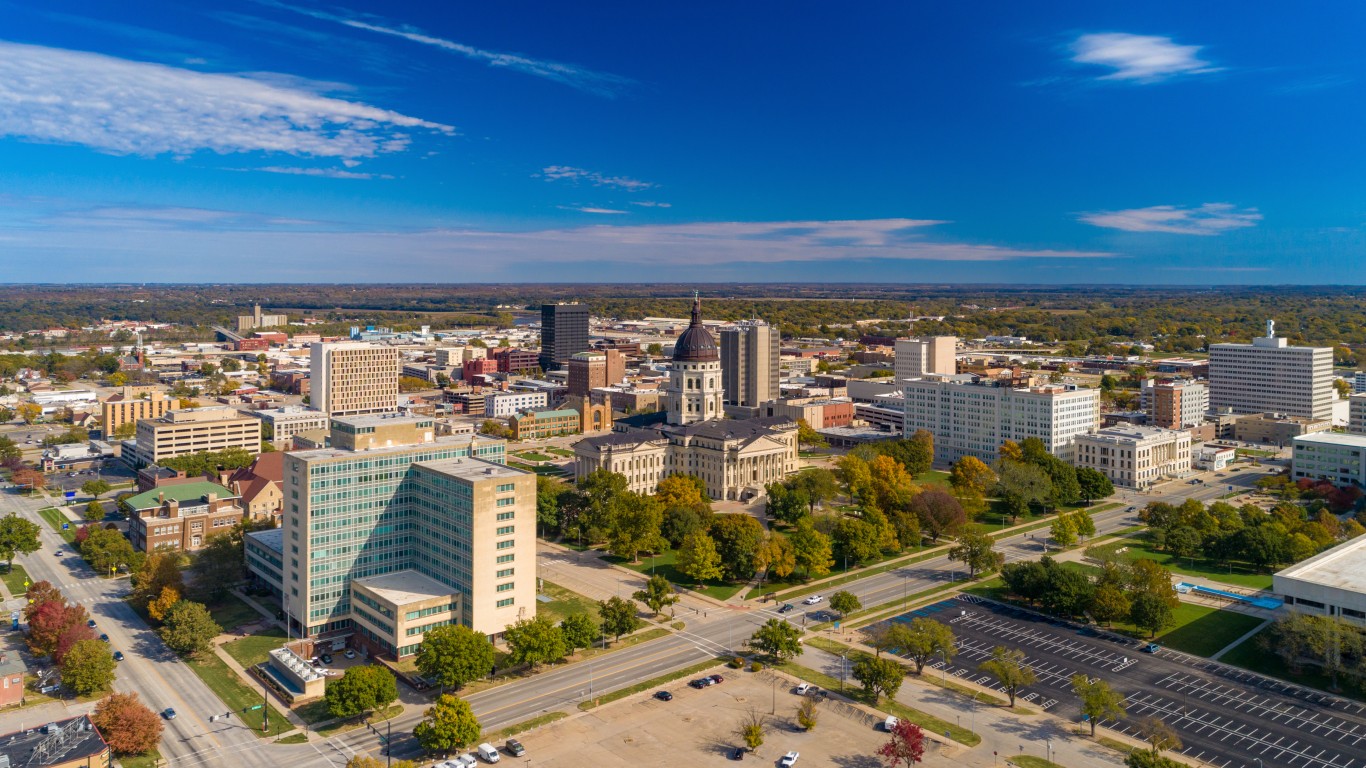
- Population change in downtown tracts from 2012 to 2022: -18.4%
- Population change of non-downtown tracts from 2012 to 2022: +3.2%
- Per capita income change in downtown tracts from 2012 to 2022: +33.2%
- Per capita income change in non-downtown tracts from 2012 to 2022: +5.0%
11. Savannah, Georgia
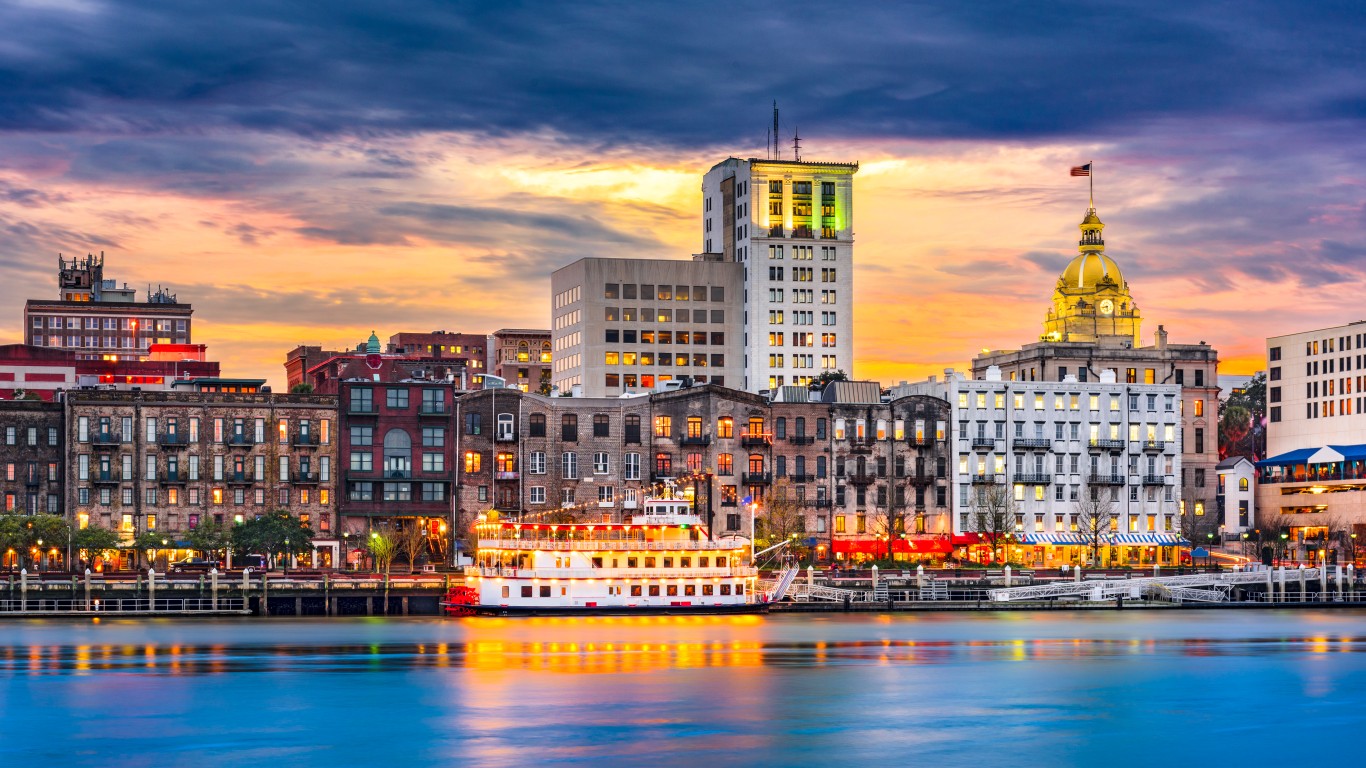
- Population change in downtown tracts from 2012 to 2022: -18.4%
- Population change of non-downtown tracts from 2012 to 2022: +1.8%
- Per capita income change in downtown tracts from 2012 to 2022: +76.9%
- Per capita income change in non-downtown tracts from 2012 to 2022: +15.2%
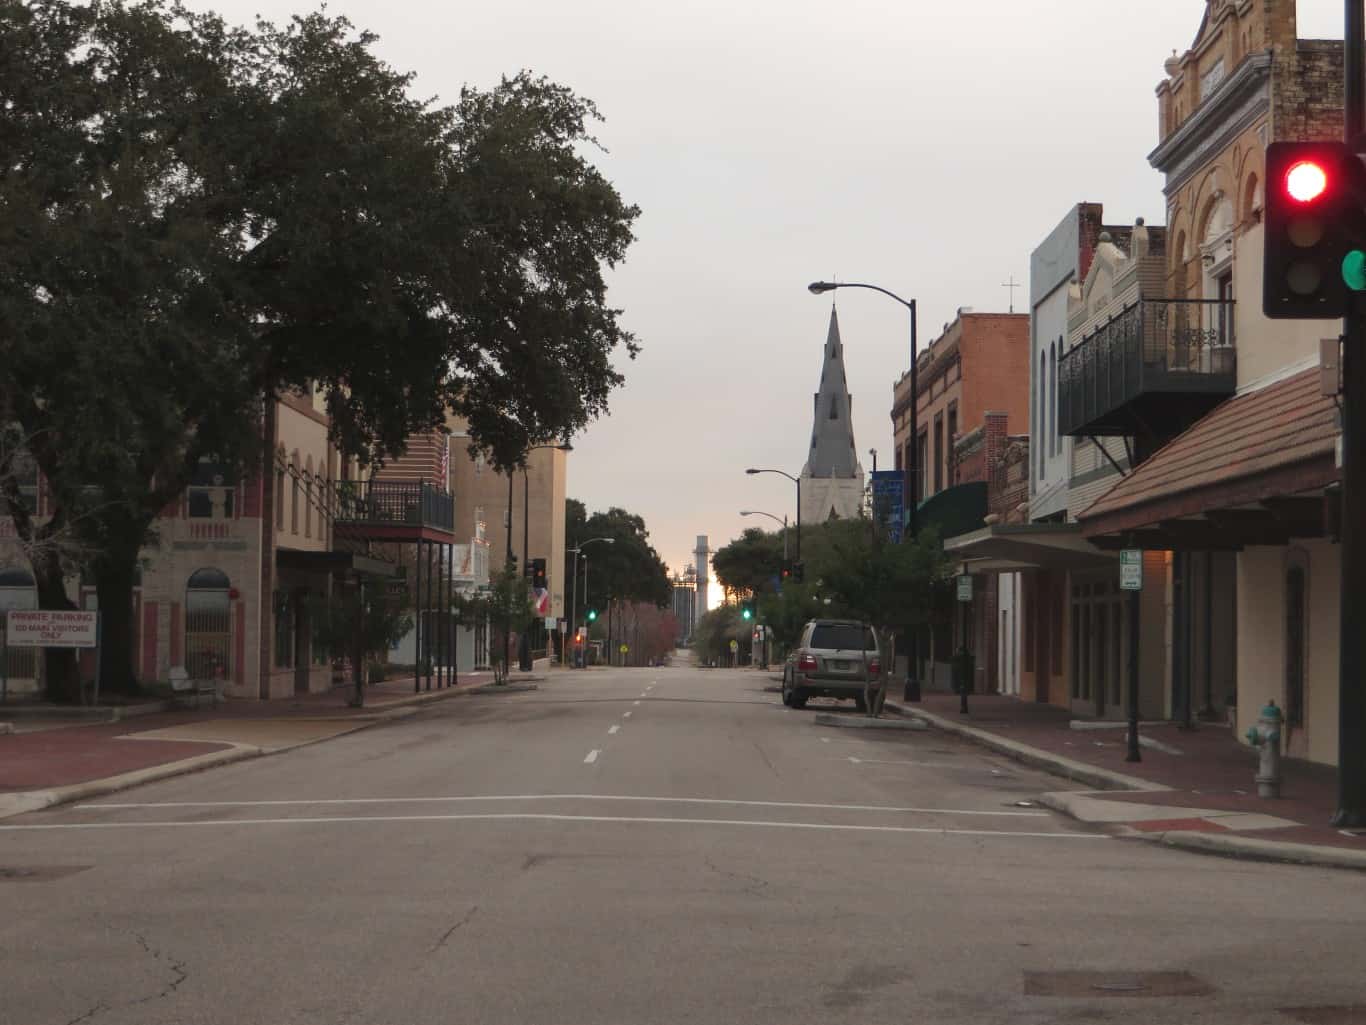
10. Texarkana, Texas
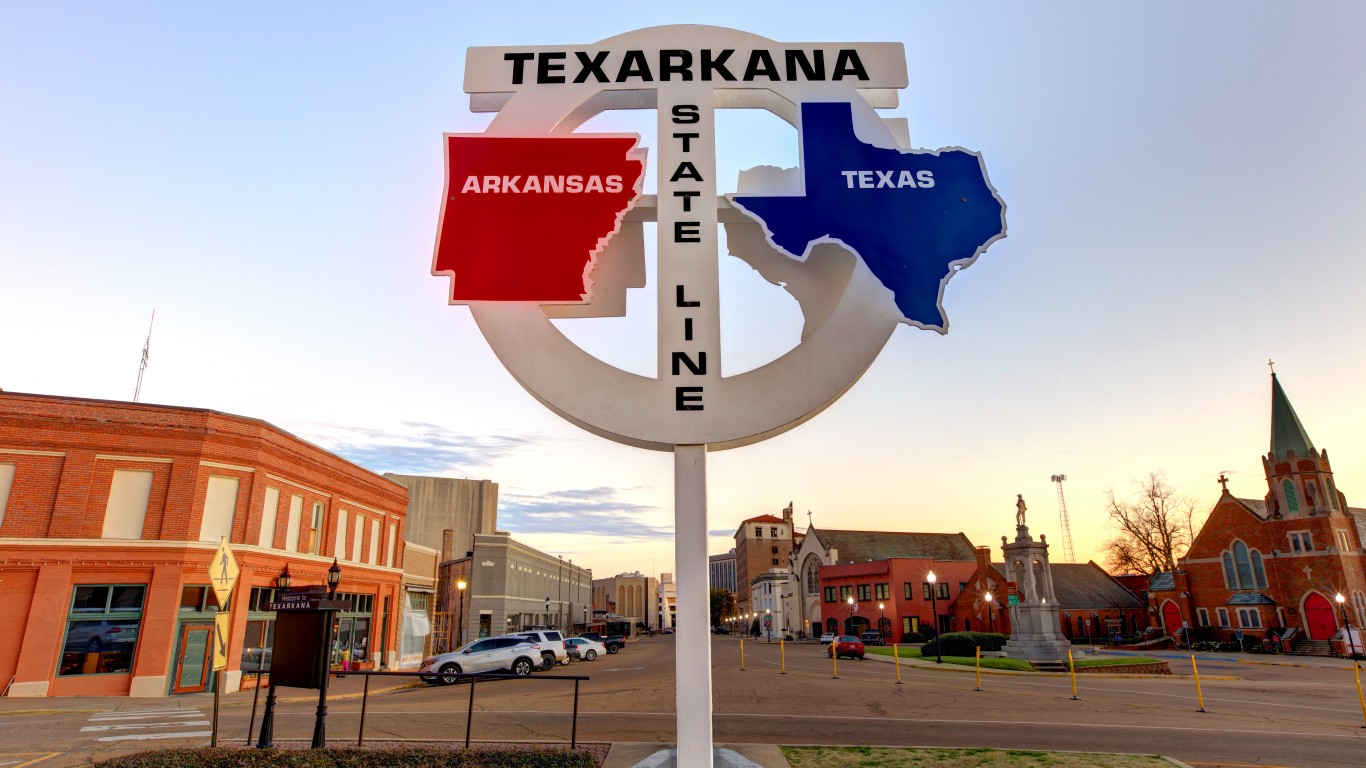
- Population change in downtown tracts from 2012 to 2022: -19.9%
- Population change of non-downtown tracts from 2012 to 2022: -2.2%
- Per capita income change in downtown tracts from 2012 to 2022: +28.7%
- Per capita income change in non-downtown tracts from 2012 to 2022: +1.3%
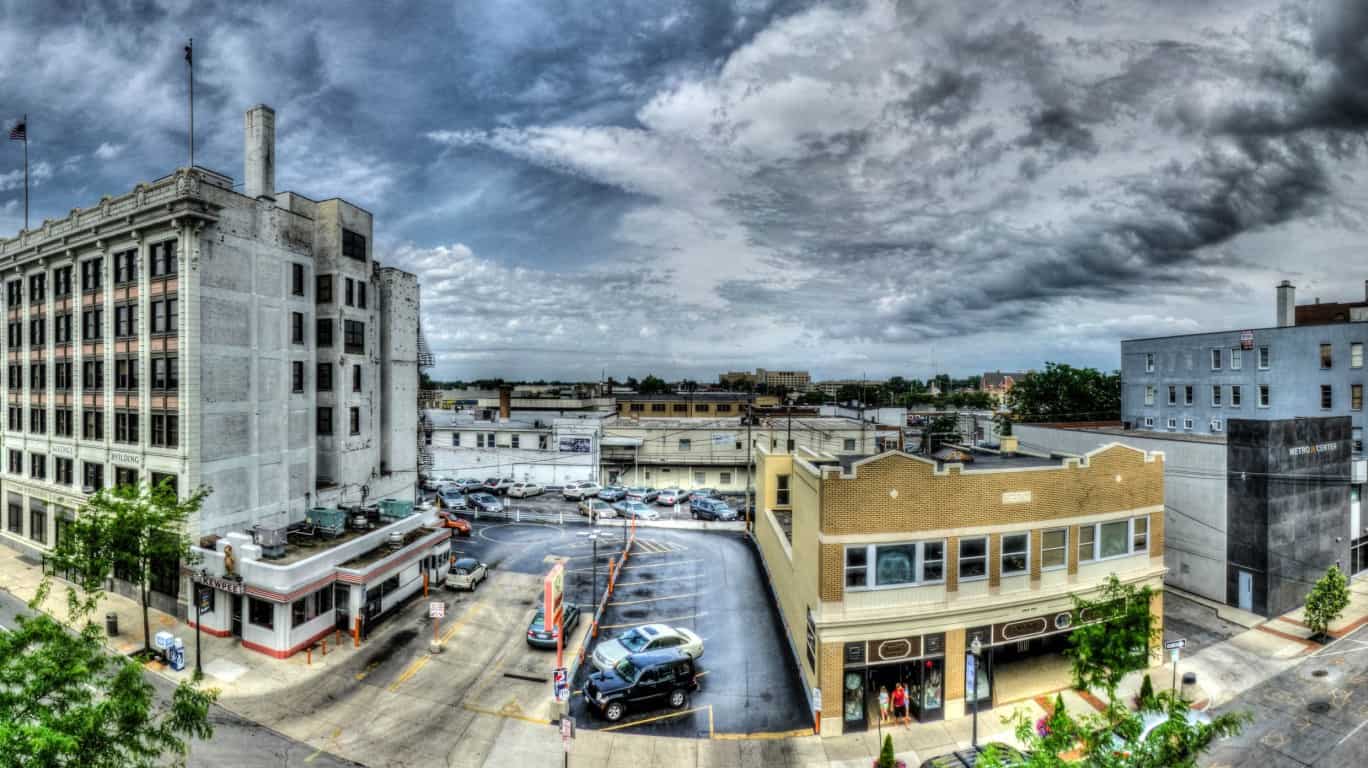
9. Saginaw, Michigan
- Population change in downtown tracts from 2012 to 2022: -20.2%
- Population change of non-downtown tracts from 2012 to 2022: -11.8%
- Per capita income change in downtown tracts from 2012 to 2022: +26.4%
- Per capita income change in non-downtown tracts from 2012 to 2022: -0.6%
8. Sumter, South Carolina

- Population change in downtown tracts from 2012 to 2022: -21.0%
- Population change of non-downtown tracts from 2012 to 2022: +9.6%
- Per capita income change in downtown tracts from 2012 to 2022: -7.5%
- Per capita income change in non-downtown tracts from 2012 to 2022: -9.5%
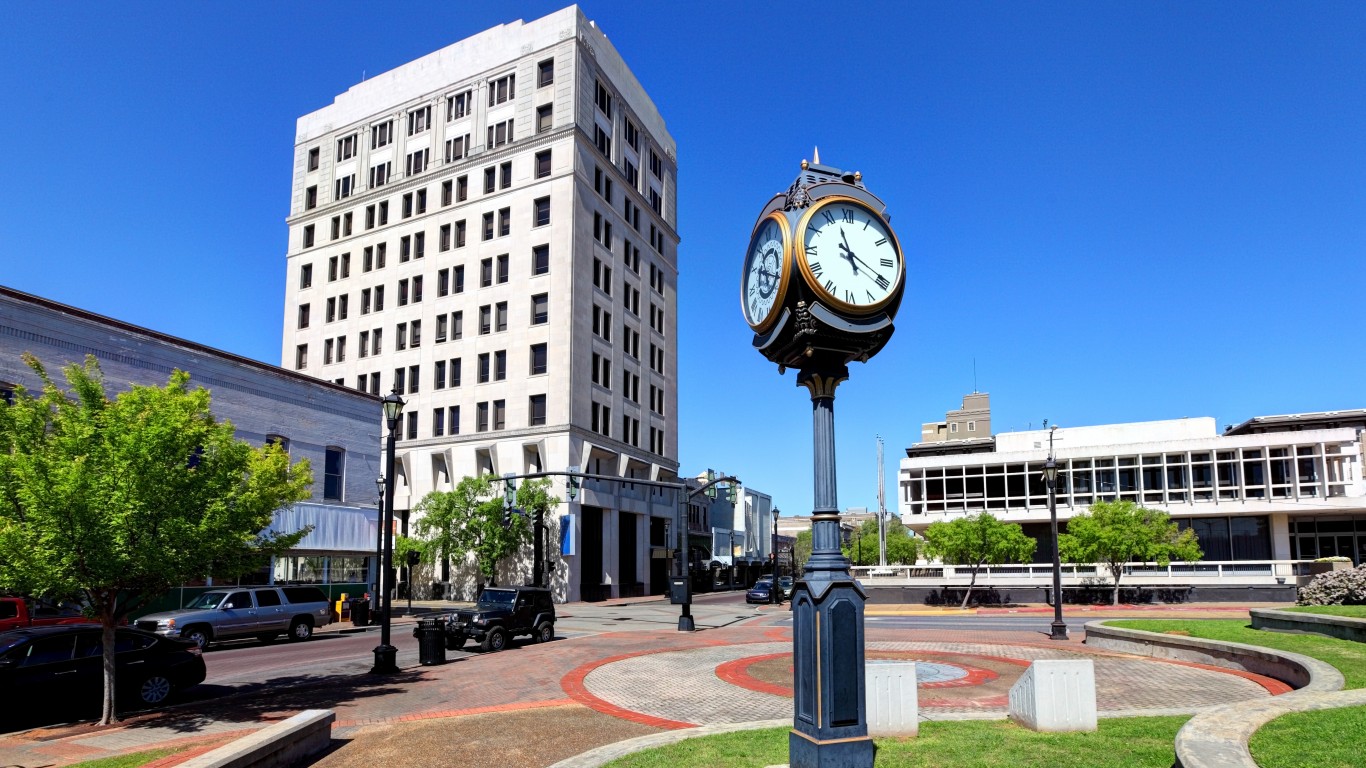
7. Shreveport, Louisiana

- Population change in downtown tracts from 2012 to 2022: -21.0%
- Population change of non-downtown tracts from 2012 to 2022: -8.9%
- Per capita income change in downtown tracts from 2012 to 2022: +92.2%
- Per capita income change in non-downtown tracts from 2012 to 2022: -1.2%
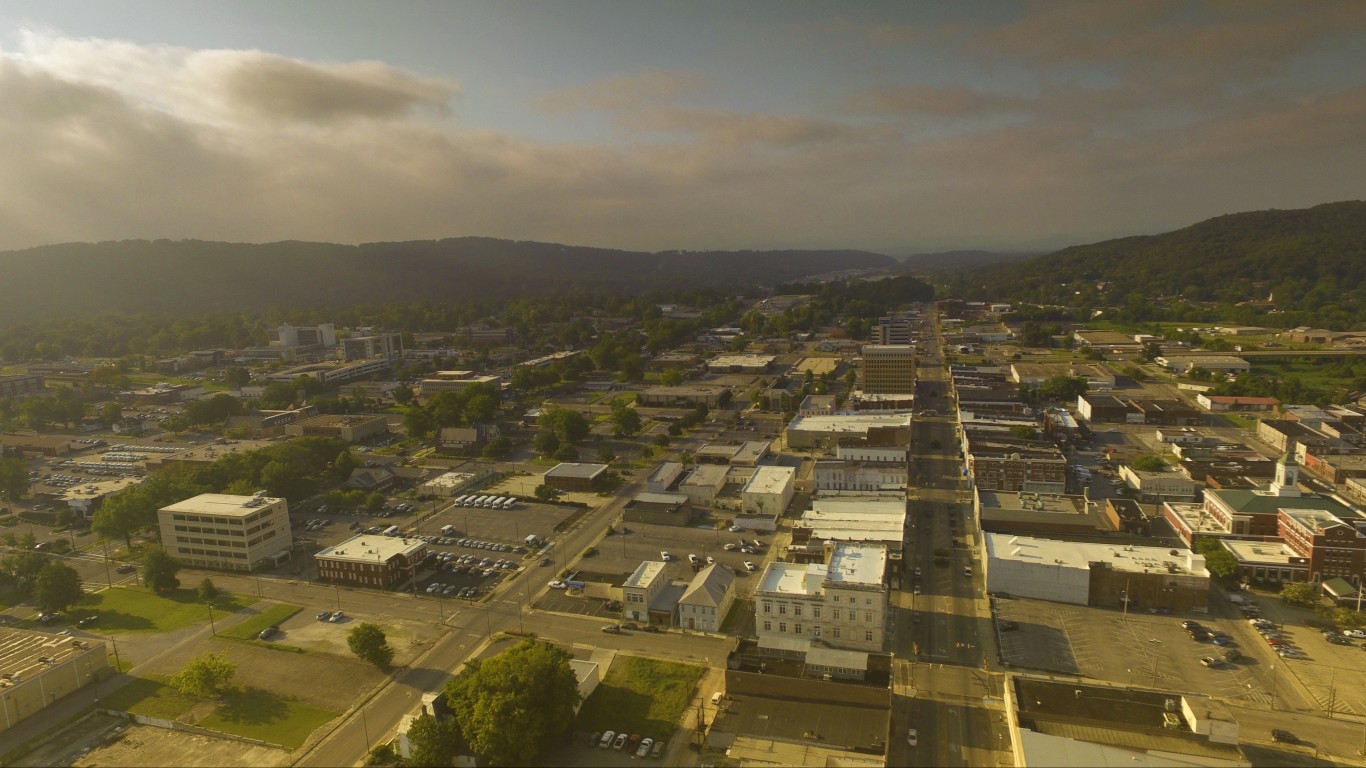
6. Alexandria, Louisiana
- Population change in downtown tracts from 2012 to 2022: -21.3%
- Population change of non-downtown tracts from 2012 to 2022: -1.0%
- Per capita income change in downtown tracts from 2012 to 2022: +29.3%
- Per capita income change in non-downtown tracts from 2012 to 2022: -10.3%
5. Anniston, Alabama
- Population change in downtown tracts from 2012 to 2022: -22.2%
- Population change of non-downtown tracts from 2012 to 2022: +5.9%
- Per capita income change in downtown tracts from 2012 to 2022: +10.5%
- Per capita income change in non-downtown tracts from 2012 to 2022: +4.9%
4. Birmingham, Alabama

- Population change in downtown tracts from 2012 to 2022: -22.5%
- Population change of non-downtown tracts from 2012 to 2022: -9.6%
- Per capita income change in downtown tracts from 2012 to 2022: +28.7%
- Per capita income change in non-downtown tracts from 2012 to 2022: +15.6%
3. Columbus, Georgia
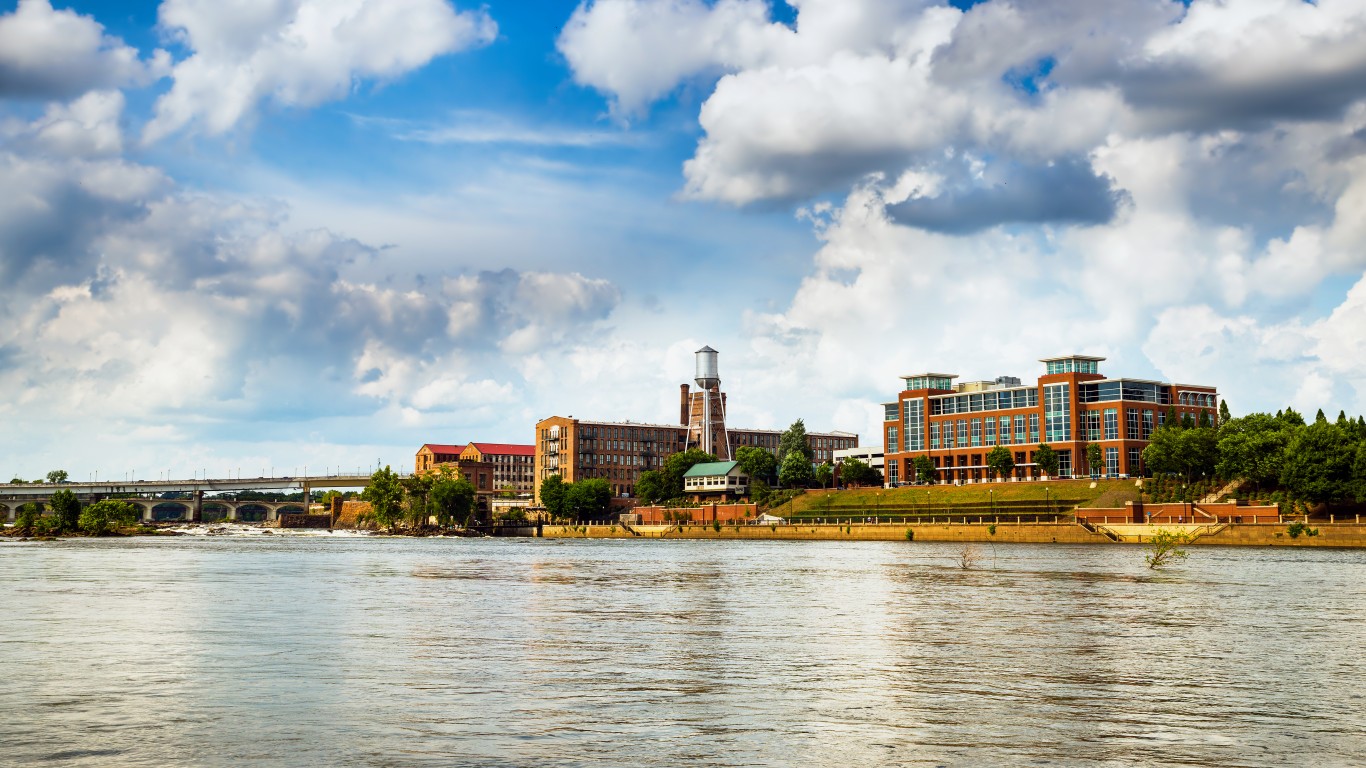
- Population change in downtown tracts from 2012 to 2022: -25.4%
- Population change of non-downtown tracts from 2012 to 2022: +3.6%
- Per capita income change in downtown tracts from 2012 to 2022: +41.4%
- Per capita income change in non-downtown tracts from 2012 to 2022: +1.0%
2. Pine Bluff, Arkansas
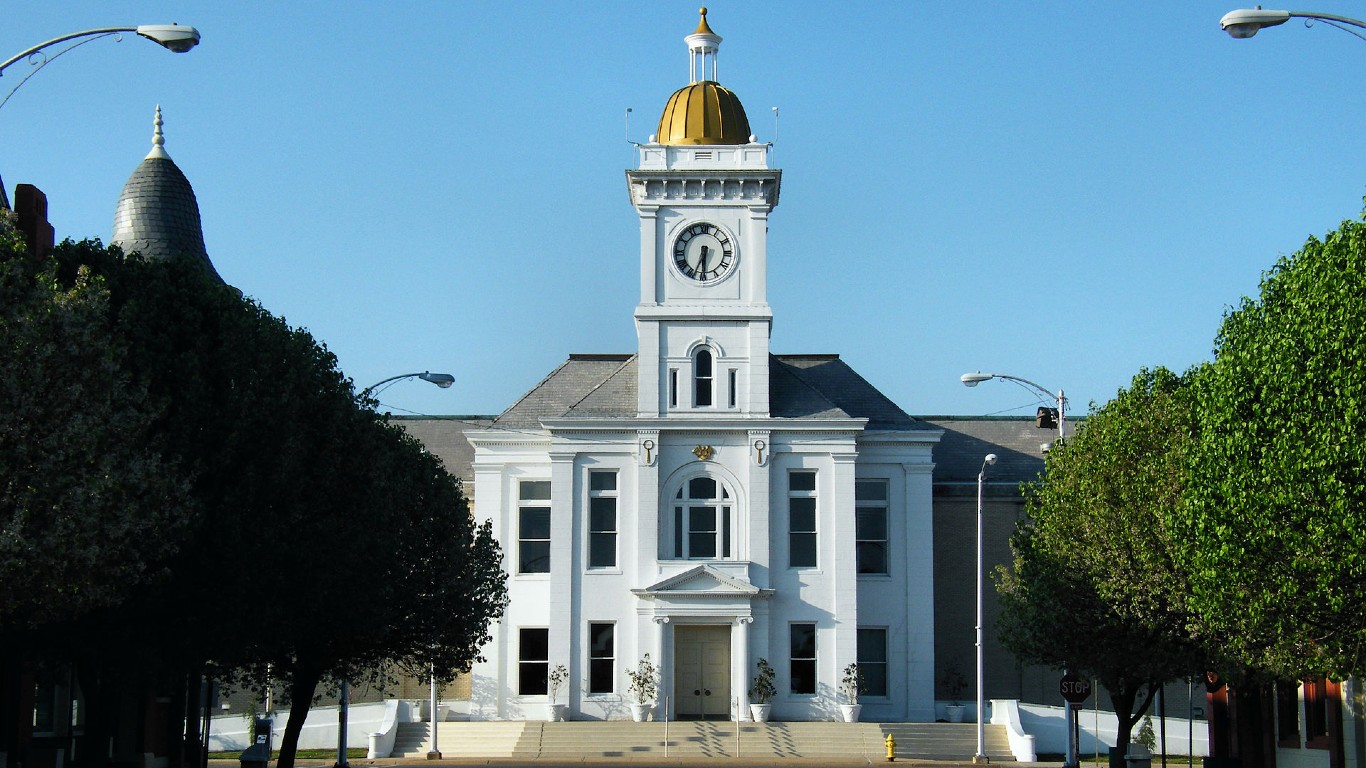
- Population change in downtown tracts from 2012 to 2022: -30.5%
- Population change of non-downtown tracts from 2012 to 2022: -10.0%
- Per capita income change in downtown tracts from 2012 to 2022: +19.1%
- Per capita income change in non-downtown tracts from 2012 to 2022: +1.4%
1. Albany, Georgia
- Population change in downtown tracts from 2012 to 2022: -39.3%
- Population change of non-downtown tracts from 2012 to 2022: -4.0%
- Per capita income change in downtown tracts from 2012 to 2022: +23.7%
- Per capita income change in non-downtown tracts from 2012 to 2022: +1.9%