Stock markets matter, and Americans should be concerned about severe market downturns. If you disagree, consider this: There have been eight major bear markets since the start of the Great Depression. All but one contributed to the ensuing — or concurrent — economic weakness, affecting anything from employment to interest rates and prices. A market drop’s ripple effects are widespread.
Read the Eight Worst Sock Markets Since The Great Depression
The stock market has often been described as forward looking — what investors believe will happen in six months. 24/7 Wall St. identified the worst bear markets since the Great Depression. The market drops averaged about 40% each. These undoubtedly destroyed a great deal of individual and corporate wealth, causing a pullback in consumer and corporate spending and, consequently, a rise in unemployment.
When 24/7 Wall St. compared each period of market downturn with national unemployment, gross domestic product and the consumer price index, we indeed found that seven of the eight largest bear markets matched the start of recessions, periods of high unemployment, or sharp inflation.
There is one exception, though. During the course of the Great Depression itself there were two bear markets. The second market drop, from 1939 to 1942, is the only one of the eight after which the economy improved. World War II helped move both employment and GDP higher. None of the other market corrections were accompanied by an event of similar magnitude.
What about the current turmoil? While not a market downturn of the same magnitude, economists have been concerned about the most recent spike in oil prices. The market drops in the early and late 1970s happened at about the time oil prices rose, and therefore, overall consumer prices rose. This smothered consumer confidence and undermined overall consumer activity.
Methodology: 24/7 Wall St. looked at the most severe market downturns, as evidenced by the biggest slide in the Dow Jones Industrial Average, and looked at national unemployment rates from the Bureau of Labor Statistics and GDP per capita from Bureau of Economic Analysis for corresponding years. We then analyzed the historical situations to understand the effects either caused by or corresponding with market downturns.
1. 1929-32
> DJIA decline from peak to trough: 90%
> Unemployment: 24.9% (1933)
> Change in unemployment: 678.1% (1929-33)
> Change in GDP: -21.4% (1930-33)
> Consumer price index: -9.9% (1932)
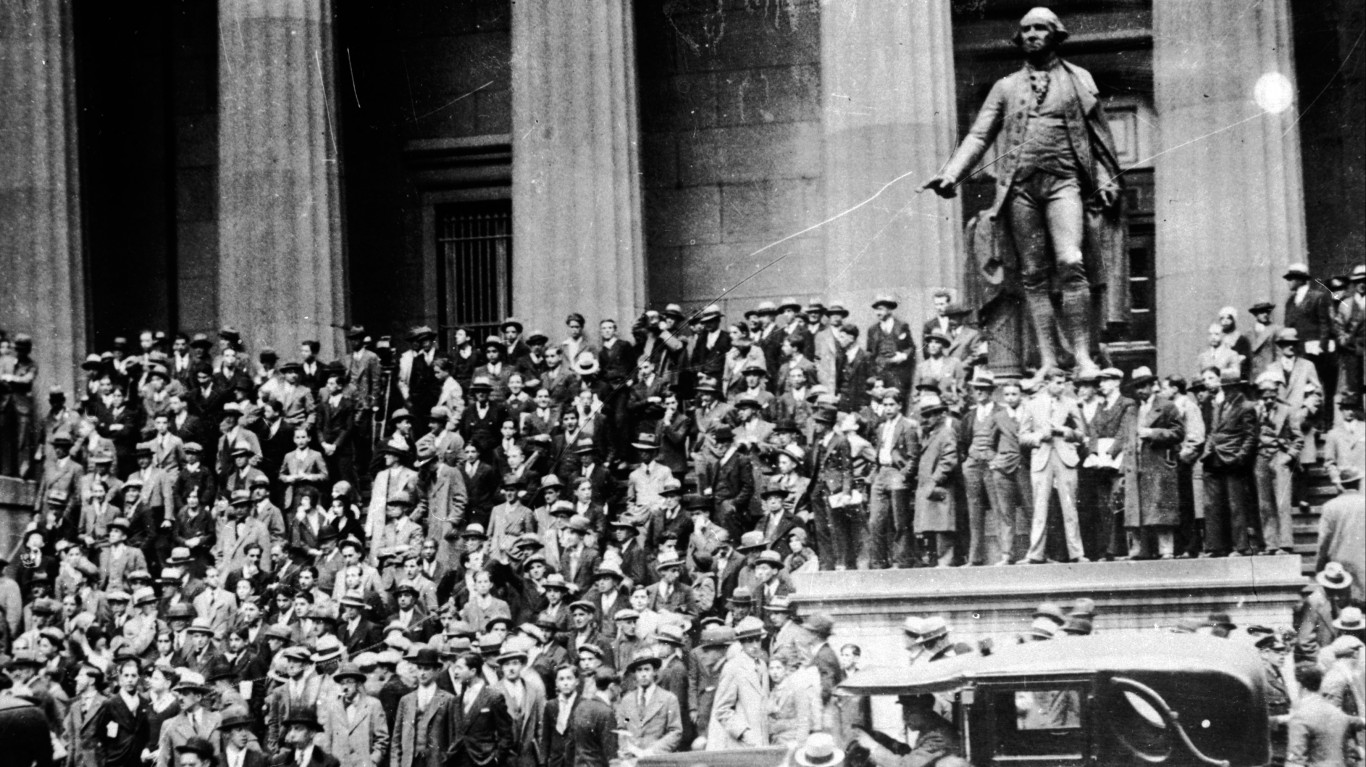
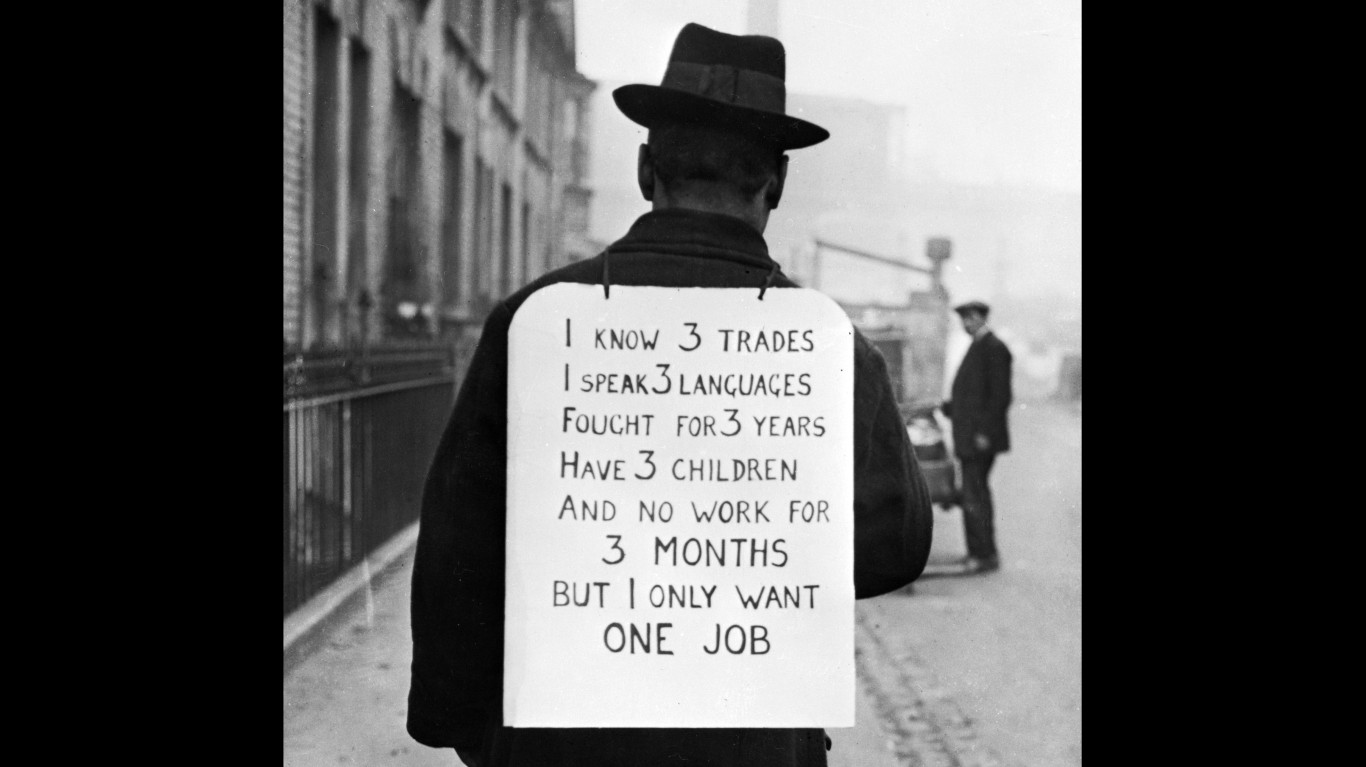
Triggered by a period of rampant speculation, the stock market had its worst crash ever in 1929. Beginning with “Black Tuesday,” the market lost a quarter of its value in just two days. From peak to trough, the Dow Jones Industrials declined a massive 90%. The crash marked the beginning of the Great Depression, during which unemployment reached nearly 25%, up from 1929’s rate of 3.2%. Thirteen to 15 million people were left without work in the U.S.
2. 2007-09
> DJIA decline from peak to trough: 54%
> Unemployment: 9.3% (2009)
> Change in unemployment: 102.2% (2007-09)
> Change in GDP: -4.4% (2007-09)
> Consumer price index: -0.4% (2009)
The effects from the down markets of the late 2000s are still being felt today. The U.S. economy had been built up on overextended consumer credit and faulty mortgages, and as these risks were exposed a number of major American financial institutions either collapsed or were bailed out by the federal government. This set off the Great Recession. The national unemployment rate more than doubled from December 2007 to October 2009, increasing from 5.0% to 10.1%. The price of commodities, such as oil, skyrocketed while housing prices tumbled.
3. 1937-38
> DJIA decline from peak to trough: 52%
> Unemployment: 19% (1938)
> Change in unemployment: 32.9% (1937-38)
> Change in GDP: -4.2% (1937-38)
> Consumer price index: -2.1% (1938)
In 1937,there was another major downturn in the economy. Although unemployment had remained high since the depression — floating around 14% in 1937 — it increased to 19% in 1938. GDP per capita also fell from $7,971 to $7,638. During that time, the Dow fell by more than 50%.
4. 1973-74
> DJIA decline from peak to trough: 46%
> Unemployment: 8.5% (1975)
> Change in unemployment: 73.5% (1973-75)
> Change in GDP: -2.6% (1973-75)
> Consumer price index: 11% (1974)
From January 1973 to December 1974, the stock market lost 46% of its value. This happened after the end of the Bretton Woods monetary system and was heightened by the 1973 oil crisis. The U.S. economy entered a recession that was distinctly marked by stagflation: a combination of high inflation and high unemployment. Unemployment peaked at 9% in May 1975. From 1972 to 1973, inflation more than doubled to 8.8%, and continued to rise for the remainder of the decade.
5. 1939-42
> DJIA decline from peak to trough: 39%
> Unemployment: 17.2% (1939)
> Change in unemployment: -72.7% (1939-42)
> Change in GDP: 7.9% (1939-40)
> Consumer price index: 10.9% (1942)
The Great Depression is widely regarded as having ended in 1939. This is also the year that marks the beginning of World War II. The country’s desperately high unemployment rate finally began to improve, dropping as low as 1.2% by 1944. Excitement over the economic effects of the war caused a buying frenzy in the U.S. From late August to mid-September 1939, the Dow jumped 20%. The buying panic quickly died, however, and markets began to decline. The economy was saved, however, by the war effort.
6. 1968-70
> DJIA decline from peak to trough: 36%
> Unemployment: 5.9% (1971)
> Change in unemployment: 63.9% (1968-71)
> Change in GDP: 1.1% (1968-70)
> Consumer price index: 5.7% (1970)
Many consider the 1968-1970 bear market as one that actually lasted to 1982. Over the two year period listed, however, the Dow lost approximately 36% of its value. Unemployment, which was as low as 3.4% in 1968, reached 6.1% by the end of 1970. Between 1968 and 1970, the Dow fell from 906 points to 753.19.
7. 2000-02
> DJIA decline from peak to trough: 34%
> Unemployment: 6% (2003)
> Change in unemployment: 33.3% (2000-03)
> Change in GDP: 0.9% (2000-02)
> Consumer price index: 3.4% (2000)
The U.S. essentially had a decade-long bull market throughout the 1990s. As a result, stock values were largely inflated. This trend turned around in 2000. Many technology companies either went out of business or lost value. Wariness of the market was later compounded by the September 11 attacks. In September 2002, the Dow hit a four-year low. From peak to trough, the Dow lost 34% of its value.
8. 1976-78
> DJIA decline from peak to trough: 27%
> Unemployment: 7.7% (1976)
> Change in unemployment: -20.7% (1976-78)
> Change in GDP: 8.2% (1976-78)
> Consumer price index: 13.5% (1980)
The market dropped 27% from peak to trough during the 1976 bear market. A new peak was not reached until January 1981. Investors were hurt at a much greater level than the rest of the country during these years. Both employment and GDP per capita increased annually from 1976 through 1979. The rise in consumer prices ,which was driven by the rise in the price of oil prices, peaked around 1980, slowing economic activity.
Charles Stockdale and Douglas A. McIntyre