24/7 Wall Street Key Points
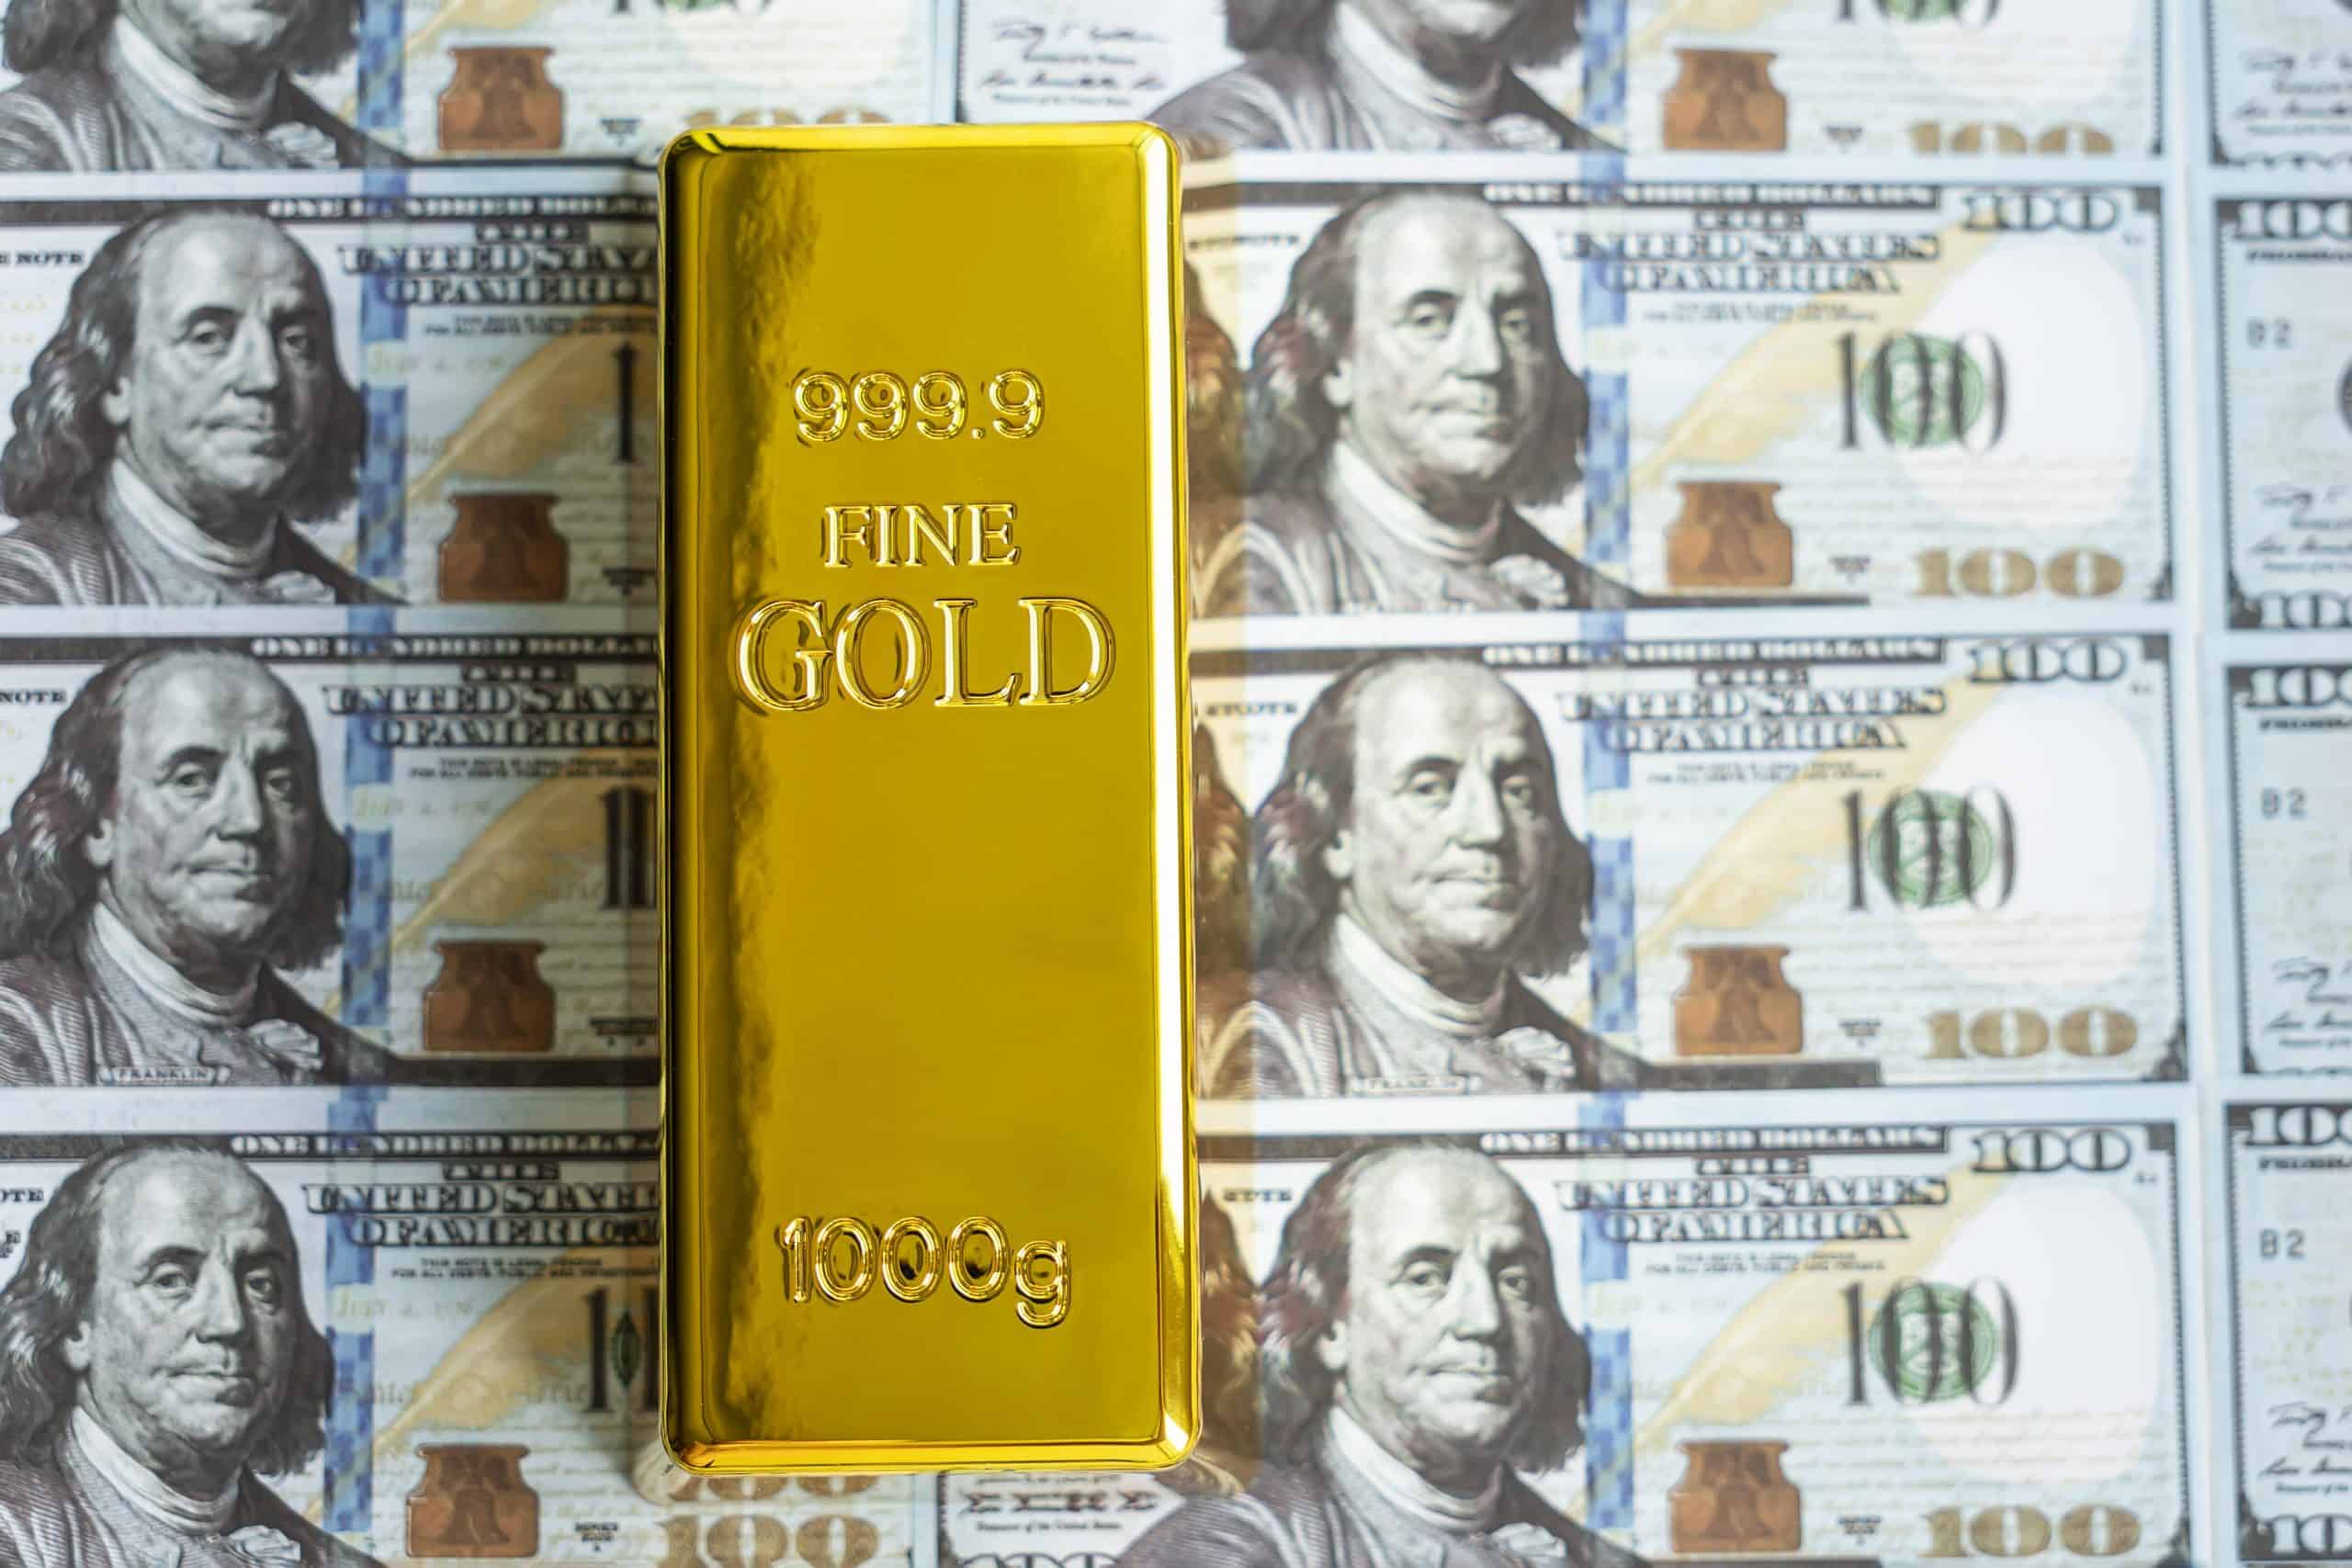
- With inflation in December and November 2024 showing a cumulative 5.6% rise, inflation is far from over, and US dollar buying power continues to shrink.
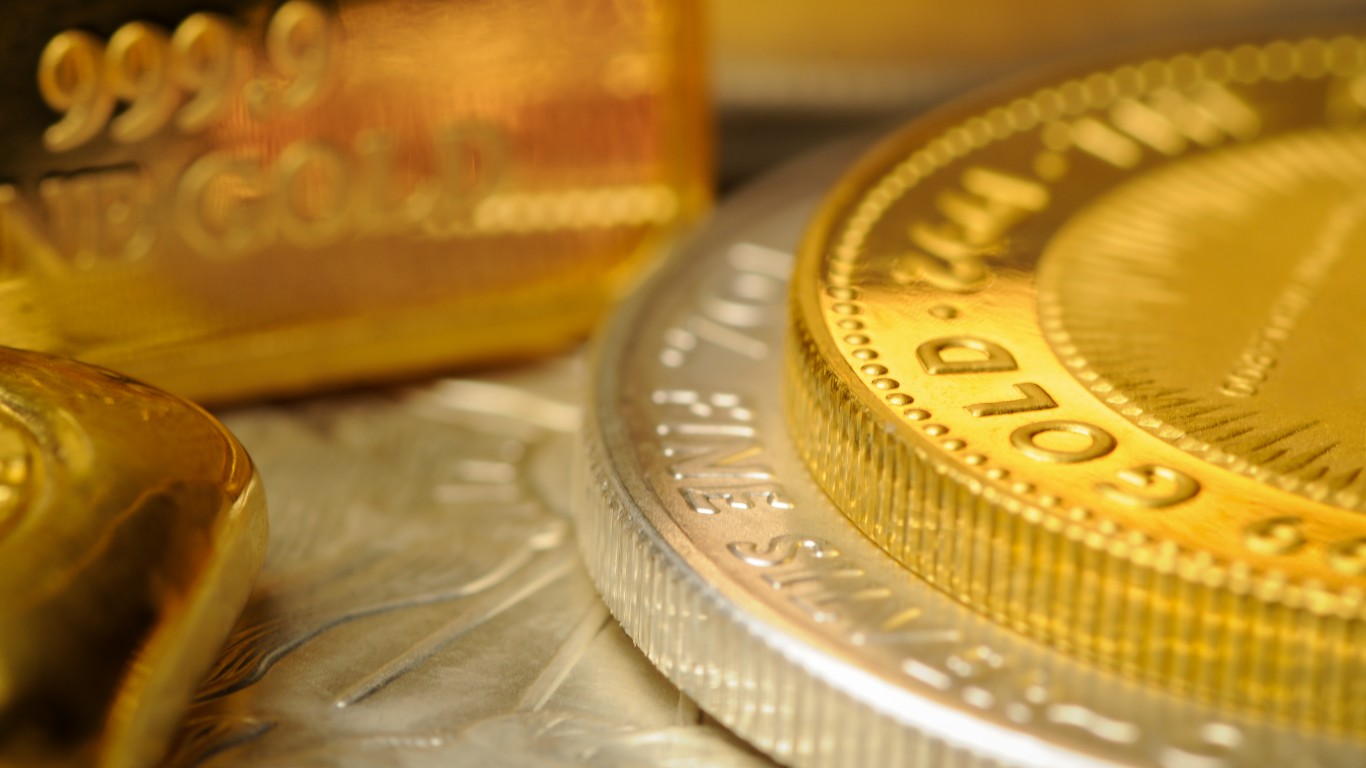
- Gold is a historical inflation hedge, but its physical handling and storage poses security and transport issues. Additionally, its utility as a mode of exchange can be limited.
- SPDR Gold Shares and SPDR Gold MiniShares are ETFs that can give individual investors exposure to gold in a format that fits with their other financial assets in a brokerage or IRA account.
- Retiring early is possible, and may be easier than you think. Click here now to see if you’re ahead, or behind. (Sponsor)
Gold As An Inflation Hedge

The Consumer Price Index inflation report shows that December saw a 2.9% rise on top of a previous November 2.7% rise. Despite media talking heads’, bureaucrats’ and politicians’ narratives to the contrary, this inflation trend means a 5.6% inflation rise in 60 days.
Investment portfolios seeking hedges for inflation often will look towards commodities or other assets that retain value vs. depression of fiat currencies. Gold has a long history as an inflation hedge, dating back centuries. Since currency itself is a derivative of precious metals like gold, the tangible asset will inevitably appreciate as the overabundance of paper currency stimulates further inflation and devaluation.
However, not everyone can avail themselves of secure storage for physical gold, let alone outlets to achieve reliable liquidity, and the means to safely transport it without fears of robbery. Luckily, there are Exchange Traded Funds (ETF) for gold through which individual investors can avail themselves of exposure in a convenient fashion uniform with the rest of their financial portfolios. Two to scrutinize for consideration are: SPDR Gold Shares (NYSE: GLD | GLD Price Prediction) and SPDR Gold MiniShares (NYSE: GLDM).
SPDR Gold Shares (NYSE: GLD)
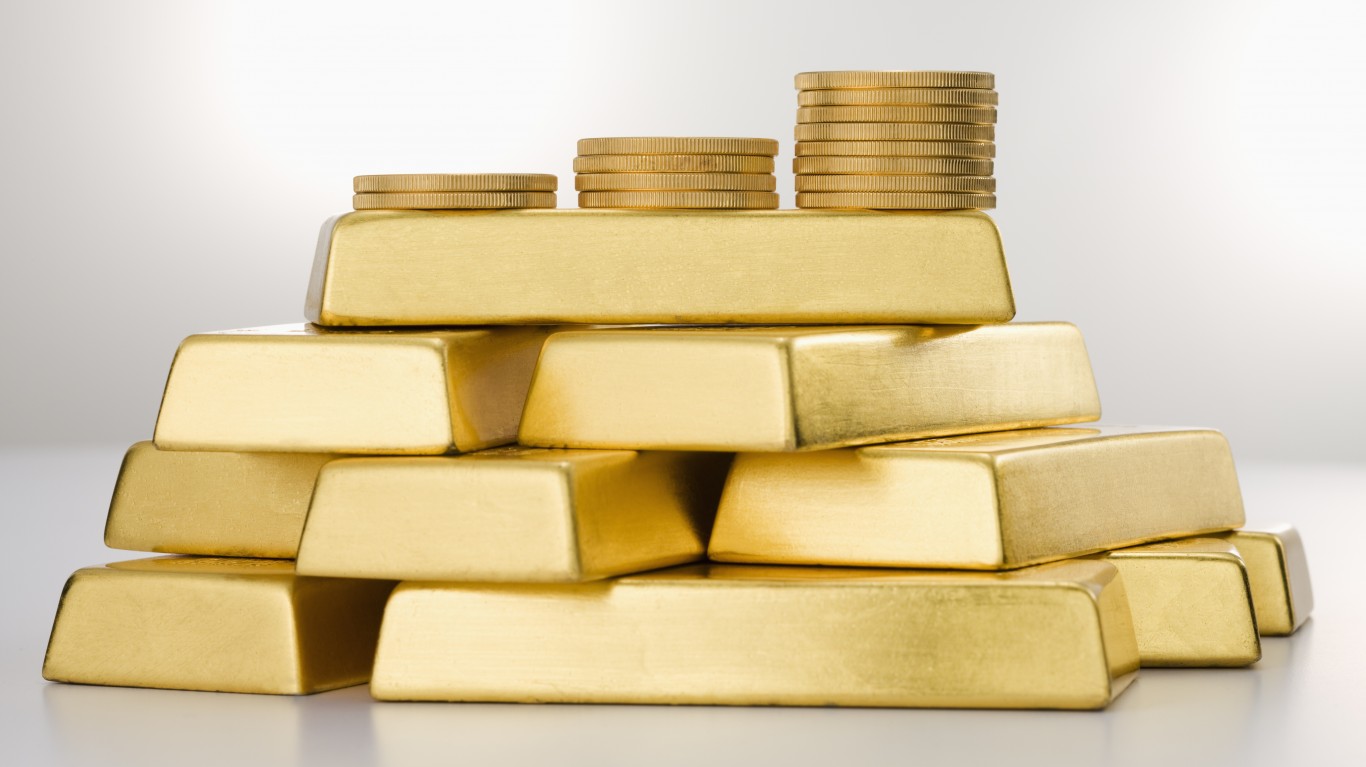
Hallmarked gold bars in secure storage
Founded by State Street Global Advisors in 2004, GLD is an ETF that trades on the NYSE in the U.S. GLD also trades on exchanges in Mexico, Singapore, Hong Kong and Japan. It houses a trust that buys, stores, and sells gold bullion in bars or in smaller configurations divided into baskets. GLD is intended to avail investors access to the benefits of gold bullion ownership exposure on a prorated basis. 24/7 Wall Street has published past articles mentioning GLD. A GLD overview profile appears as thus:
| 52 week price range | $183.78 – $257.71 |
| Average Daily Volume | 6.58 million shares |
| Net Assets | $75.2 billion |
| Beta (5Y monthly) | 0.18 |
| Expense ratio | 0.40% |
| 12-month target price (tech analysis) | $272.89 – $289.13 |
| Market price at time of writing | $248.85 |
| Institutional Holders | 2240 |
| Largest Hedge Fund holders | Jane St. Group, BAC, JPM, MS (486 total) |
As the largest gold ETF on the market, GLD tracks the London spot market for gold, analysts who track the ETF tend to view it through a commodity trading lens. As technical analysis is much more prevalent in commodity trading, the analysts use trading pattern indicators to anticipate future market moves. Based on GLD charts from the time of this writing, GLD currently has 18 buy signals, 3 sell signals and 2 neutral signals. Therefore, the consensus would indicate a Strong Buy at this time.
SPDR Gold MiniShares (NYSE: GLDM)

State Street Global Advisors’ SPDR Gold MiniShares is structured identically to SPDR Gold Shares but with a lower fee and market price for the benefit of individual investors.
Also a State Street Global Advisors product, GLDM was created with a low 0.10% fee as a cost-conscious alternative for investors seeking exposure to gold but reluctant due to GLD’s 0.4% expense ratio. Since its founding in 2018, GLDM has traded on the NYSE. Structurally, its design and methodology is identical to GLD, albeit on a reduced scale.
| 52 week price range | $39.35 – $55.29 |
| Average Daily Volume | 2.81 million shares |
| Net Assets | $9.50 billion |
| Beta (5Y monthly) | 0.18 |
| Expense ratio | 0.10% |
| 12-month target price (tech analysis) | $61.80 – $63.12 |
| Market price at time of writing | $53.43 |
| Institutional Holders | 484 |
| Largest Fund holders | Sumitomo Mitsui, MS, Evoke Wealth |
As GLDM is tracked similarly to GLD, its technical analysis underpinnings are also comparable. At the time of this writing, GLDM has 12 buy signals, 1 sell signal, and 4 neutral signals. Therefore, the consensus would indicate a Strong Buy at this time.
How GLD and GLDM Compare

GLD’s larger AUM, volume and options availability make it preferable for institutional investors, while GLDM’s lower fee and price make it more appealing for individual investors.
GLD and GLDM operate identically, so differences are more nuanced than they might be if being compared to rival ETFs. When comparing them head to head:
Risk: As both GLD and GLDM track the London gold spot markets closely, their risk levels are fairly equivalent, as both have a 0.18 Beta. However, if there is an unexpected event that might cause a sharp rise in buying or selling on the global markets, GLD’s size gives it a liquidity advantage over its smaller cousin ETF.
Cost: GLDM’s lower 0.10% expense ratio clearly beats GLD’s more expensive 0.40% in the eyes of investors. Its share price is also roughly 75% lower than its larger cousin ETF.
Options: GLD has options, although its $240+ market price makes option strategies like covered call writing an expensive proposition. GLDM has no options at this time.
Historical Performance:
| 1m | 3m | YTD | 1y | 3y | |
| GLDM | +0.38% | +0.52% | +2.24% | +30.85% | +46.20% |
| GLD | +0.36% | +0.45% | +2.23% | +30.47% | +44.91% |
GLD is clearly the institutional investor favorite, given its larger AUM, stronger liquidity, and its options availability, which also makes it the choice of traders looking to deploy options leverage and trading strategies.
GLDM, on the other hand, is designed to appeal to individual investors, with its significantly lower expense ratio and market price. While a 2.8 million average daily volume is certainly sufficient for most trading scenarios if desired, one would think that GLDM’s retail orientation makes it more of a “buy and hold” type of ETF, similar to an S&P 500 Index ETF.