When a large-cap ETF with zero fees climbs 40% in eight months, investors notice. The BNY Mellon US Large Cap Core Equity ETF (NYSEARCA:BKLC | BKLC Price Prediction) surged from $94 per share in early April 2025 to around $131.70 today with few significant pullbacks.
What BKLC Actually Does
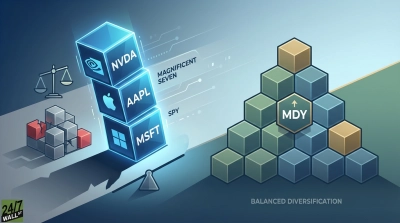
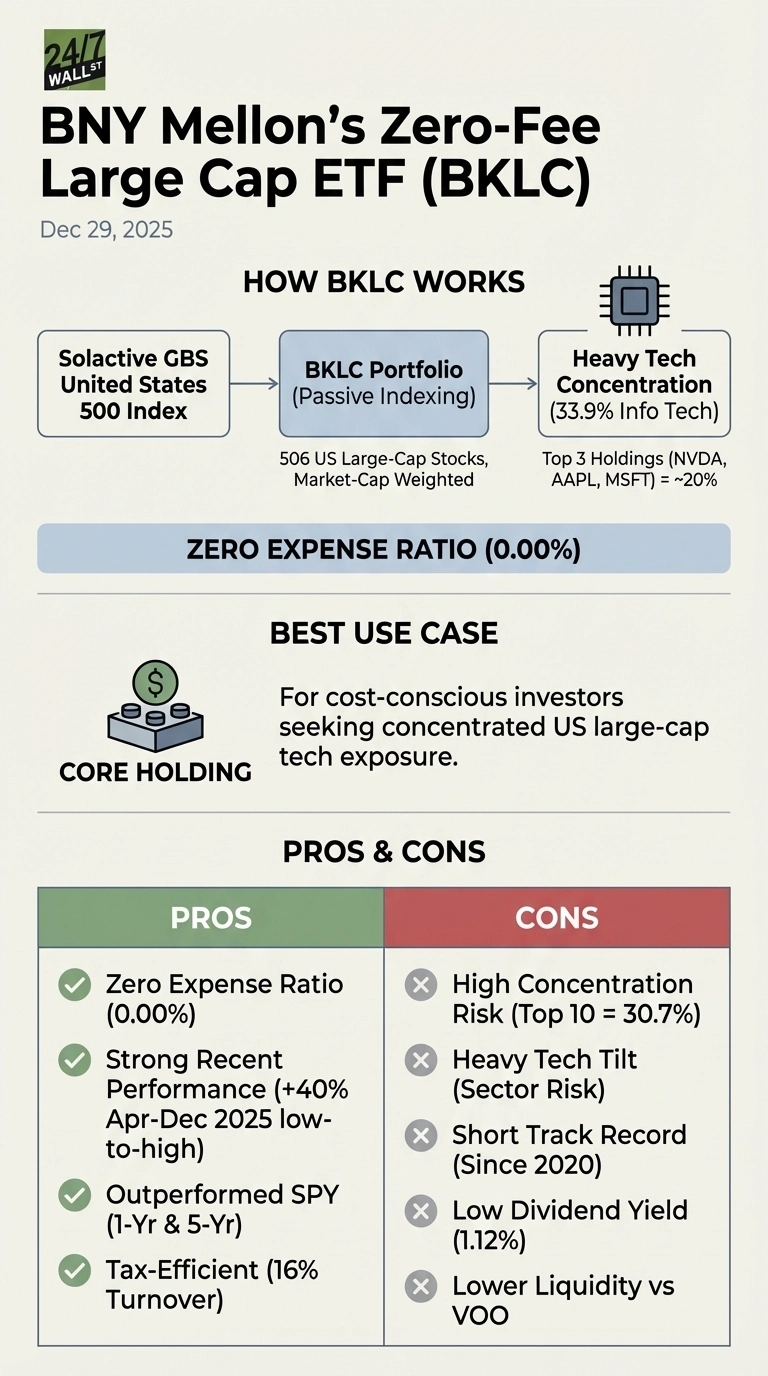
BKLC tracks the Solactive GBS United States 500 Index, a market-cap-weighted index of the 500 largest U.S. companies. It holds 506 stocks with heavy concentration in mega-cap technology. NVIDIA represents 7.3% of the portfolio, Apple 6.6%, and Microsoft 6.0%. Information technology accounts for 34% of assets, followed by financials at 12% and communication services at 11%.
The ETF delivers appreciation and dividend income from large U.S. companies, weighted by market value. No derivatives, no leverage, no options strategies. It’s passive indexing with a 0.00% expense ratio, which BNY Mellon uses as a competitive wedge against VOO and SPY.
Performance That Edges Out the Competition
Over the past year, BKLC returned 15.5% compared to SPY’s 14.3%. Year-to-date through December 29, 2025, BKLC gained 18.5% versus SPY’s 17.2%. Since inception in April 2020, BKLC returned 100% compared to SPY’s 87%.
The April-to-December rally was driven by resilient earnings, AI enthusiasm, and concentrated strength in mega-cap technology. BKLC’s slightly higher allocation to top tech names gave it a small edge.
The Tradeoffs You Accept
You’re accepting concentration risk. The top 10 holdings represent 31% of the portfolio, and the top three account for nearly 20%. If NVIDIA, Apple, or Microsoft stumble, this ETF will feel it immediately.
BKLC has $5 billion in assets compared to VOO’s $1.5 trillion. Liquidity is adequate for most retail investors, but institutional players may find tighter spreads elsewhere. The zero expense ratio competes against VOO’s 0.03% fee, a difference of $30 annually on a $100,000 investment.
BKLC’s track record is short. Launched in 2020, it hasn’t been tested through a prolonged bear market or sustained value outperformance. Its methodology tilts slightly more toward growth than the S&P 500.
Who Should Avoid This ETF
If you’re looking for diversification beyond U.S. large caps, BKLC offers none. It’s 100% domestic, 100% large-cap, and heavily tilted toward technology.
Income-focused investors should reconsider. BKLC’s dividend yield is 1.1%, paid quarterly. If you’re building a portfolio around consistent income, there are better options.
Consider VOO as an Alternative
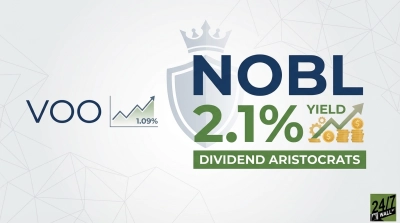
The Vanguard S&P 500 ETF (NYSEARCA:VOO) serves the same role as BKLC but with deeper liquidity and a longer track record. VOO has $1.5 trillion in assets compared to BKLC’s $5 billion, which translates to tighter bid-ask spreads and more reliable execution for larger trades. Its 0.03% expense ratio costs just $3 per year on a $10,000 investment.
VOO tracks the actual S&P 500, not a similar index, giving you the exact benchmark most institutional investors use. If you value liquidity and a 15-year performance history over saving $30 annually, VOO is the safer choice.
BKLC works well as a core holding for cost-conscious investors comfortable with tech-heavy exposure, but its short history and smaller asset base mean you’re trading proven scale for a zero expense ratio.