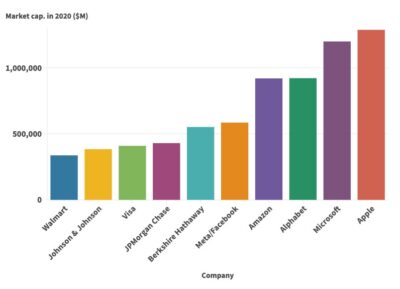
The Magnificent Seven stocks represent 35% to 40% of the S&P 500, creating historically high concentration risk for investors heading into 2026. While tech exposure remains essential, betting on seven mega-cap names leaves portfolios vulnerable to sector-specific shocks and valuation compression. Fidelity MSCI Communication Services Index ETF (NYSEARCA:FCOM) offers a compelling alternative: pure-play communications sector exposure including the tech giants investors want, plus infrastructure companies they’re overlooking.
Broader Tech Exposure Without the Concentration Trap
FCOM provides access to the communications sector’s growth engines while spreading risk across 99 holdings instead of seven stocks. Meta Platforms (NASDAQ:META | META Price Prediction) represents 23.5% of the portfolio and Alphabet (NASDAQ:GOOGL) (combined GOOGL and GOOG shares) accounts for 23.3%, delivering the digital advertising and platform exposure investors seek. The ETF’s real differentiation lies in its 13.4% allocation to traditional communications infrastructure: Verizon (NYSE:VZ) (3.9%), AT&T (NYSE:T) (3.8%), Comcast (NASDAQ:CMCSA) (3.0%), and T-Mobile (NASDAQ:TMUS) (2.7%).
These infrastructure holdings generate substantially higher dividend yields than pure tech plays, with Comcast and Verizon both yielding around 4.7% compared to Meta’s 0.31%. As Anthony Saglimbene, Chief Market Strategist at Ameriprise Financial (NASDAQ:AMP), noted in December 2025, investors should focus on strategies designed to uncover opportunities beyond the Magnificent Seven as concentration risk reaches historic levels.
The ETF’s 0.084% expense ratio costs just $8.40 annually per $10,000 invested. With $1.9 billion in assets and a 12-year track record since October 2013, FCOM has delivered a 240% total return over ten years.
Strong Fundamentals Across the Portfolio
Meta generated $189.5 billion in trailing revenue with a 30.9% profit margin and operating margin exceeding 40%. The company’s 26.2% quarterly revenue growth and 32.6% return on equity illustrate sustained profitability at scale. Analyst sentiment remains overwhelmingly positive, with 60 buy ratings versus zero sell ratings.
Walt Disney Company (NYSE:DIS), representing 4.3% of the portfolio, showcases the ETF’s diversification into entertainment and experiences. Despite trading at 17x compared to Meta’s 29x, Disney recently posted 187% earnings growth year-over-year as its streaming operations approach profitability. The company’s 1.31% dividend yield adds income generation. Netflix (NASDAQ:NFLX) represents 3.6% of holdings, providing additional streaming and content exposure.
The Tradeoffs You Accept
FCOM’s diversification comes with performance tradeoffs during periods when the largest tech stocks dominate. The ETF’s one-year return of 21.5% trails the Nasdaq-100’s 17.9% return, but the gap narrows over longer periods. The infrastructure holdings that provide stability and income will underperform during pure growth rallies. Verizon’s five-year return of negative 7.4% illustrates this drag, though T-Mobile’s 51% five-year gain shows infrastructure isn’t uniformly weak.
The ETF’s 0.86% dividend yield won’t satisfy income-focused investors, though it exceeds pure tech concentration. Additionally, 47.5% of assets remain concentrated in the top ten holdings, meaning FCOM still carries meaningful single-stock risk.
Who Should Avoid This ETF
Investors seeking maximum growth during tech bull markets should stick with concentrated Nasdaq-100 funds. FCOM’s infrastructure and traditional media holdings will lag during momentum-driven rallies. Income investors requiring yields above 3% should look to dedicated dividend ETFs rather than accepting FCOM’s sub-1% payout.
Consider XLC as an Alternative
The Communication Services Select Sector SPDR Fund (NYSEARCA:XLC) tracks a similar strategy with even lower expenses at 0.09% and higher liquidity through $16 billion in assets. XLC maintains slightly higher concentration in its top holdings but offers tighter bid-ask spreads for active traders.
FCOM delivers diversified communications sector exposure for investors who recognize concentration risk but still want technology’s growth potential, accepting modestly lower performance during momentum rallies in exchange for infrastructure stability.