Gap (NYSE: GAP | GAP Price Prediction) has raised its quarterly dividend by roughly 6% and authorized a fresh $1 billion share repurchase program on the same day its stock fell nearly 9.5% after earnings. For income investors, that tension is the whole story. The selloff has pushed the yield higher while management is signaling confidence in the payout. Whether that confidence is well-founded depends on what you think tariffs, Athleta, and a cautious consumer will do to Gap’s earnings over the next four quarters.
The ex-dividend date for the new $0.175 per share quarterly payment is April 8, 2026, with payment on April 29, 2026. Investors have a narrow window to capture it.
Yield and Dividend Growth
At the current price near $24, Gap’s annualized dividend of approximately $0.645 per share translates to a yield of roughly 2.33%. That is meaningfully above where it stood before the selloff. The stock was trading near $29 just a month ago.
The growth trajectory is modest but real. Gap held its quarterly dividend flat at $0.15 a share through all of 2023 and 2024, then raised it to $0.165 beginning in January 2025, and has now raised it again to $0.175 for Q1 2026. That is two consecutive annual increases after years of stagnation. Context matters here: before the COVID-era dividend cut, Gap was paying $0.2425 per share quarterly, so the current payout still sits well below pre-pandemic levels. Investors should view this as a recovering dividend, not a growth dividend with a long track record.
Payout Safety
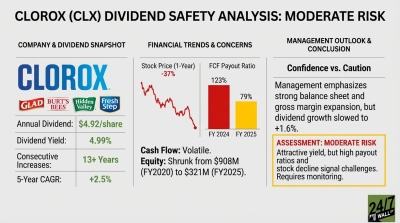
The payout ratio is conservative. Full-year dividend payments of $225 million compared to net income of $816 million represent a payout ratio of approximately 26.7%, leaving substantial room for the dividend even if earnings compress. Free cash flow coverage is even more reassuring: Gap generated $823 million in free cash flow in fiscal 2025 against $247 million in dividend payments, a coverage ratio of 3.3x.
The forward picture is more complicated. Full-year fiscal 2026 adjusted diluted EPS guidance of $2.20 to $2.35 is above fiscal 2025’s $2.13, but Q1 carries a specific headwind: gross margin is expected to decline 150-200 basis points, with tariffs accounting for approximately 200 basis points of that pressure. Critically, the full-year guidance is based on tariff rates as of prior to February 20, 2026, meaning any escalation from current levels introduces downside risk to those EPS figures and, by extension, to dividend sustainability assumptions.
One historical flag worth noting: in fiscal 2021, Gap suspended its dividend entirely during pandemic stress, and in fiscal 2022, it paid $220 million in dividends while generating negative free cash flow of −$78 million. The company has demonstrated both the willingness to cut and the willingness to maintain the payout through stress, which makes the current balance sheet position all the more relevant.
Balance Sheet and Liquidity
The balance sheet has strengthened materially. Gap held $3.5 billion in cash at fiscal year end with a net debt position (total debt minus cash) of $1.5 billion, meaning it is technically net cash on a gross debt basis. The current ratio stands at 1.60x, up from 1.42x the prior year, and total equity has grown to $3.264 billion, up $669 million year-over-year.
The leverage picture shifts when lease obligations are included. Capital lease obligations of $3.985 billion bring total debt plus leases to $6.107 billion, or 1.87x equity, elevated, but improved from 2.02x the prior year and down sharply from the 2.77x peak in fiscal 2023. This is standard for a large-format apparel retailer with hundreds of store leases, but it does mean Gap carries significant fixed obligations that limit financial flexibility in a downturn.
Business Stability
The underlying business shows a mixed but broadly positive picture. Q4 fiscal 2025 marked the eighth consecutive quarter of positive comparable sales, with 3% comp growth overall. The Gap brand itself was the standout: net sales rose 8% with 7% comparable sales growth. Old Navy, the volume engine, delivered 3% revenue growth to $2.273 billion.
Athleta remains the persistent drag. The brand posted an 11% sales decline with comparable sales down 10% in Q4, continuing a pattern that has weighed on consolidated results for several quarters. Until Athleta stabilizes, it will remain a source of uncertainty in Gap’s overall earnings trajectory.
On the macro side, the backdrop for discretionary apparel is not favorable. The University of Michigan Consumer Sentiment index stood at 56.4 in January 2026, well into pessimistic territory and near recessionary-adjacent levels. The 12-month range has been 51.0 to 61.7, reflecting persistent fragility in consumer confidence that could pressure discretionary spending in the quarters ahead.
Shareholder Returns and Capital Allocation
The combination of a dividend increase and a new buyback authorization on the same day as earnings is a deliberate signal from management. The $1 billion repurchase program supersedes the existing authorization from February 2019. With shares outstanding of approximately 371.9 million and a market cap of roughly $10.1 billion, a $1 billion buyback represents meaningful potential reduction in share count if executed.
CEO Richard Dickson framed the results with characteristic optimism: “Financial and operational rigor combined with the strength of our platform drove one of our highest gross margins in the last 25 years and further strengthened our balance sheet.” The gross margin achievement is genuine. Fiscal 2025 gross margin reached one of the highest levels in 25 years, but Q1 guidance shows that margin is now under direct pressure from tariffs.
Near-Term Risk and What to Watch
The post-earnings selloff was not driven by what Gap reported but by what Gap guided. Q4 EPS of $0.45 beat the $0.38 consensus by 18.42%, and revenue of $4.236 billion was essentially in line with the $4.242 billion estimate. The market’s reaction was forward-looking: Q1 fiscal 2026 gross margin guidance of down 150-200 basis points, with tariffs the dominant driver, signals near-term earnings compression that the full-year EPS range may not fully absorb if trade policy worsens.
Gap’s stock is now down 15.7% over the past week and 18.9% over the past month, though it remains up 21.3% over the past year. The analyst consensus target of $30.83 implies meaningful upside from current levels, with 10 buy ratings and zero sell ratings among covering analysts.
For income investors, the key variables to monitor are: whether tariff rates remain at pre-February 20 levels (the basis of current guidance), whether Athleta shows any stabilization, and whether Q1 operating cash flow (historically the weakest quarter seasonally) holds up well enough to maintain dividend coverage. In the equivalent quarter last year, Gap generated negative operating cash flow of −$140 million, still paying $61 million in dividends from reserves. That pattern will repeat in Q1 fiscal 2026; the question is whether the tariff headwind makes it worse.
The payout ratio and FCF coverage ratios argue that the dividend is safe on an annual basis. The near-term pressure on margins, the macro headwind from weak consumer sentiment, and the tariff uncertainty argue for caution about how quickly Gap can grow that dividend from here.