Gabelli Dividend & Income Trust (NYSE:GDV) trades near $29 and pays a $0.15 monthly distribution, up from $0.11 per month in 2024 to $0.14 in 2025 to $0.15 starting January 2026. At the current price, that yields roughly 6.1% annualized yield, well above the 10-year Treasury at about 4.3%. The question for income investors in 2026 is whether that yield is durable or whether structural risks offset the appeal.
How GDV Generates Income
GDV is a closed‑end management investment company with a fixed share count trading on the NYSE. Its objective is “a high level of total return with an emphasis on dividends and income,” achieved through a portfolio of dividend‑paying equities and active trading for capital gains. The fund employs leverage through preferred share issuances, allowing it to hold more securities than its equity base alone would support. Leverage boosts income in rising markets and magnifies losses in declining markets.
The portfolio holds roughly $2 billion in net assets across a diversified set of sectors, led by Financial Services, Health Care, Food and Beverage, Computer Software and Services, and Diversified Industrial. Top holdings include Mastercard, JPMorgan Chase, American Express, Bank of New York Mellon, and Microsoft. The fund’s total expense ratio, including leverage costs, is around 1.5%, which is high relative to passive alternatives.
The Holdings Driving the Dividend
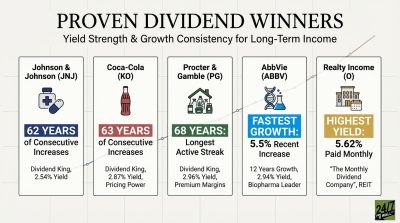
GDV’s health care and consumer defensive allocations include Johnson & Johnson (NYSE:JNJ | JNJ Price Prediction), Procter & Gamble (NYSE:PG), AbbVie (NYSE:ABBV), and Coca-Cola (NYSE:KO), all established cash-flow leaders with strong dividend histories.
Johnson & Johnson has raised its dividend for 64 consecutive years, most recently with a 3.1% increase to $1.34 per quarter, declared on April 14, 2026. Its earnings payout ratio is near 60%, based on a $5.36 annual dividend and $11.03 diluted TTM EPS, a comfortable level. Q1 2026 free cash flow of $1.5 billion fell 55% year-over-year, with full-year 2025 free cash flow of $19.70 billion. Revenue grew 9.9% to $24.06 billion in Q1 2026, with management guiding for full-year revenue of $100.3 billion to $101.3 billion.
Procter & Gamble’s payout ratio of roughly 64%, based on a $4.23 annual dividend, is healthy for the consumer staples sector. Margin compression is a concern: gross margin contracted 50 basis points in Q2 fiscal 2026, and a roughly $400 million after-tax tariff headwind weighs on the full year. Operating cash flow grew 3.1% to $4.97 billion in the most recent quarter, and the company plans approximately $10 billion in dividends for fiscal 2026, indicating no near-term distribution risk.
Coca-Cola has raised its dividend for 64 consecutive years. Its payout ratio of roughly 67%, based on a $2.12 annual dividend against $3.03 TTM EPS, is moderate. More notable is that Coca-Cola paid $8.8 billion in dividends in 2025, exceeding its free cash flow of $5.3 billion. That gap is funded by operating cash flow and balance sheet capacity, with the company projecting approximately $12.2 billion in free cash flow for 2026 to normalize coverage. Currency headwinds and an IRS tax dispute are the primary risks.
AbbVie carries complexity. Its trailing earnings payout ratio appears extreme because GAAP EPS of $2.36 TTM is depressed by $5 billion in pre-tax acquired IPR&D charges in 2025. On an adjusted basis, management guided 2026 adjusted EPS of $14.37 to $14.57, against which the $1.73 quarterly dividend ($6.92 annualized) implies a payout ratio near 48%. AbbVie’s negative book value reflects its acquisition-heavy history rather than a liquidity signal, but limits its balance sheet cushion. Skyrizi and Rinvoq grew 31.9% and 28.6%, respectively, in Q4 2025, more than offsetting Humira erosion.
Total Return and Structural Risks
GDV has delivered +7.72% year-to-date through April 21, 2026, outpacing the S&P 500’s +3.63% return. The one-year picture is similarly favorable, with GDV returning +41.56% versus the S&P 500’s +37.53%. Over three years, however, GDV returned +58.67% against the S&P 500’s +69.99%, indicating longer-term underperformance.
Leverage adds risk in stress scenarios. GDV recently traded at a 12.3% discount to its net asset value, which widens during downturns and reduces share value even when holdings hold steady. The fund’s press release noted that 2026 distributions would include approximately 4% return of capital, a distinction for investors evaluating income versus capital return. The VIX recently peaked near 31 in late March 2026 before retreating to nearly 19. Leverage-amplified volatility remains a factor in stress scenarios.
Key Considerations
GDV’s top holdings carry multi-decade dividend histories and investment-grade balance sheets. Three of the four names are Dividend Kings with multi-decade growth streaks, and active management produced above-market returns over the past year. The 6.1% yield is supported by real dividend income from durable businesses with no imminent cut signals. Primary risks are structural: the 1.5% expense ratio compresses long-term returns, leverage amplifies drawdowns, and NAV discounts can widen unpredictably. The 1.5% expense ratio and leverage mechanics are factors that affect long-term compounding relative to lower-cost alternatives.