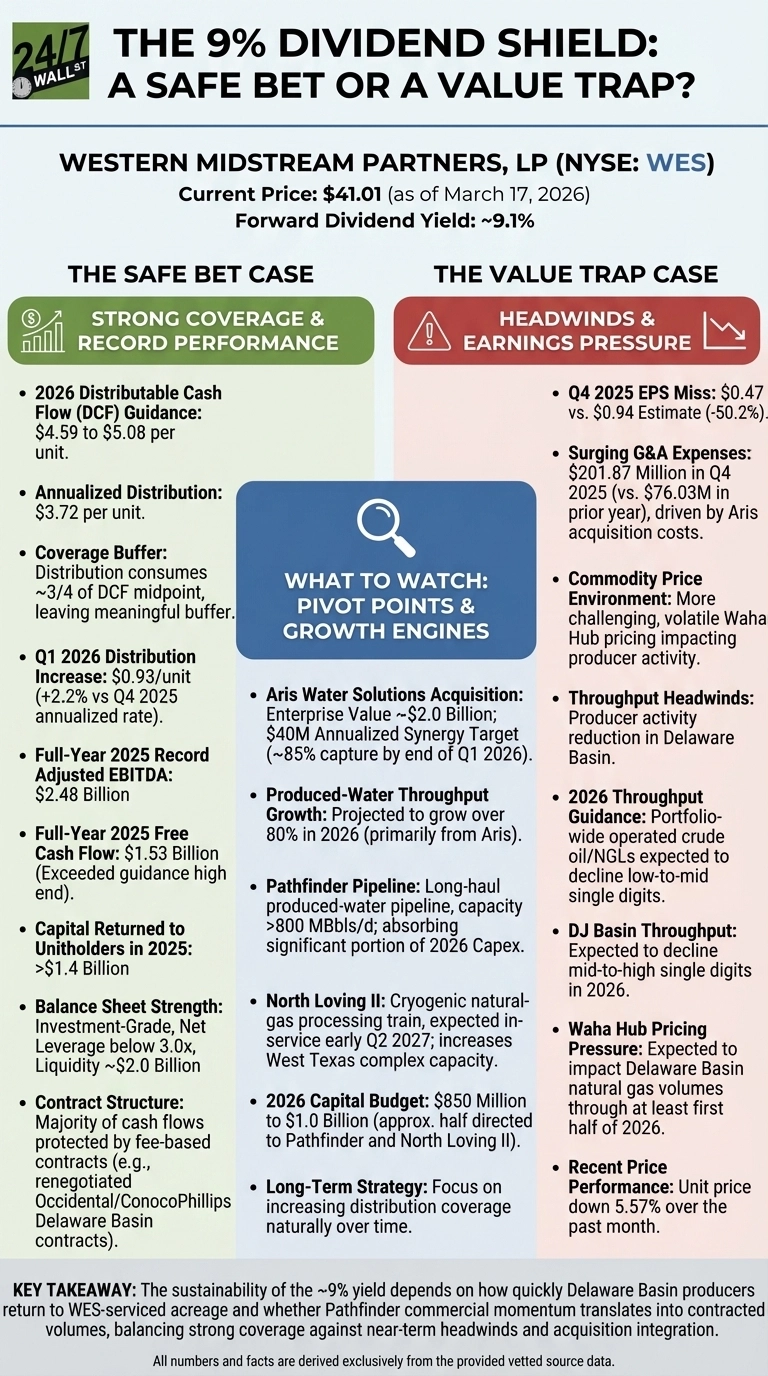
Owning and operating midstream energy infrastructure, Western Midstream Partners (NYSE:WES | WES Price Prediction) just handed investors a distribution hike to $0.93 per unit for Q1 2026, lifting the annualized payout to $3.72 per unit. At the current unit price of $41.01, that works out to roughly a 9.1% forward yield. The question: is that yield a genuine return of capital strength, or a warning sign dressed up as generosity?
The Case for Safe Bet
The coverage math is hard to argue with, especially when you consider that WES guided 2026 distributable cash flow of $4.59 to $5.08 per unit, implying the $3.72 annualized distribution consumes roughly three-quarters of the DCF midpoint, leaving a meaningful buffer even at the low end of guidance. CEO Oscar Brown framed the strategy deliberately: “We’ve been discussing distribution coverage for over a year, particularly regarding our plan to grow it slightly behind our EBITDA growth… This gives us a 300 basis point spread, which is usually larger than we would have.”
The good news is that full-year 2025 results will provide support for this confidence level, as WES posted a record adjusted EBITDA of $2.48 billion and free cash flow of $1.53 billion, exceeding the high end of its own guidance. The partnership returned more than $1.4 billion to unitholders in 2025 while keeping net leverage below 3.0x and maintaining roughly $2.0 billion in liquidity. The fee-based contract structure, including renegotiated fixed-fee arrangements with Occidental and ConocoPhillips in exchange for $610 million in WES units, insulates the majority of cash flows from commodity swings.
The Case for Value Trap
The headwinds are real. Q4 2025 EPS came in at $0.47 against an estimate of $0.94, a significant miss driven largely by G&A expenses surging to $201.87 million from $76.03 million in the prior year period due to Aris acquisition costs. More structurally, Brown acknowledged on the earnings call that “many of our producers will reduce previously expected activity levels on acreage that we service, including portions of the Delaware Basin,” with Occidental specifically reallocating drilling activity away from acreage it services.
WES now expects portfolio-wide operated crude oil and NGLs throughput to decline by low-to-mid single digits in 2026, and DJ Basin throughput to fall by mid- to high single digits. Waha Hub pricing pressure is expected to weigh on Delaware Basin natural gas volumes through at least the first half of 2026. The unit price has slipped 5.57% over the past month, underperforming the broader market since the Q4 filing.
What to Watch
The pivot point is the Pathfinder-produced water pipeline and the North Loving II processing train, which absorb roughly half of the $850 million to $1.0 billion 2026 capital budget. Produced-water throughput is projected to grow over 80% in 2026, primarily from the Aris acquisition, giving WES a growth engine less sensitive to short-term drilling pullbacks. CFO Kristen Shults was direct about the long-term direction: “We will most likely pursue a rate of growth slightly less for the distribution in order to increase distribution coverage naturally over time.”
Whether the current 9% yield represents a floor or a ceiling depends on how quickly Delaware Basin producers return to WES-serviced acreage and whether Pathfinder commercial momentum translates into contracted volumes. Keep an eye on the Q2 2026 earnings report for updates on ‘peer participation’ in the Pathfinder system, which would signal that WES is successfully diversifying its customer base beyond its parent, Occidental.
Data Sources
- Western Midstream Partners Q4 2025 earnings release and 8-K filing (SEC EDGAR), used for full-year and quarterly financial results, distribution history, and 2026 guidance figures.
- Western Midstream Q4 2025 earnings call transcript (Alpha Vantage), used for CEO Oscar Brown and CFO Kristen Shults commentary on distribution strategy, Delaware Basin outlook, and Aris integration.
- WES price performance data (Fuse API), used for current unit price, year-to-date return, and post-earnings price reaction.
- Is Western Midstream Partners (WES) Still Attractive After 5-Year 216% Return?, used for five-year return context and DCF valuation reference.