Japan’s Best ETF Trade of 2026 Is Down 9% in a Month and Oil Is Just Getting Started

Photo of David Beren
By David Beren Published

Quick Read

  • iShares MSCI Japan ETF (EWJ) has fallen 9% in the past month despite holding a 5% year-to-date gain, as rising oil prices linked to Middle East conflict threaten Japan’s economy, which depends on the region for 95% of its oil supplies with most traveling through the Strait of Hormuz.

  • Japan’s vulnerability to oil shocks has undercut the ‘Takaichi trade,’ a bet on Prime Minister Sanae Takaichi’s pro-growth agenda and corporate reforms, as Brent crude has climbed from $62.54 in December 2025 to $70.89 in February 2026, risking stagflation and real wage erosion.

This post may contain links from our sponsors and affiliates, and Flywheel Publishing may receive compensation for actions taken through them.
Japan’s Best ETF Trade of 2026 Is Down 9% in a Month and Oil Is Just Getting Started

© anek.soowannaphoom / Shutterstock.com

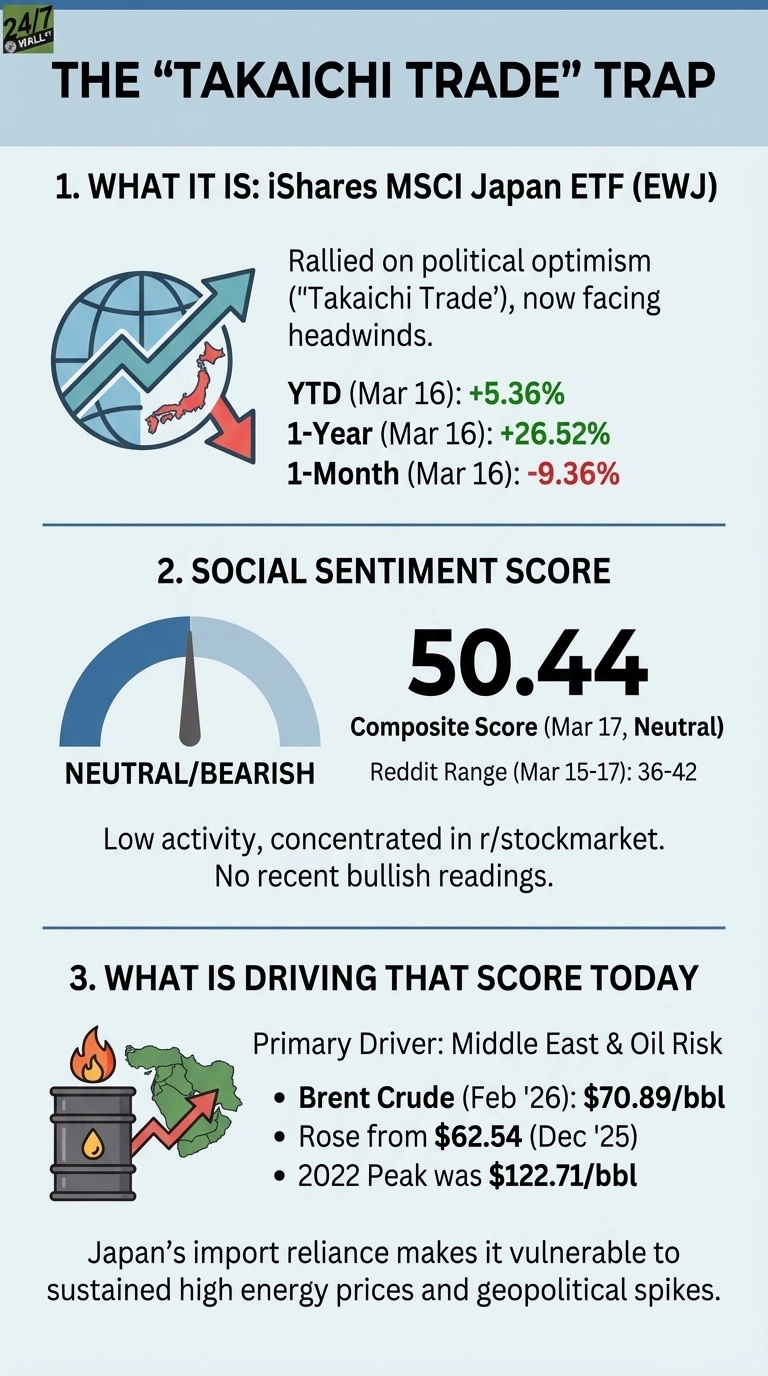
Providing investors with access to the Japanese stock market in a single trade, the iShares MSCI Japan ETF (NYSEARCA:EWJ | EWJ Price Prediction) was one of the best-performing developed-market funds through early 2026, riding political optimism traders dubbed the “Takaichi trade.” That run has hit a wall. EWJ is down 9% over the past month, even as it holds a 5% year-to-date gain and a 20% one-year return. Unsurprisingly, the ongoing conflict in the Middle East has sent oil prices surging, and Japan’s economy sits directly in the line of fire.

The Takaichi trade was built on Prime Minister Sanae Takaichi’s landslide victory and her pro-growth agenda. The Nikkei 225 crossed a new milestone in February as investors priced in higher spending, tax relief, and corporate reform, all while EWJ pulled in $1 billion in a single week in late February 2026 as global investors rotated out of U.S. equities. Then the U.S.-Israeli war on Iran escalated, and the calculus changed fast.

As it stands today, Japan relies on the Middle East for around 95% of its oil, with the bulk of that oil traveling through the Strait of Hormuz. Oil prices surged on fears of prolonged shipping disruptions. An upcoming BOJ policy meeting will be the first real signal of how seriously Tokyo views the threat. Takaichi acknowledged the government was considering emergency measures to prevent gasoline prices from reaching unsustainable levels.

An infographic titled 'THE “TAKAICHI TRADE” TRAP' with three sections. Section 1, 'WHAT IT IS: iShares MSCI Japan ETF (EWJ),' displays a globe with Japan outlined and a zigzag arrow indicating market movement, alongside performance figures: YTD (Mar 16): +5.36%, 1-Year (Mar 16): +26.52%, and 1-Month (Mar 16): -9.36%. Section 2, 'SOCIAL SENTIMENT SCORE,' shows a gauge pointing to 'NEUTRAL/BEARISH' with a score of 50.44 and a Reddit Range of 36-42 from March 15-17. Section 3, 'WHAT IS DRIVING THAT SCORE TODAY,' features an oil barrel with a flame and a map of Japan, listing Brent Crude (Feb '26) at $70.89/bbl, which rose from $62.54 (Dec '25), and a 2022 Peak of $122.71/bbl.
24/7 Wall St.
This infographic details the performance of the iShares MSCI Japan ETF (EWJ) amidst the ‘Takaichi Trade,’ highlighting its recent decline and the influence of rising oil prices and social sentiment.

EWJ’s Sentiment Turns Cautious as Oil Risk Mounts

Social discussion of EWJ has been concentrated entirely in r/stockmarket, with activity low and sentiment oscillating between neutral and bearish. Scores have ranged from 36 to 42 over the past several days, with no bullish readings recorded. The composite sentiment index sits at 50.


The bearish case rests on three structural vulnerabilities:

  • Japan imports a significant share of its oil from the Middle East, making it one of the most energy-exposed developed economies when regional conflict disrupts supply.
  • Brent crude has climbed from $62.54 in December 2025 to $70.89 in February 2026, and analysts warn that sustained elevated oil prices would erode real wages and trigger stagflation risks.
  • The Takaichi trade was built on a political narrative, not economic fundamentals. Japan’s economy contracted quarter-on-quarter in late 2025, and bankruptcy cases rose 11.3% year-over-year in February 2026.

What the $100 Oil Scenario Actually Means for Japan

Despite Brent crude climbing above $100 to $102.50 as of March 17, history suggests these geopolitical spikes can be transitory, much like the surge to $122.71 during the 2022 energy crisis. For the Japanese market, this volatility is largely noise; the structural story of corporate reform, dividend growth, and the unwinding of cross-shareholdings remains intact regardless of near-term oil fluctuations.

The BOJ’s upcoming policy meeting will be the first real signal: if Ueda holds rates steady specifically because of oil-driven economic risk, that would signal how seriously Tokyo views the threat.

Photo of David Beren
About the Author David Beren →

David Beren has been a Flywheel Publishing contributor since 2022. Writing for 24/7 Wall St. since 2023, David loves to write about topics of all shapes and sizes. As a technology expert, David focuses heavily on consumer electronics brands, automobiles, and general technology. He has previously written for LifeWire, formerly About.com. As a part-time freelance writer, David’s “day job” has been working on and leading social media for multiple Fortune 100 brands. David loves the flexibility of this field and its ability to reach customers exactly where they like to spend their time. Additionally, David previously published his own blog, TmoNews.com, which reached 3 million readers in its first year. In addition to freelance and social media work, David loves to spend time with his family and children and relive the glory days of video game consoles by playing any retro game console he can get his hands on.

Featured Reads

Our top personal finance-related articles today. Your wallet will thank you later.

Continue Reading

Top Gaining Stocks

CBOE Vol: 1,568,143
PSKY Vol: 12,285,993
STX Vol: 7,378,346
ORCL Vol: 26,317,675
DDOG Vol: 6,247,779

Top Losing Stocks

LKQ
LKQ Vol: 4,367,433
CLX Vol: 13,260,523
SYK Vol: 4,519,455
MHK Vol: 1,859,865
AMGN Vol: 3,818,618