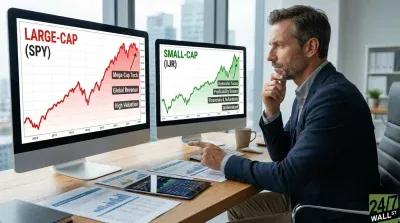
Small caps are having a better 2026 than most investors expected. While large-cap indexes have struggled under the weight of mega-cap volatility, smaller comapnies with more domestic revenue have quietly held up better. The iShares Russell 2000 ETF (NYSE: IWM | IWM Price Prediction) is up 2.26% year-to-date as of April 2, while the iShares Core S&P Small-Cap ETF (NYSE:IJR) has gained 4.53% over the same period.
The good news is that both are beating the broader market by a meaningful margin, which has brought renewed attention to a comparison most investors have never thought through carefully. The two funds look similar on the surface, as both hold small-cap US stocks and both come from iShares.
The similarities continue when you consider that both have billions in assets and decades of history, but the way they select companies is fundamentally different, and the difference shows up in the returns, the risk profile, and the long-term performance trajectory. Knowing which one you own and why matters more than most people realize.
The Numbers Side-by-Side
| IJR | IWM | |
| Year-to-Date Return | 2.26% | 4.53% |
| 1-Year Return | 25.33% | 19.56% |
| 3-Year Return | 13.45% | 10.83% |
| Expense Ratio | 0.19% | 0.06% |
The 1-year return favors the iShares Russell ETF according to April 2, 2026, numbers from Yahoo Finance, but the YTD and cost story favors the iShares Core S&P Small-Cap ETF, and understanding why requires looking at what each fund actually owns.
The Index Methodology Is Where Everything Diverges
The iShares Russell 2000 ETF tracks the Russell 2000 index, which comprises the 2,000 smallest companies after the largest 1,000 have been excluded. There is no profitability requirement, and a company that has never earned a dollar of profit can sit inside this fund indefinitely as long as it meets the size criteria. Roughly 40% of the iShares Russell 2000 ETF’s holdings are currently unprofitable. Currently, healthcare leads the sector mix at 17.56%, followed by industrials at 16.84%, financial services at 15.65%, and technology at 15.16%
The iShares Core S&P Small-Cap ETF tracks the S&P SmallCap 600, which requires demonstrated earnings before a company can be included. This single filter changes the character of the fund entirely, as you are not just getting smaller companies, you are getting smaller companies that are actually making money. Financial services lead the way at 16.56%, industrials at 16.19%, consumer cyclical at 14.57%, and technology at 14.42%. The top ten holdings represent just 6.71% of total assets, reflecting how broadly distributed the exposure is across quality-screened names.
The cost difference compounds that quality advantage over time, and at 0.06%, the iShares Core S&P Small-Cap ETF costs roughly one-third of what the iShares Russell 2000 ETF charges at 0.19%. On a $10,000 investment, that is $130 per year in additional fees for the iShares Russell 2000 ETF, every year, regardless of performance.
The Valuation Picture
Small caps trade at a meaningful discount to large caps on a price-to-earnings basis, a gap near historic highs. The iShares Russell 2000 ETF has a PE ratio of 18.36, while the iShares Core S&P ETF has a PE ratio of 17.71, both considerably lower than the S&P 500.
When economic growth broadens beyond mega-cap companies, smaller businesses with operational leverage tend to benefit the most. Both funds are positioned to capture that rotation. The iShares Core S&P Small-Cap ETF just does it with a higher-quality underlying portfolio.
Which One Should You Own
For long-term buy-and-hold investors, the iShares Core S&P Small-Cap ETF is the stronger core holding. The profitability screen removes the drag of unprofitable companies, which weigh on returns over full market cycles. The lower expense ratio compounds that advantage every year. And the historical record of better risk-adjusted returns over long periods makes the quality tilt worth paying attention to.
The iShares Russell 2000 ETF serves a different purpose as it is the benchmark that institutional investors, options traders, and financial media reference when discussing small-cap performance. If you need to track that benchmark precisely, hedge against it, or trade options tied to it, the iShares Russell 2000 ETF is the right tool. The liquidity and depth of its options market are unmatched in the small-cap space.
The bottom line is to know which job you need the funds for. If the answer is long-term compounding with small-cap exposure, the iShares Core S&P Small-Cap ETF is the better answer.